Download as PDF, PPTX

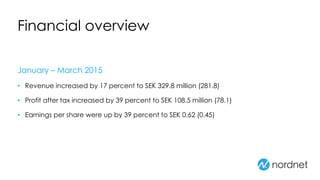

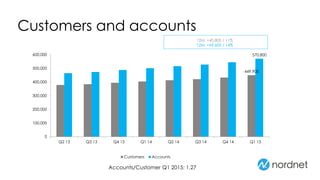
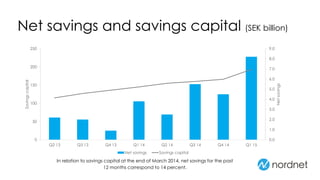
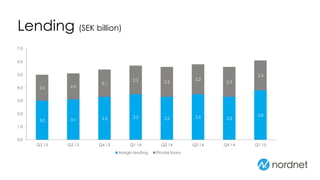
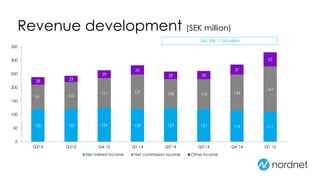
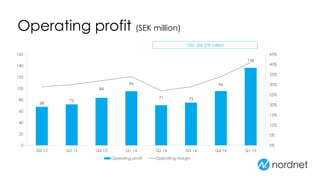
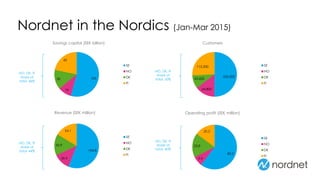


- In Q1 2015, Nordnet saw a 17% increase in revenue to SEK 329.8 million and a 39% increase in profit after tax to SEK 108.5 million. Earnings per share increased 39% to SEK 0.62. - Highlights included the best operating profit in Nordnet's history, high growth in customers and savings, and the launch of mobile apps and low-interest loans with securities as collateral. - The number of customers increased by 45,800 (11%) and the number of accounts increased by 69,600 (14%) over the past 12 months.


