Download to read offline
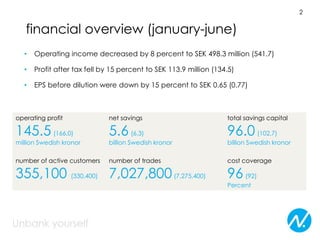
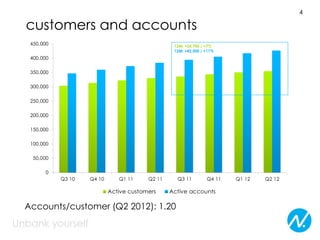
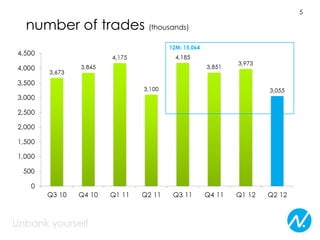
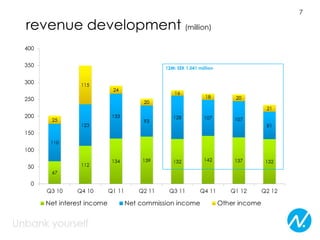
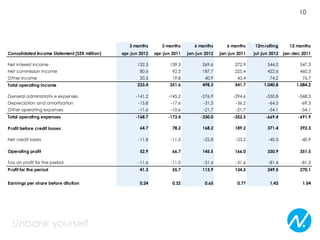


The interim report summarizes Nordnet's financial performance for the first half of 2012. Key points include: - Operating income and profit after tax decreased by 8% and 15% respectively compared to the first half of 2011. - The number of active customers increased to 355,100, up from 330,400 in the same period last year, while the number of trades fell slightly to 7,027,800 from 7,275,400. - Strategic priorities are to have the most satisfied customers, strengthen the Nordnet brand as the leading savings bank in the Nordic region, and improve profit levels.


