Download to read offline

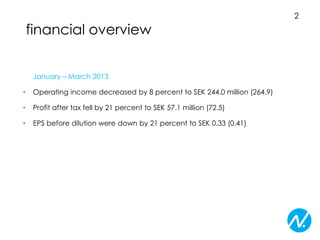
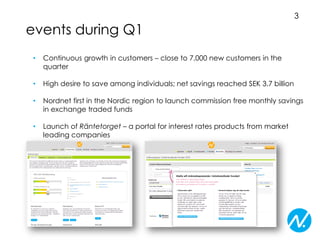
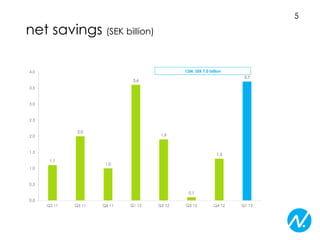
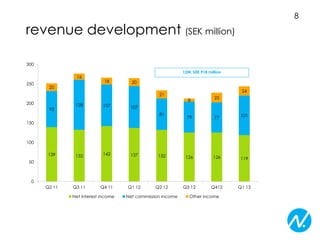
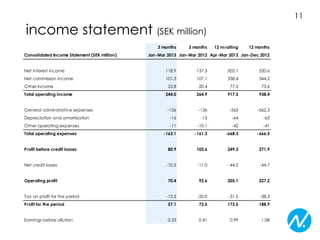


- Nordnet's operating income decreased 8% to SEK 244.0 million in the first quarter of 2013 compared to the same period in 2012, while profit after tax fell 21% to SEK 57.1 million. - Nordnet gained close to 7,000 new customers in the first quarter and launched commission-free monthly savings in exchange traded funds. - Net savings reached SEK 3.7 billion in the first quarter, up from SEK 3.6 billion in the same period in 2012.


