Download to read offline
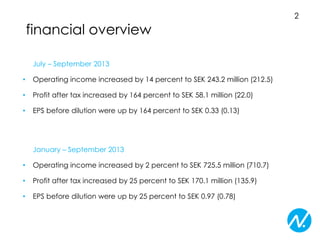
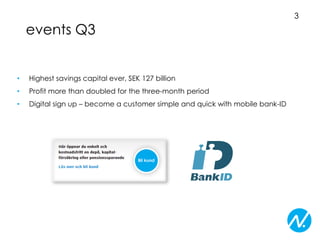
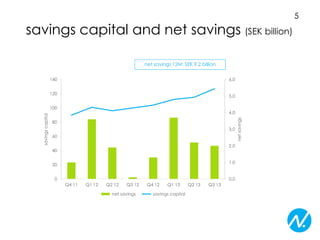
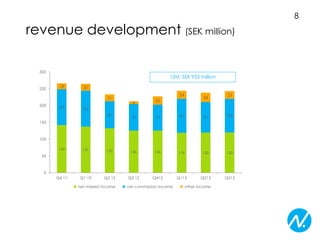
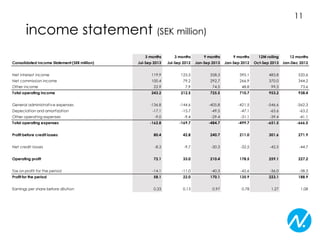
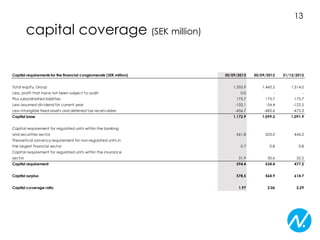

The financial overview from January to September 2013 shows significant improvements, with operating income up by 2% and profit after tax up by 25% compared to the previous year. In Q3, operating income increased by 14% to SEK 243.2 million and profit after tax surged by 164% to SEK 58.1 million. Key events included reaching the highest savings capital ever at SEK 127 billion and a doubling of profit for the three-month period.


