Download to read offline

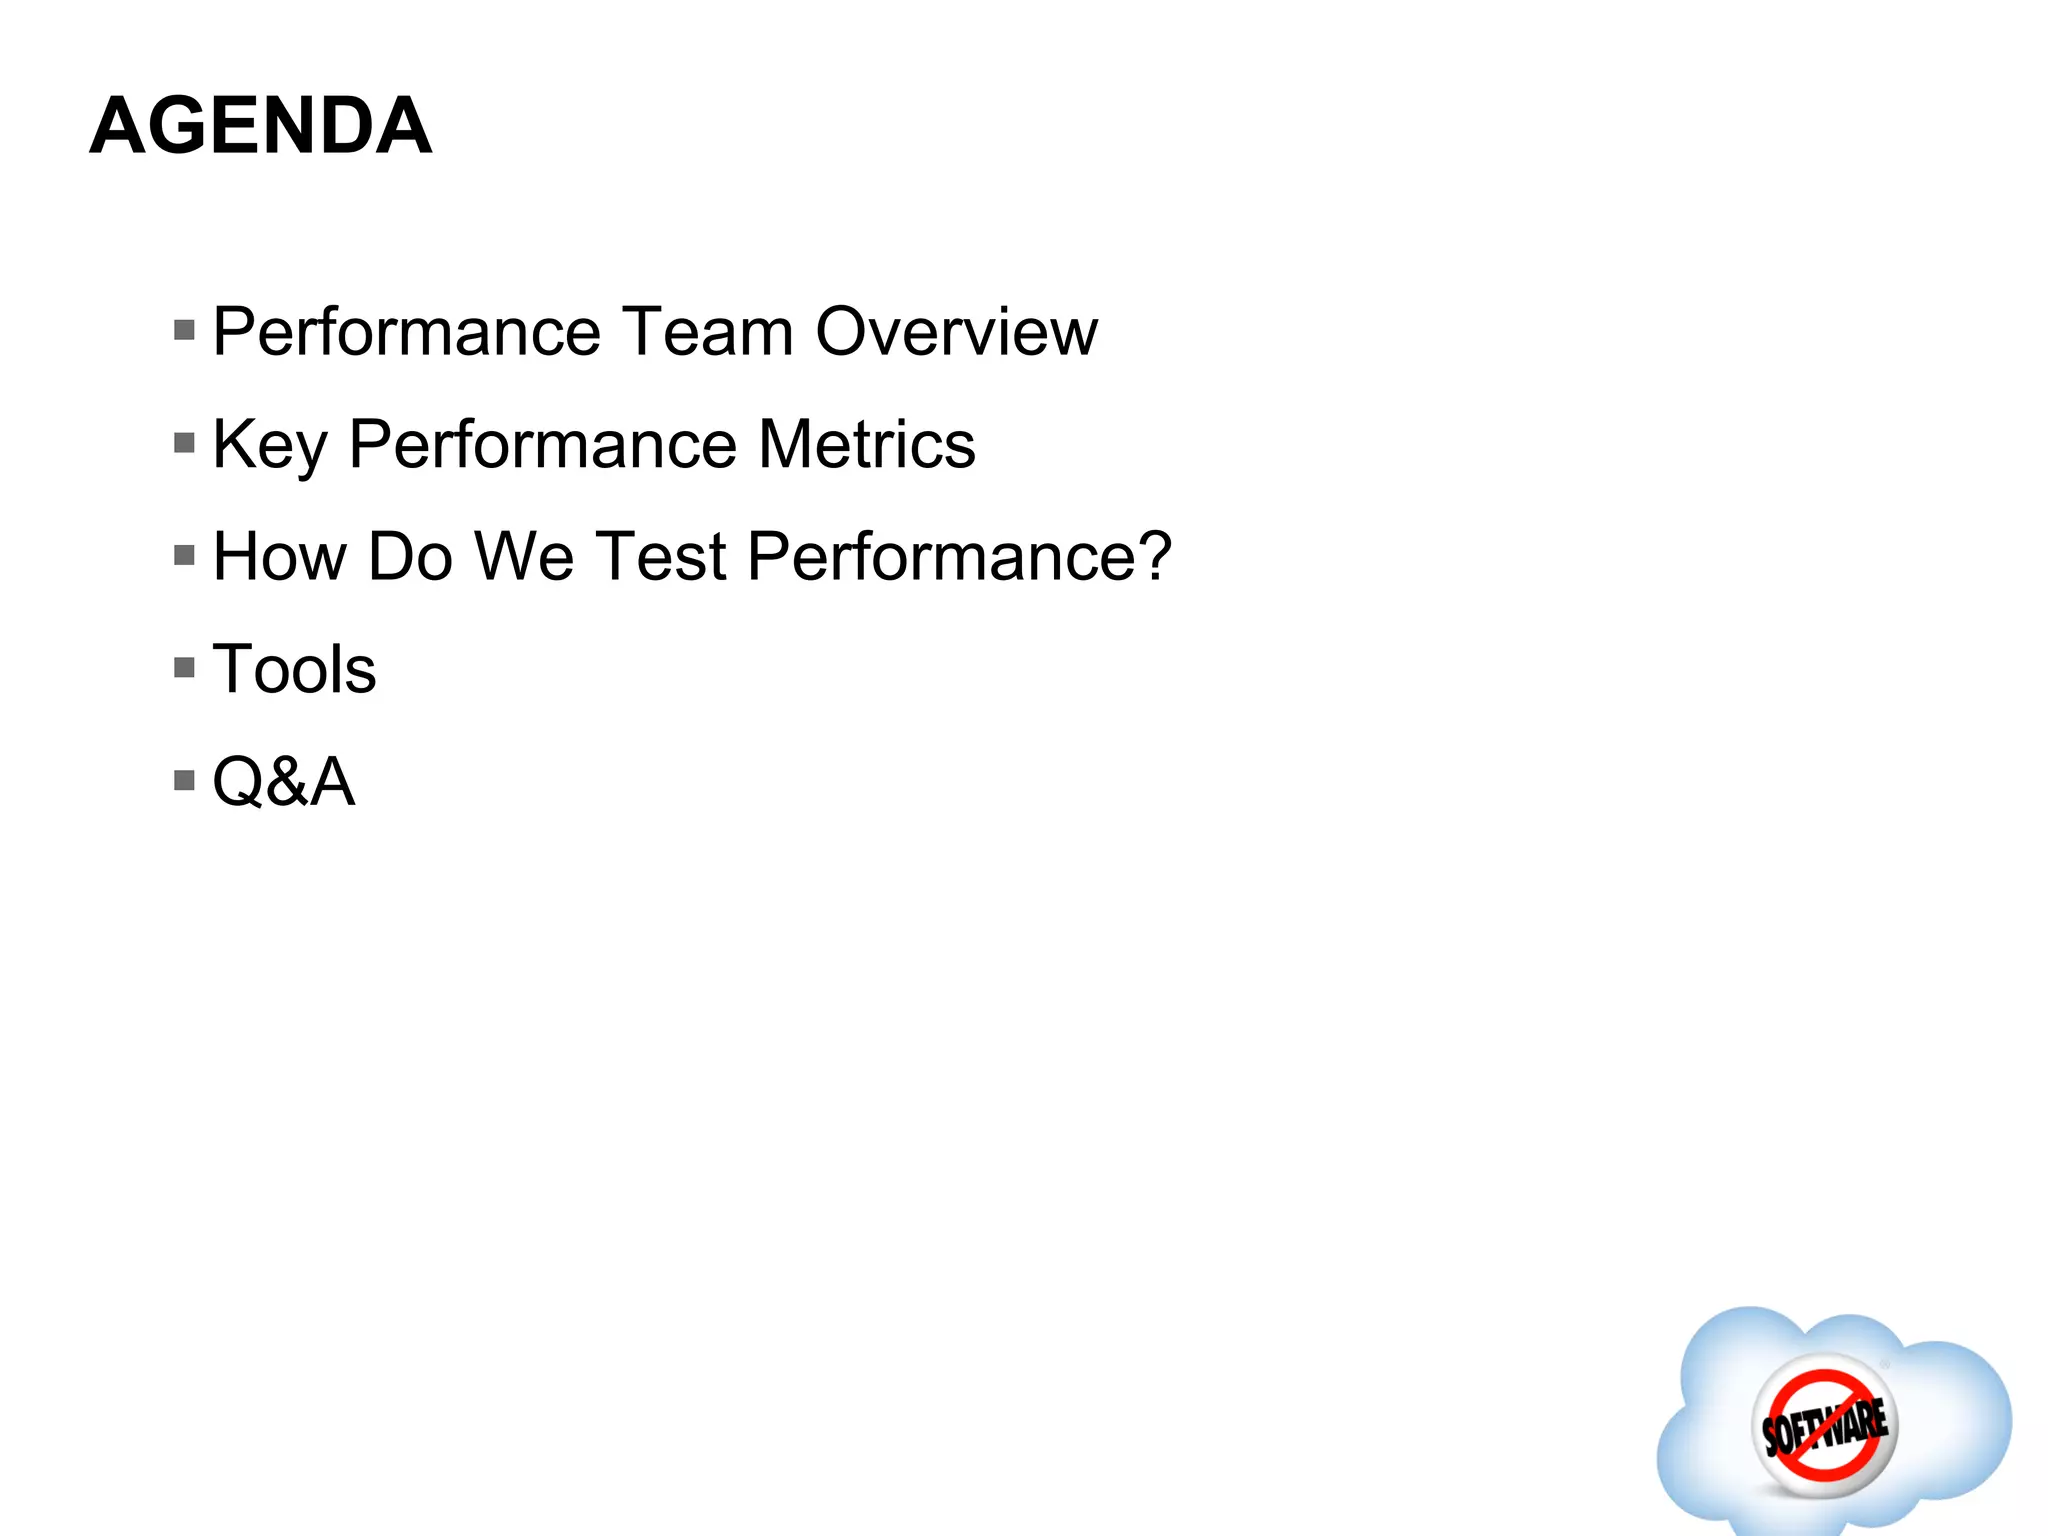
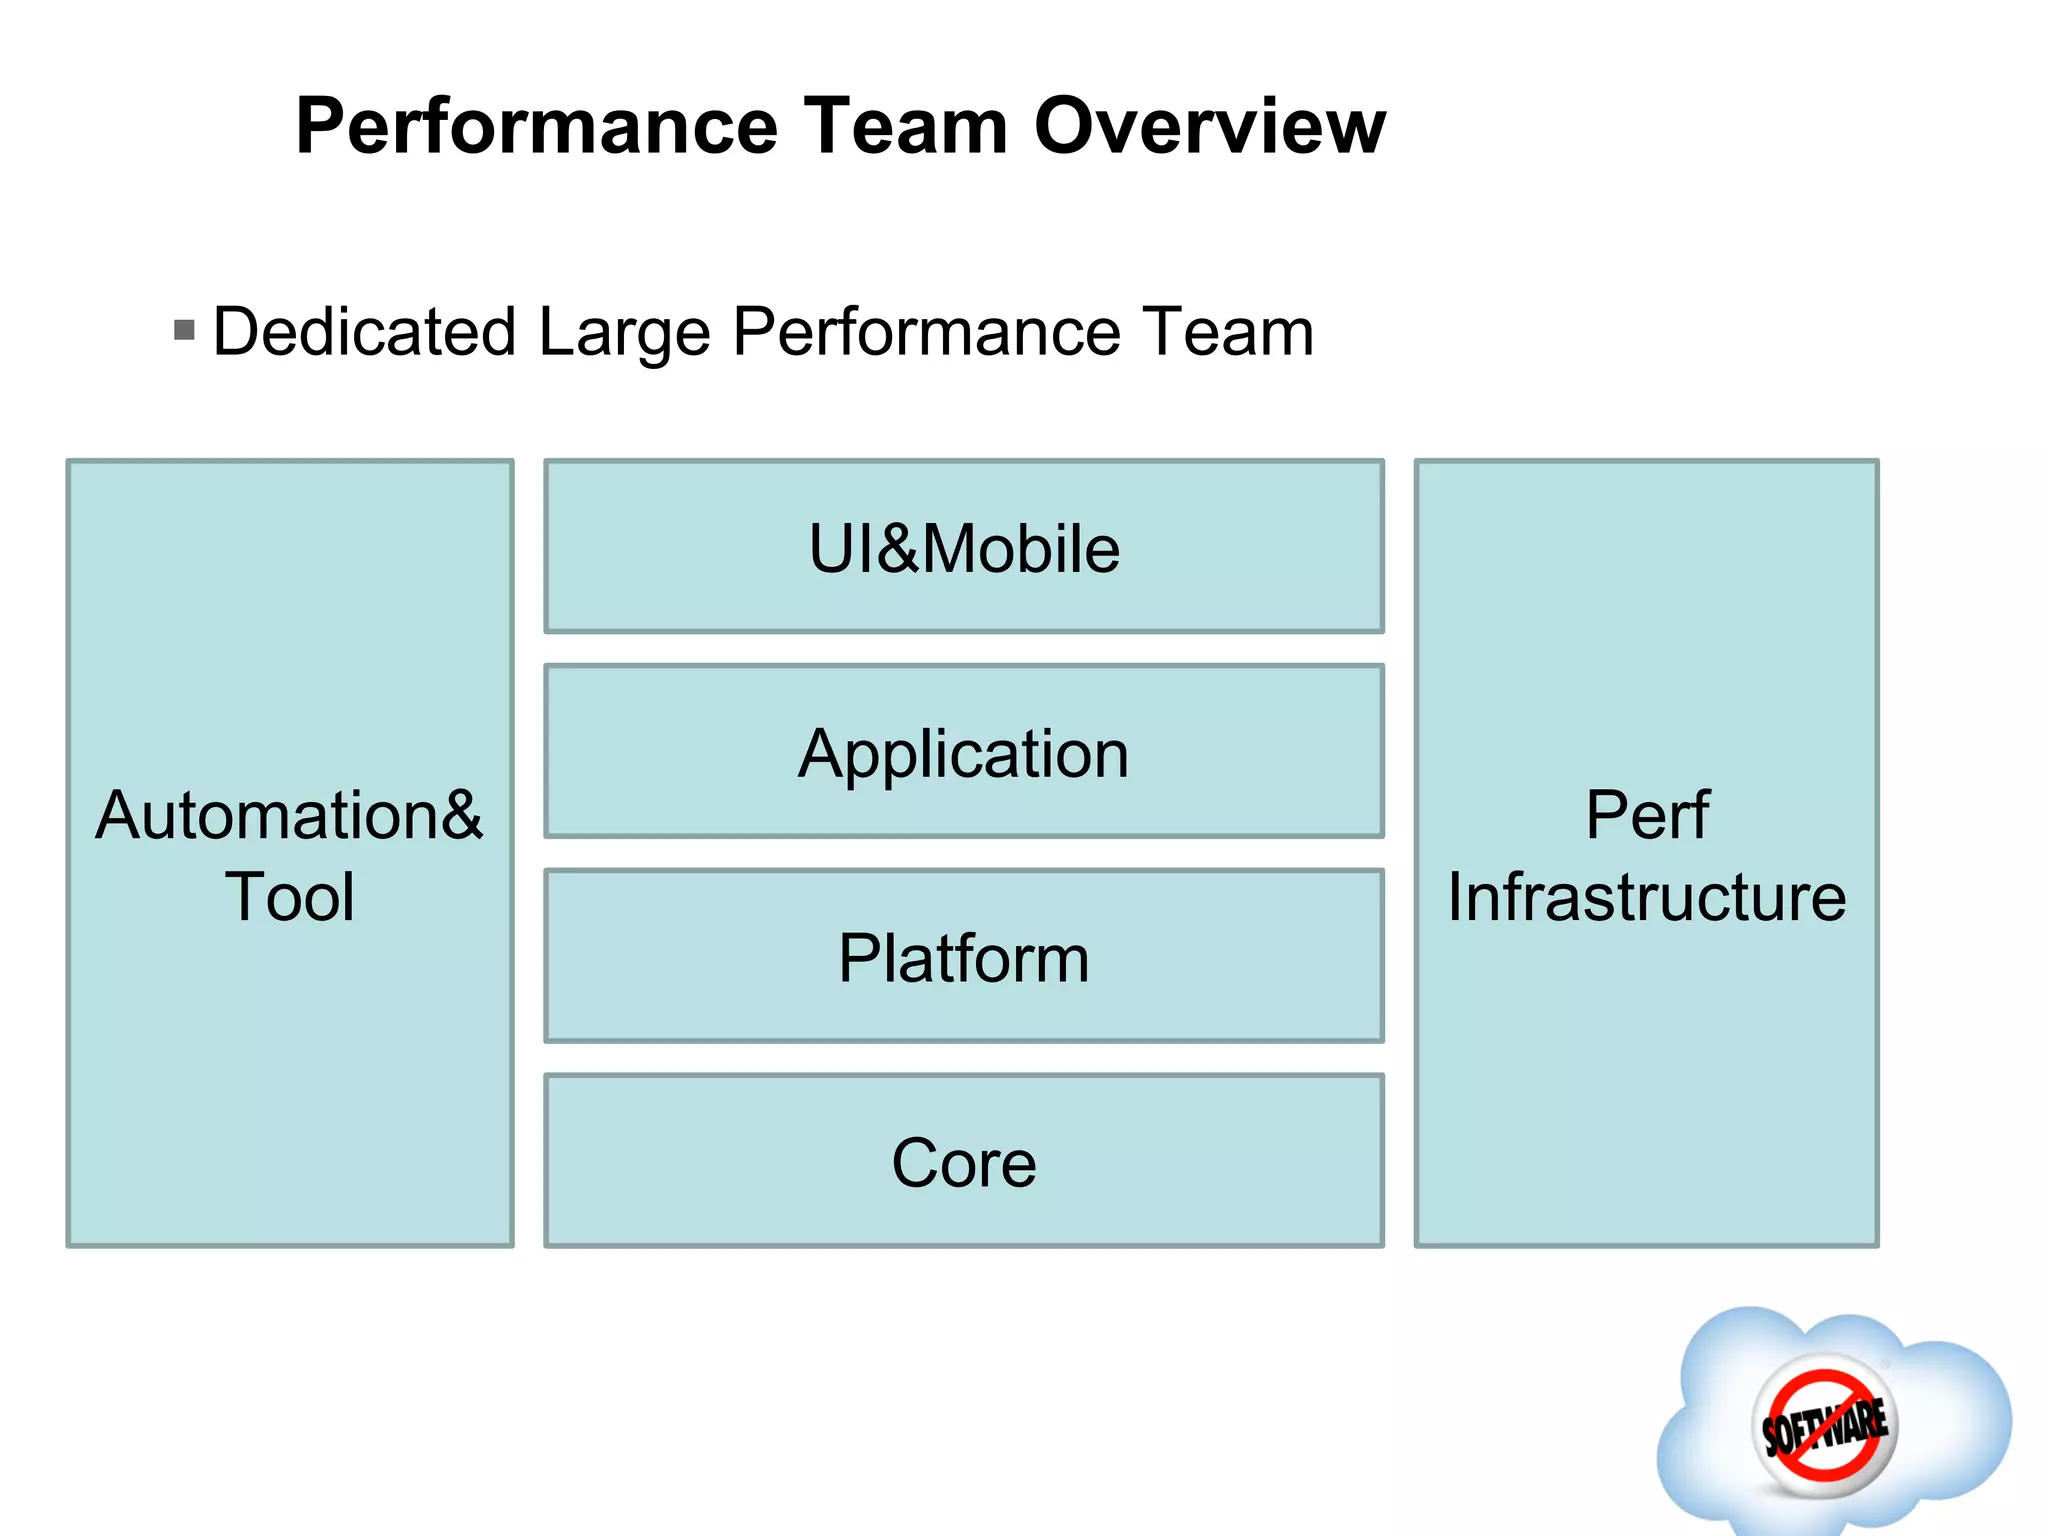
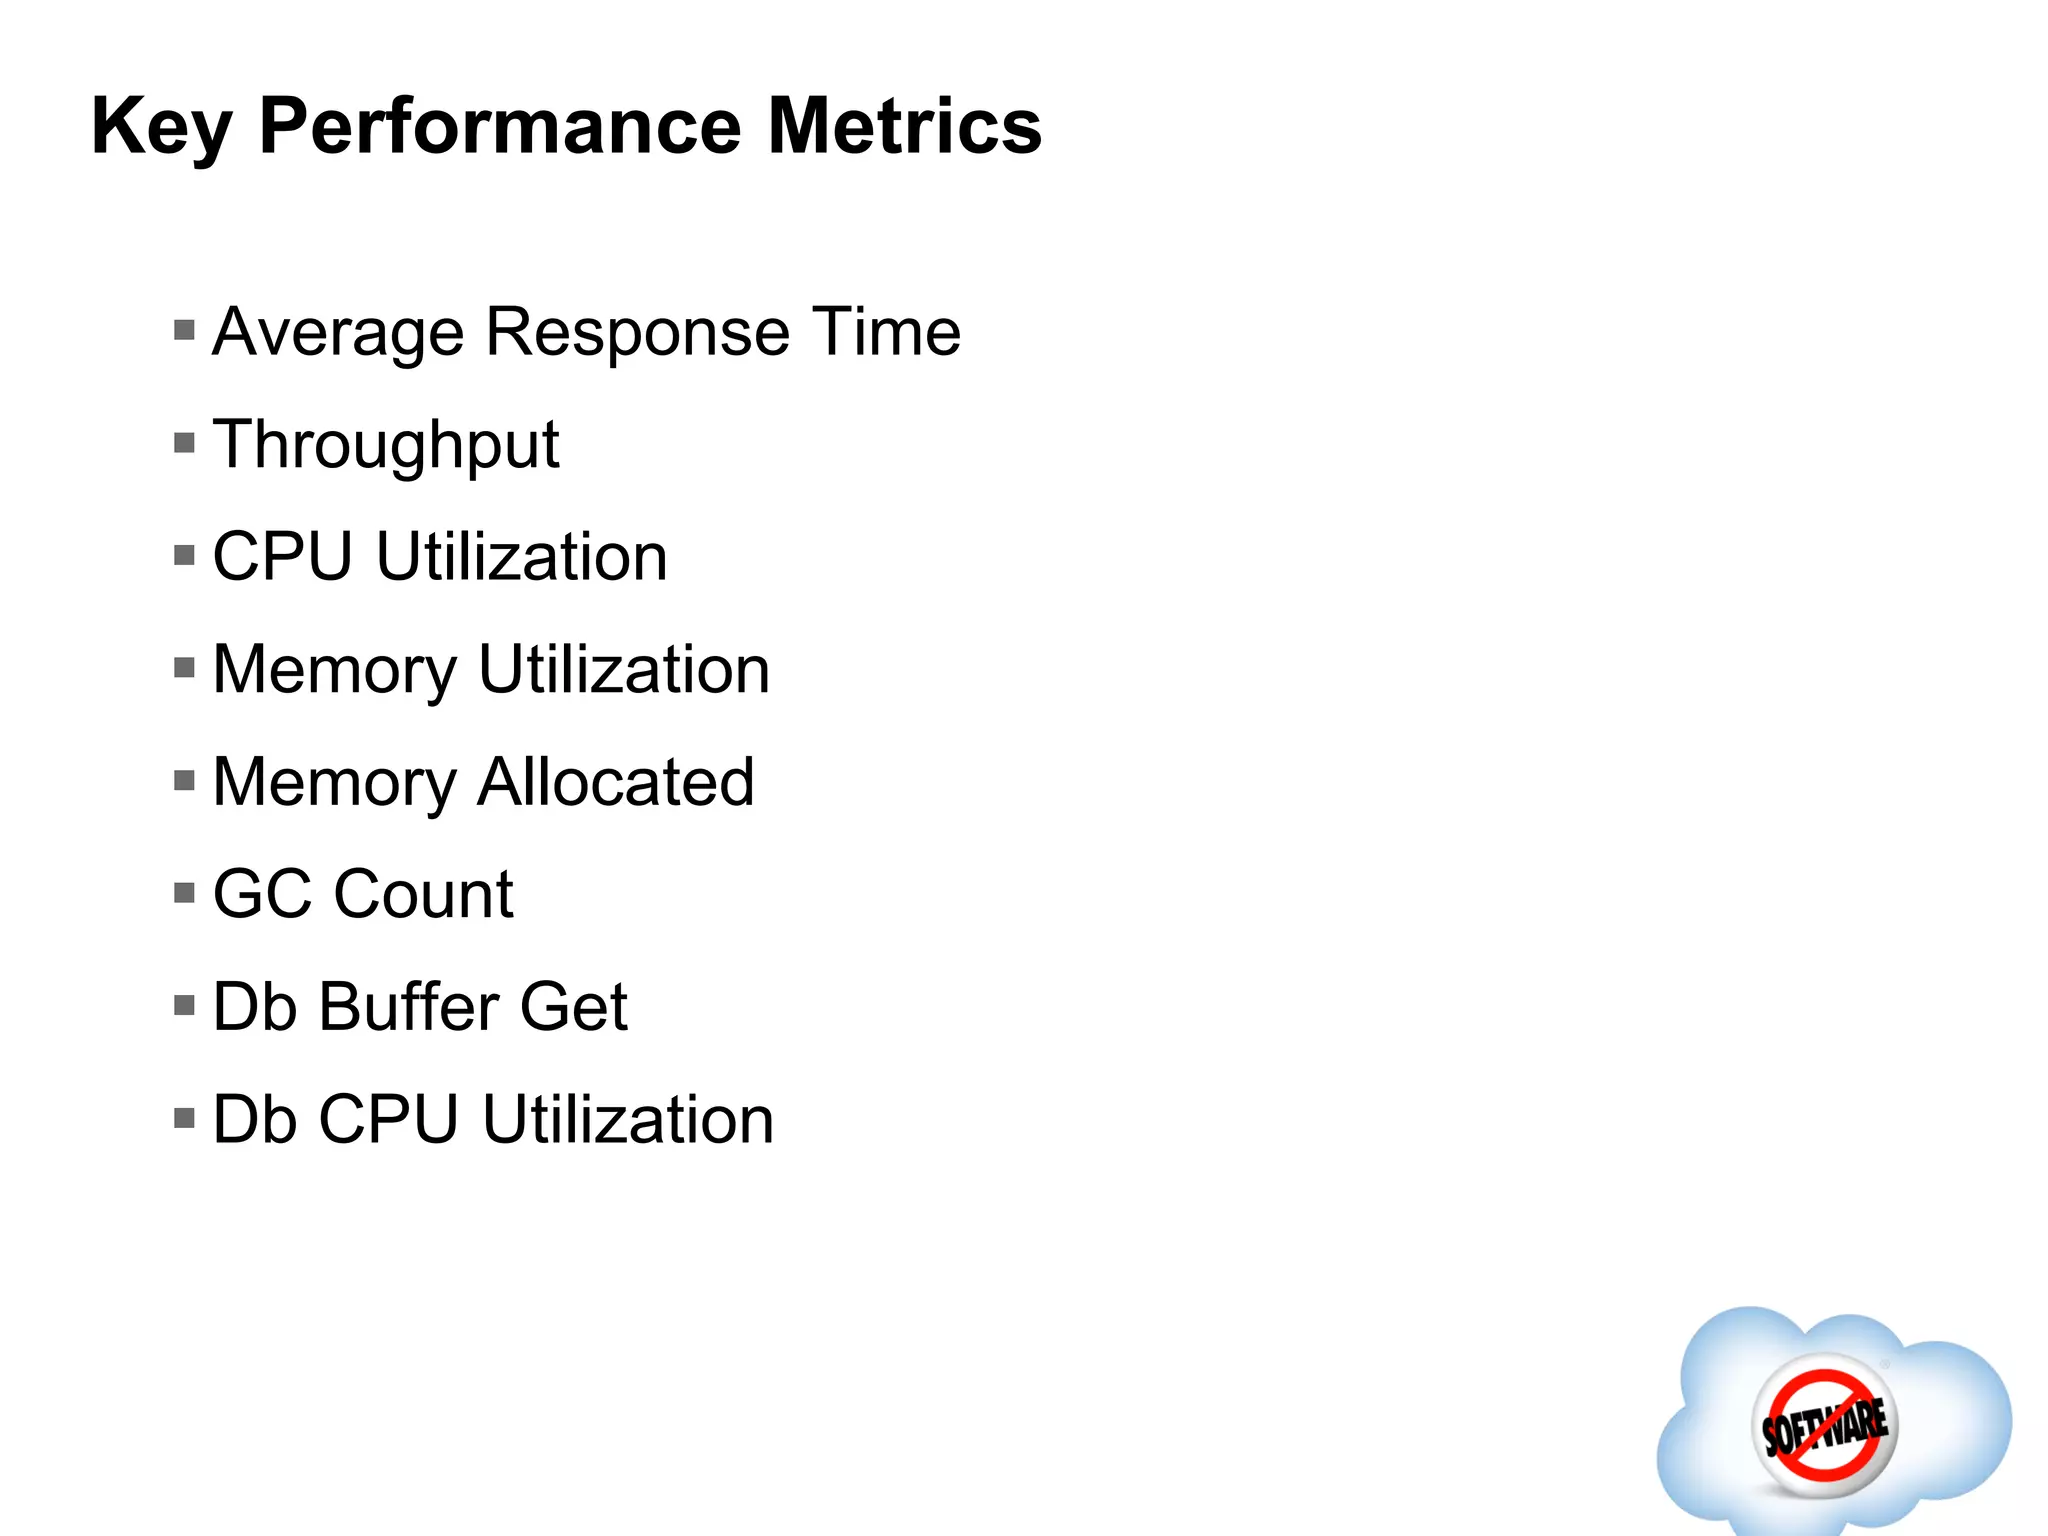
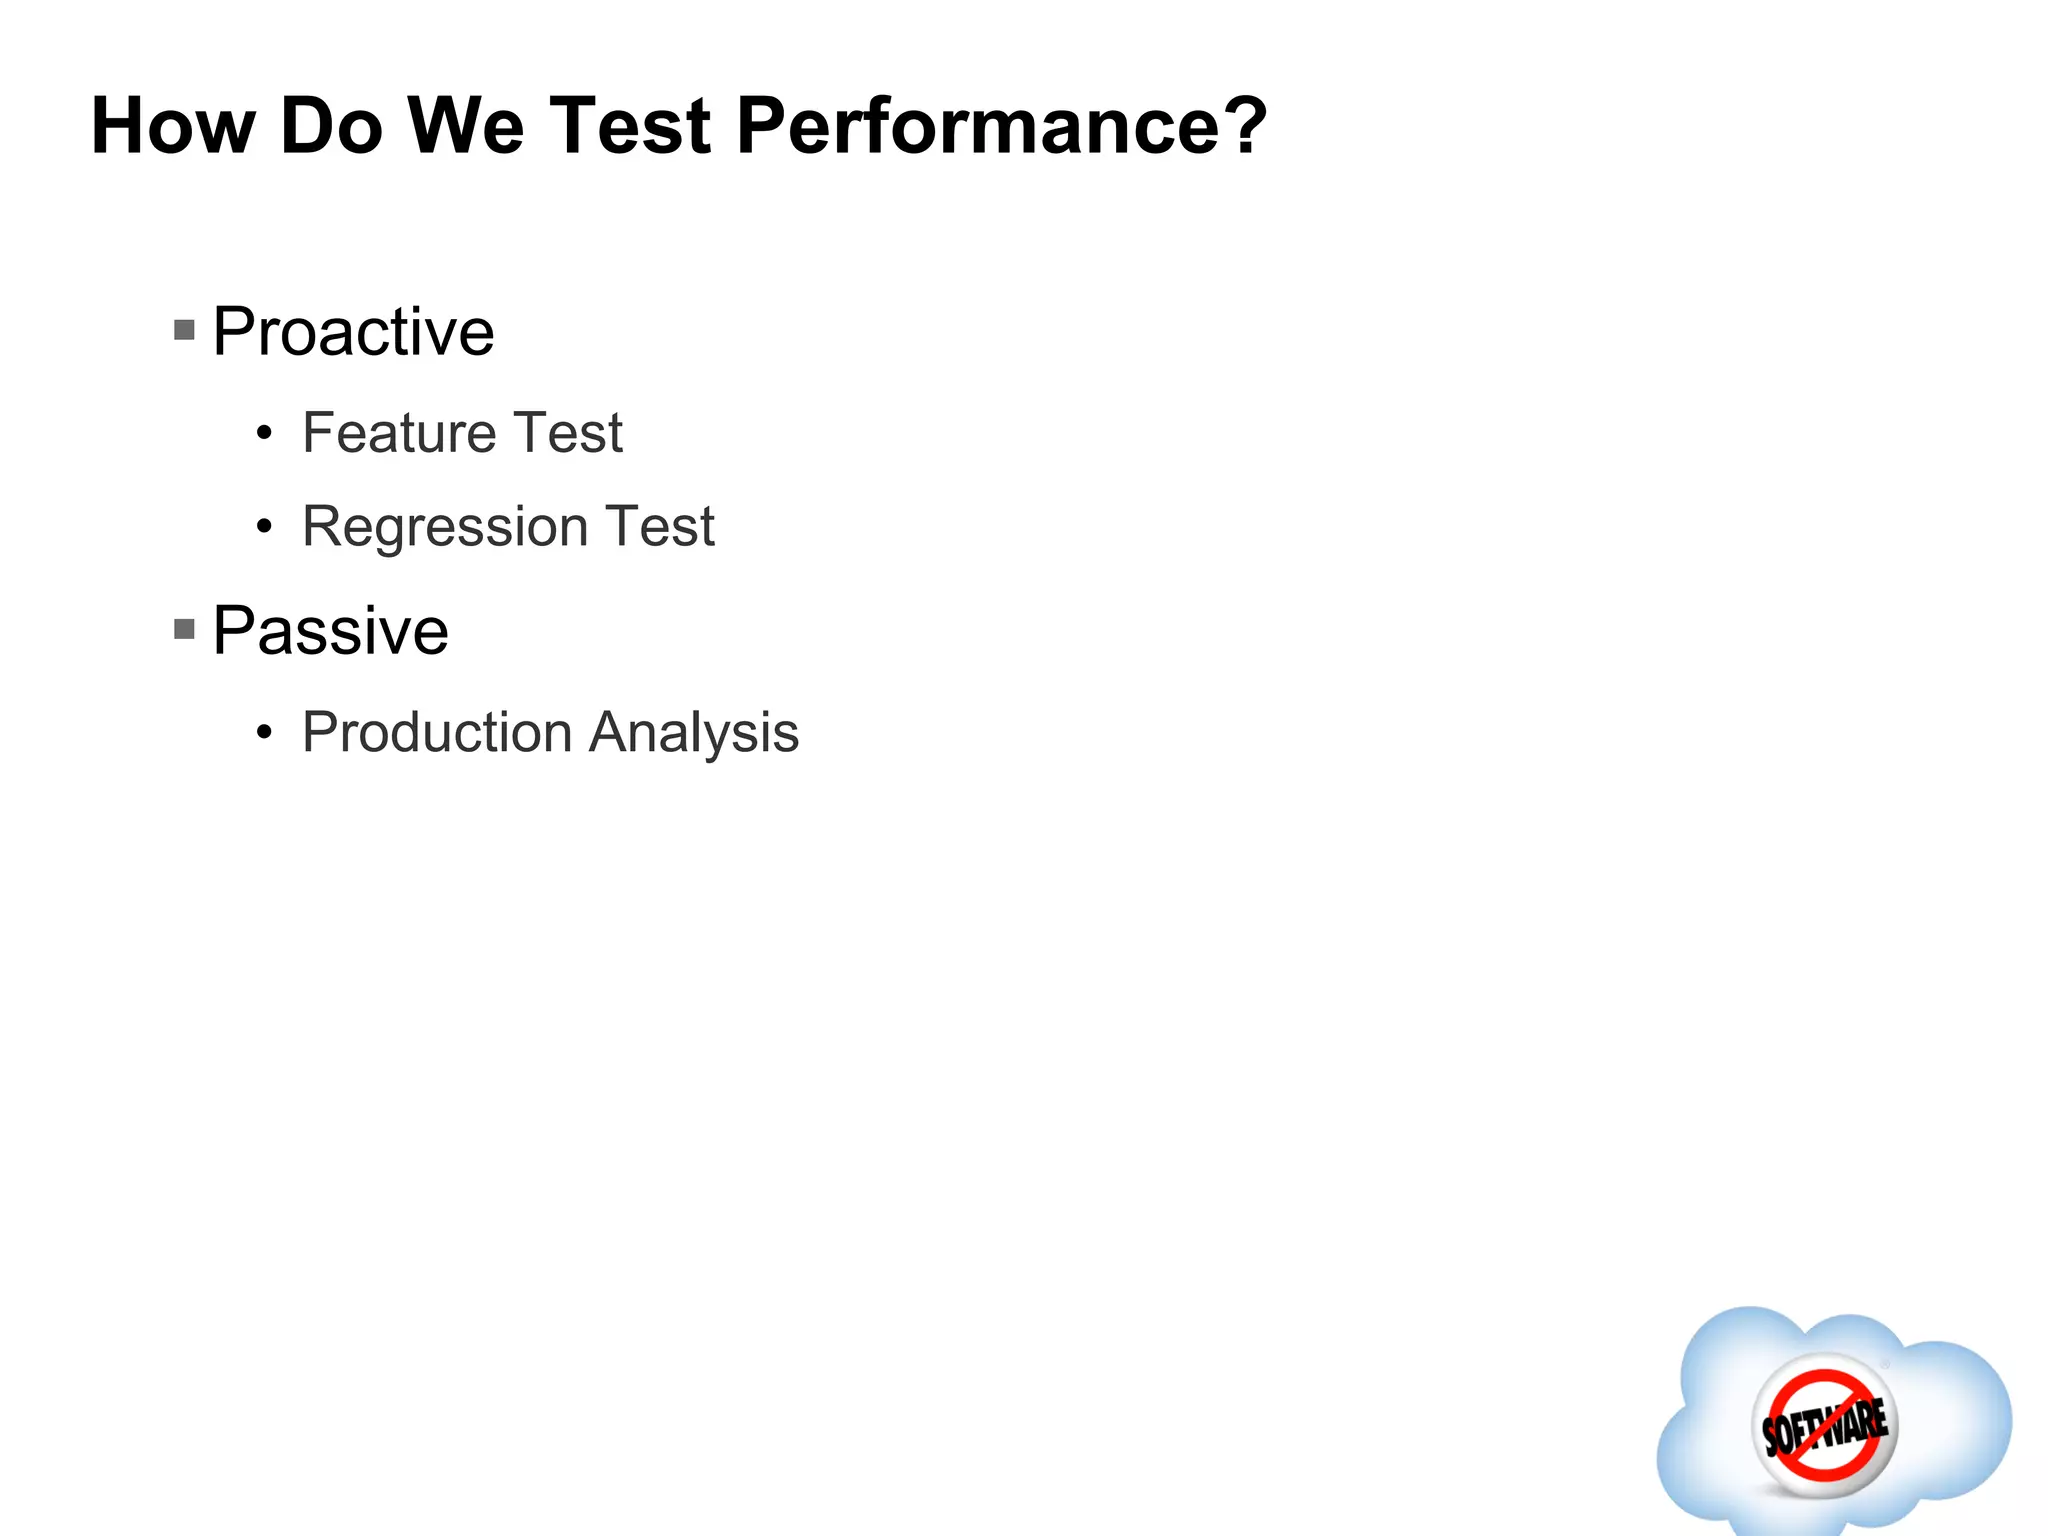
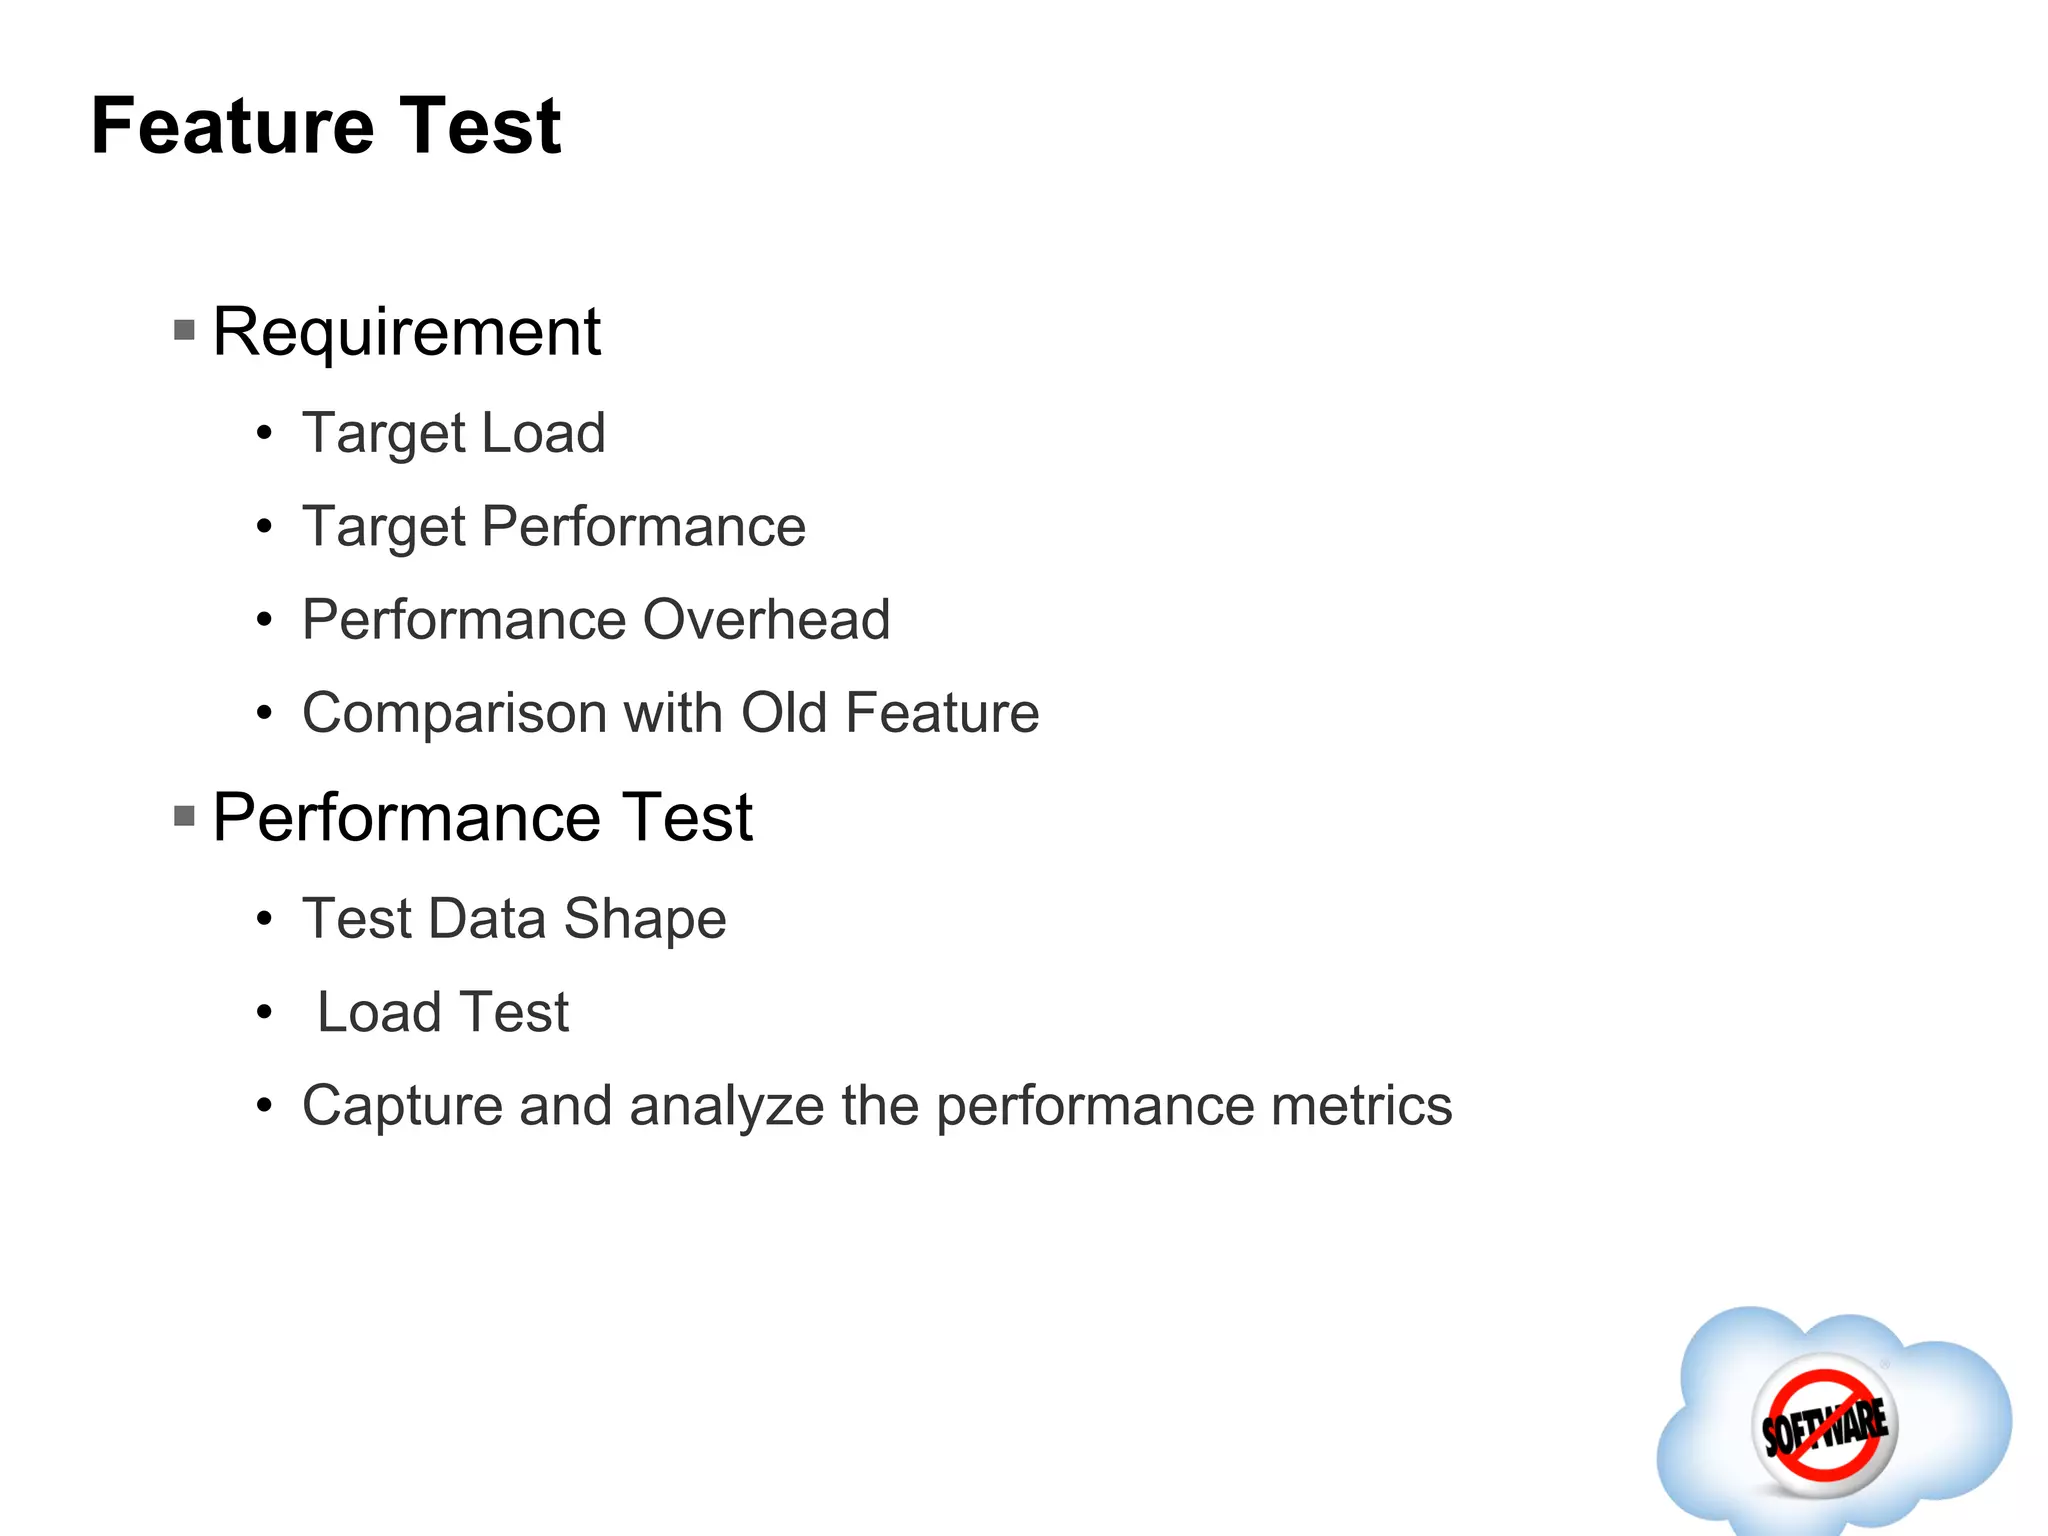
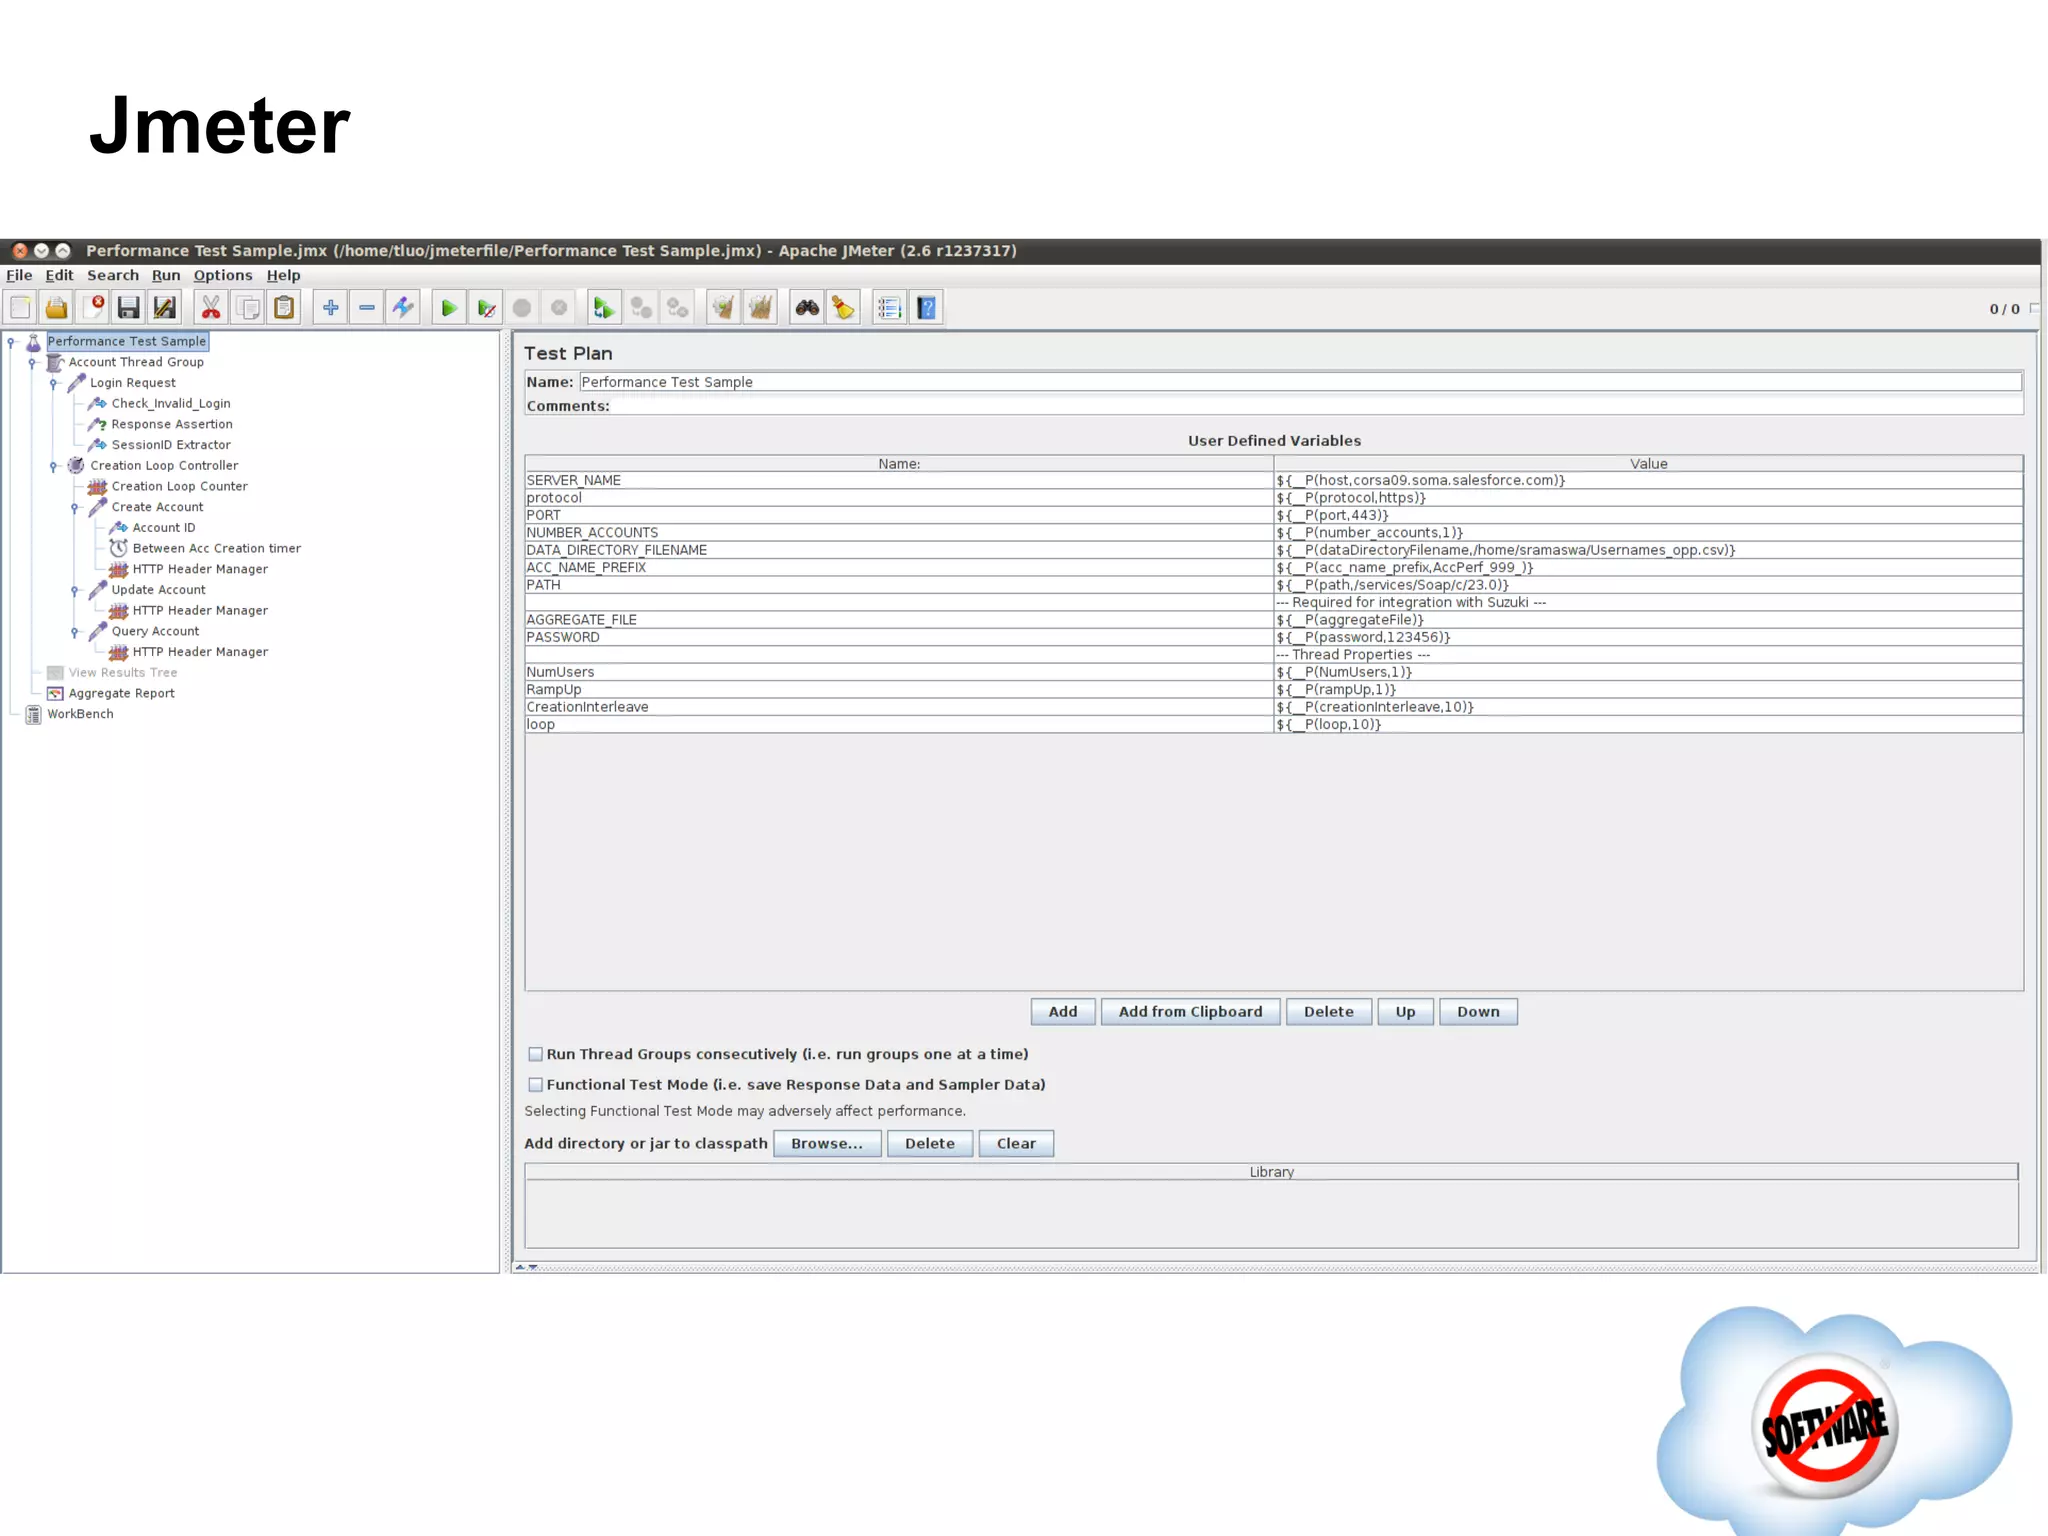
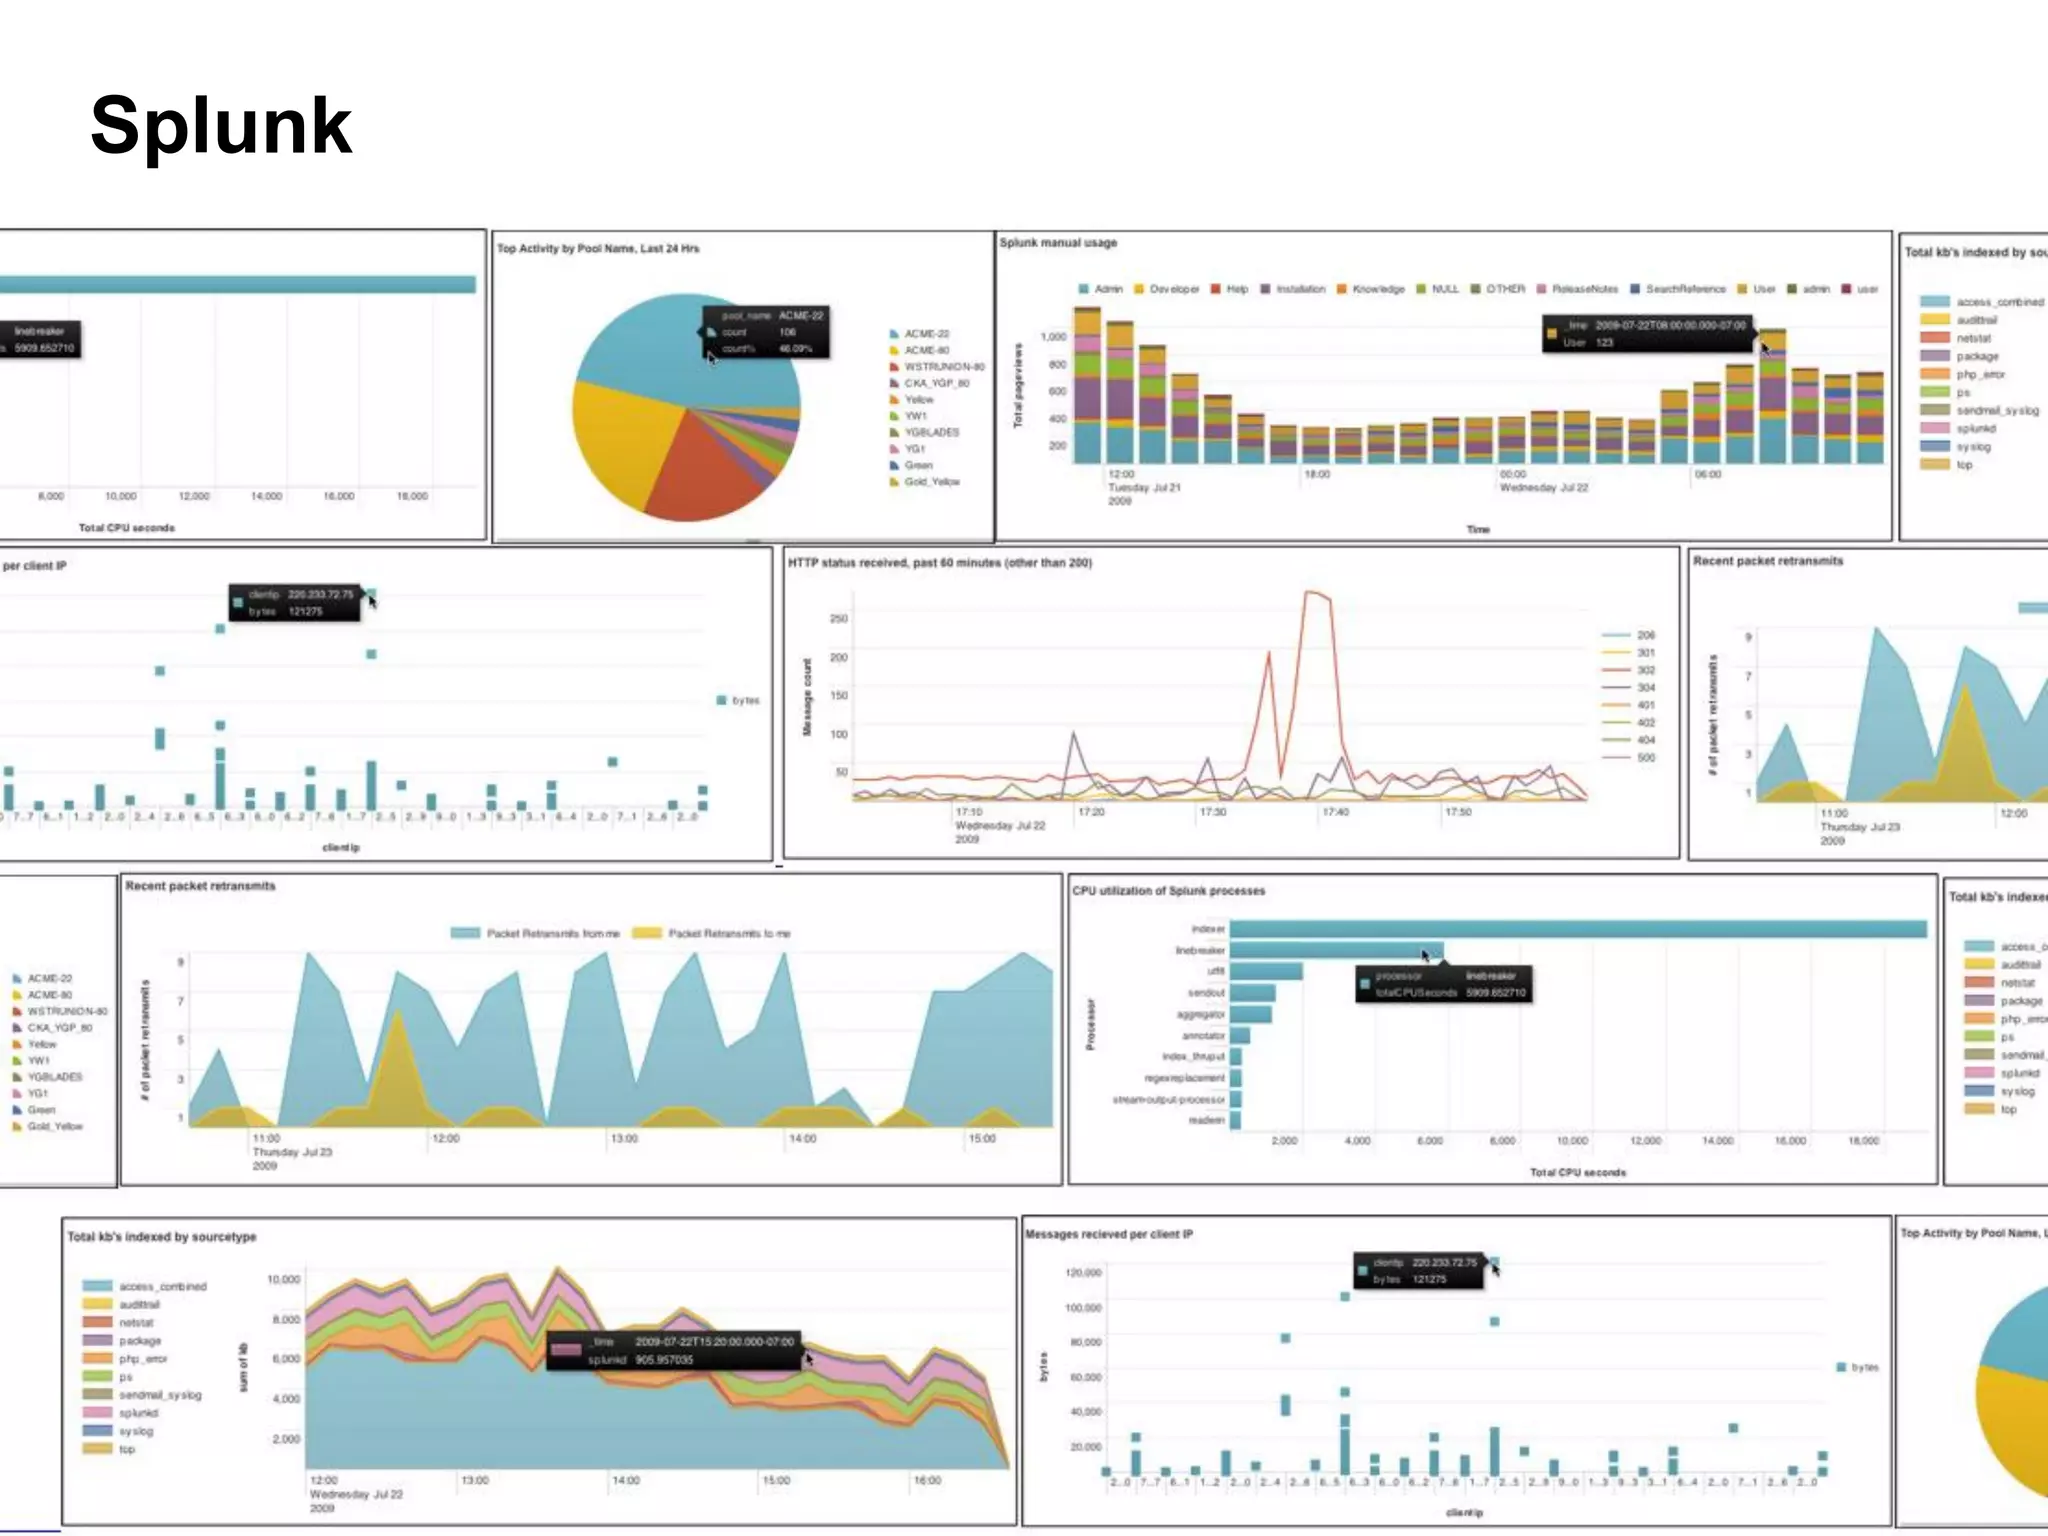
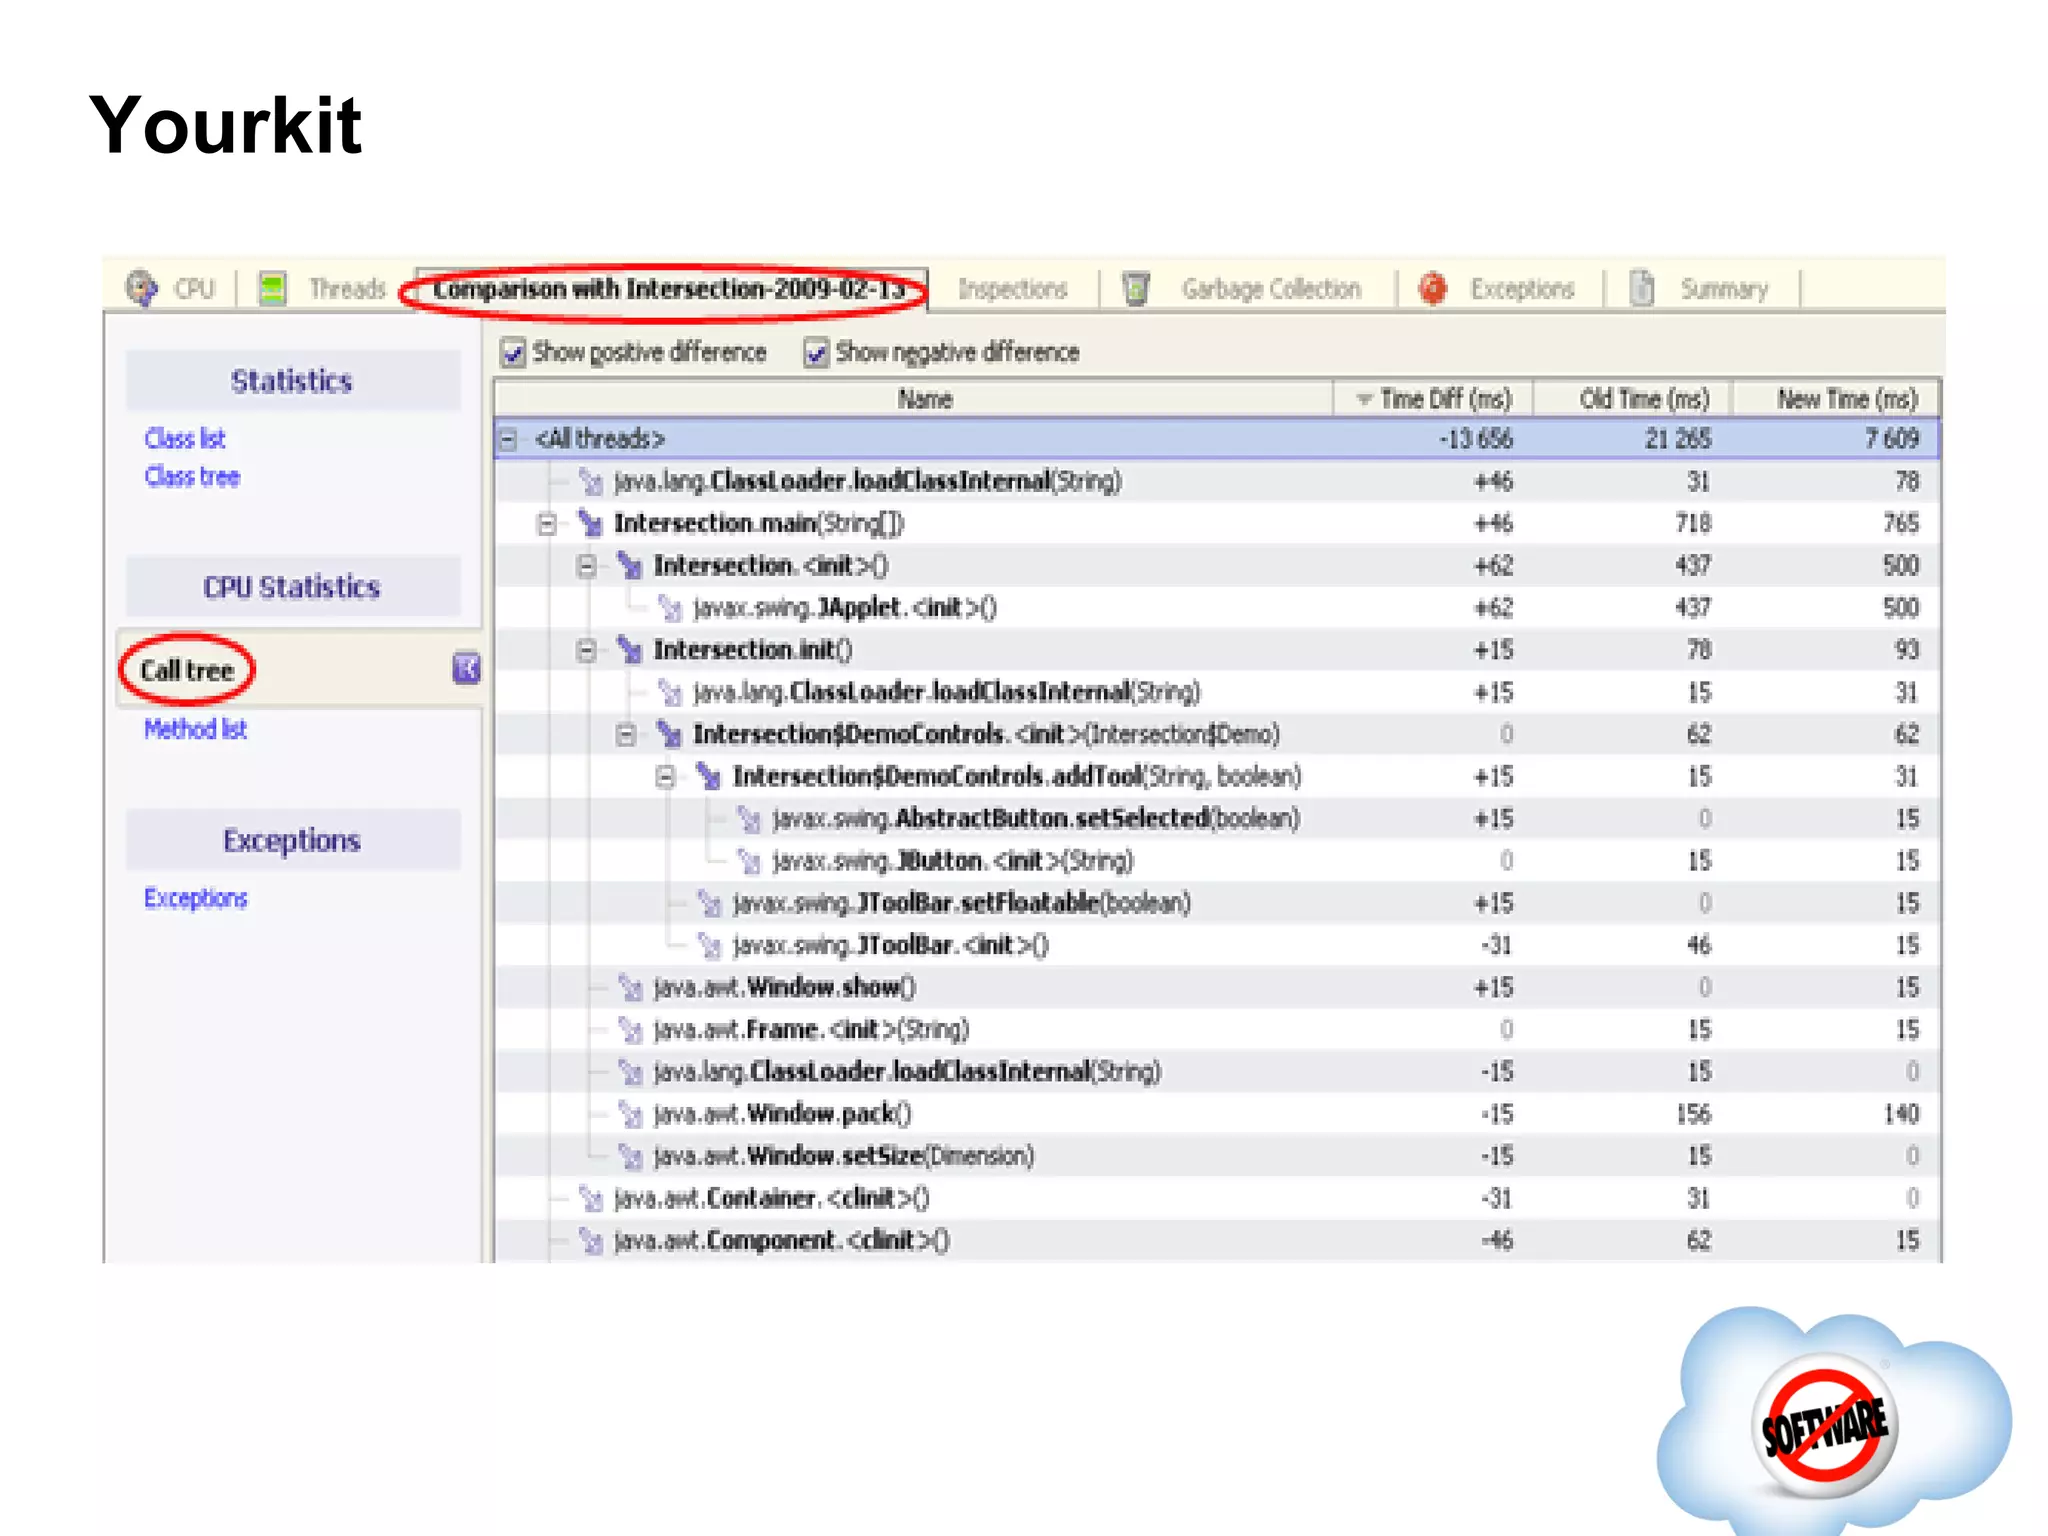
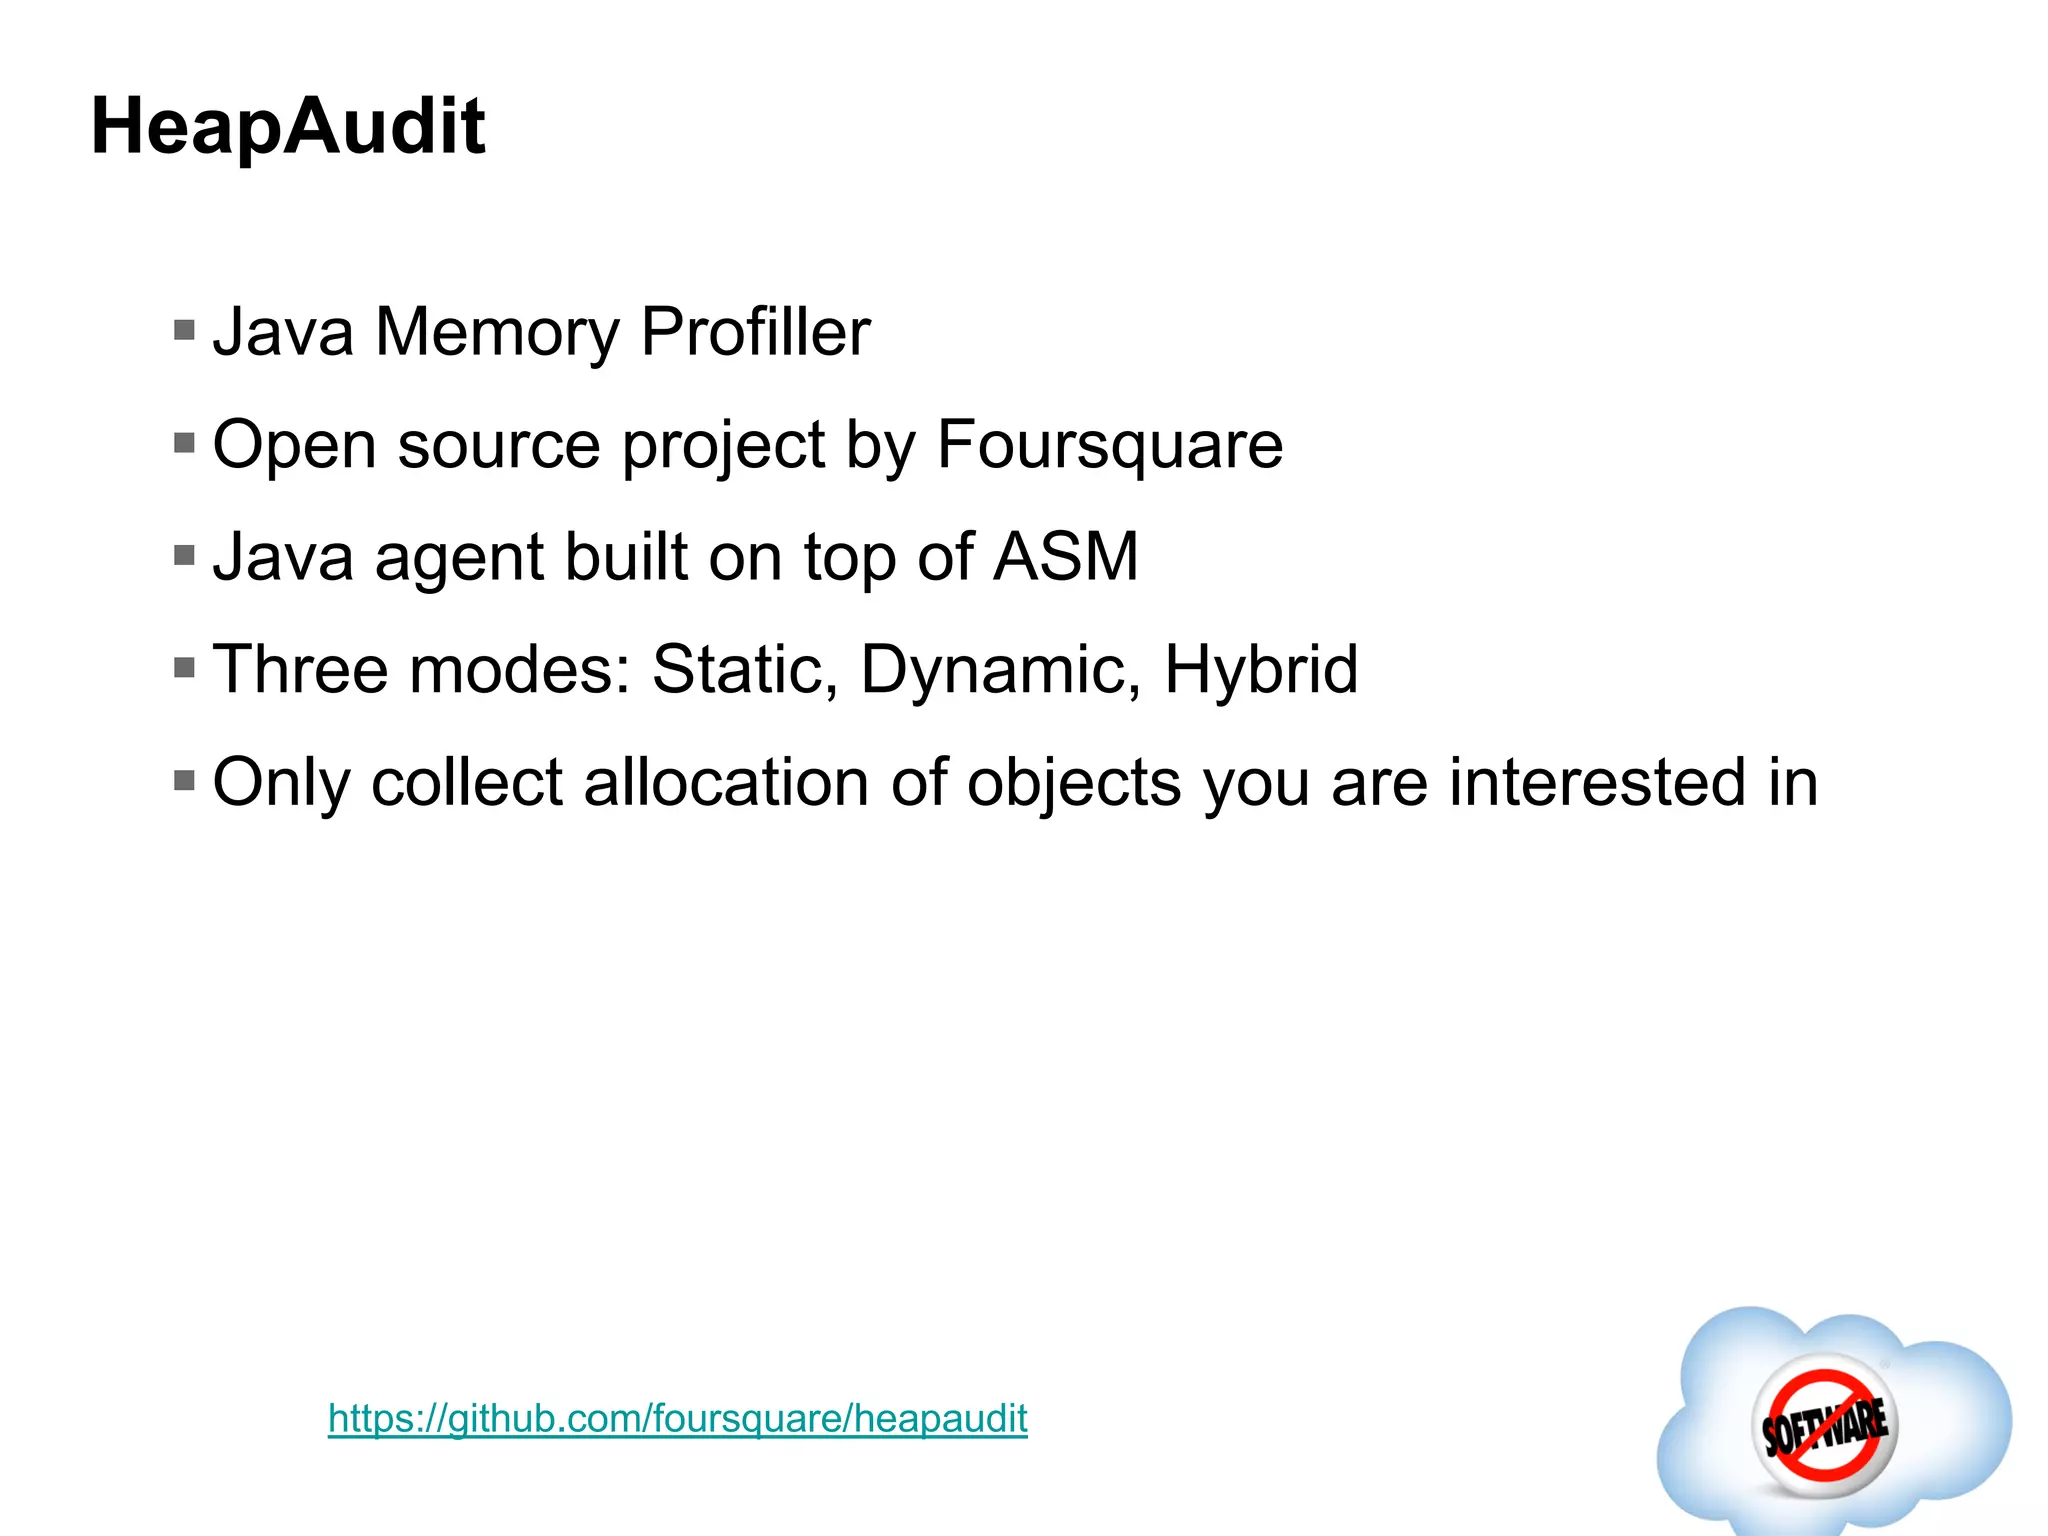
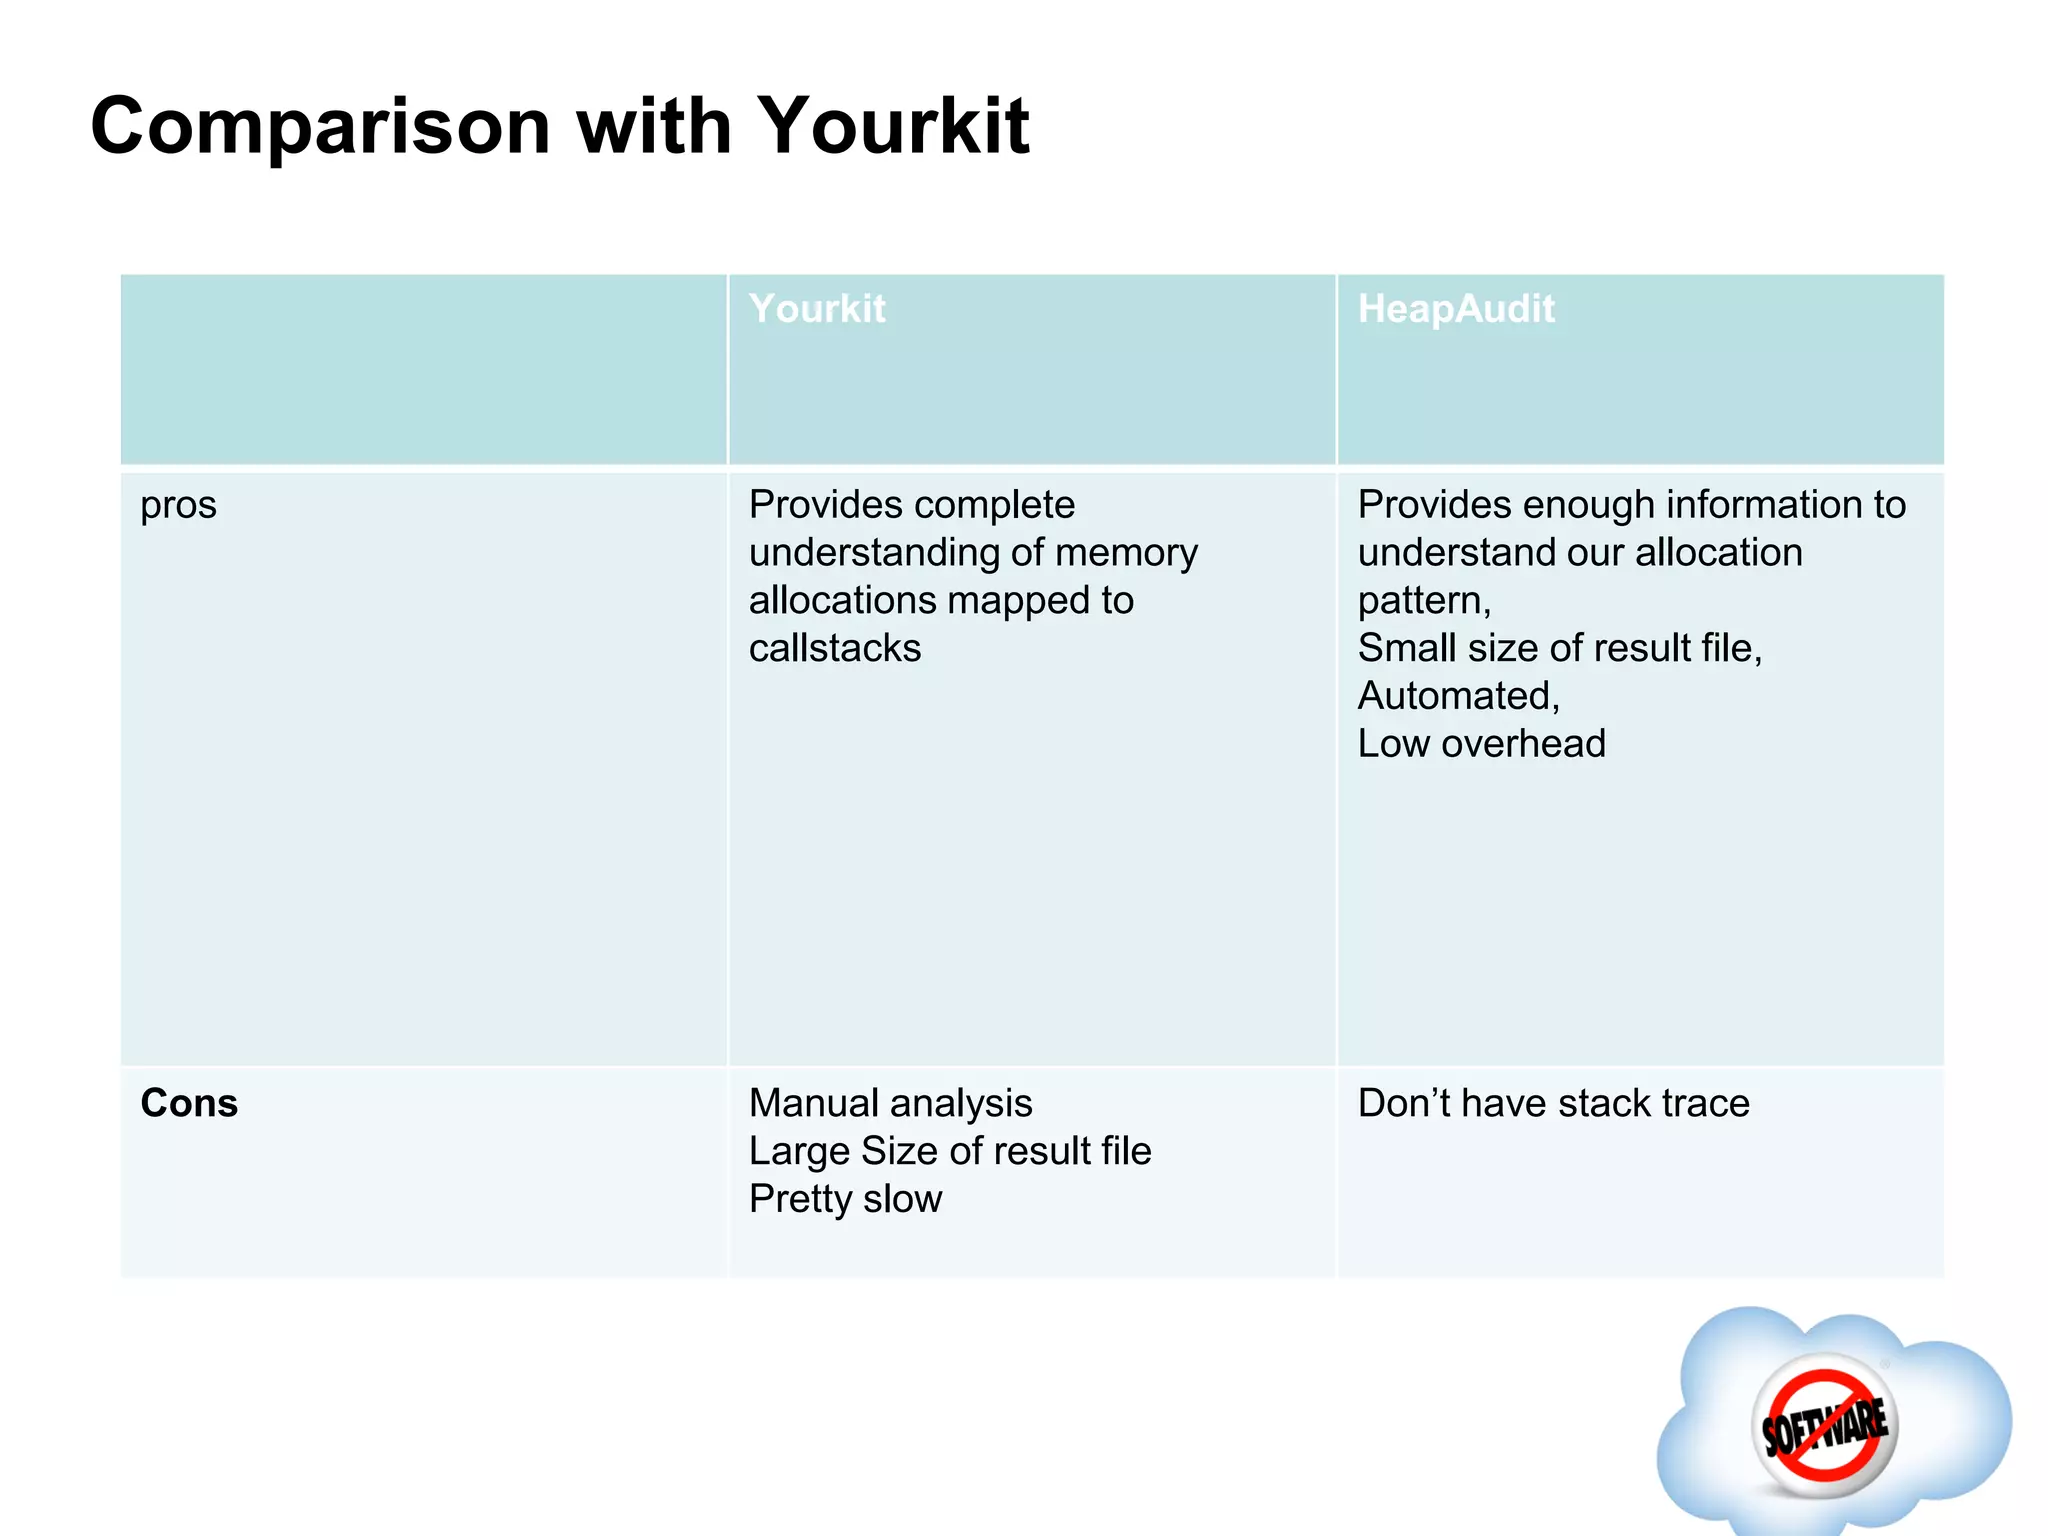
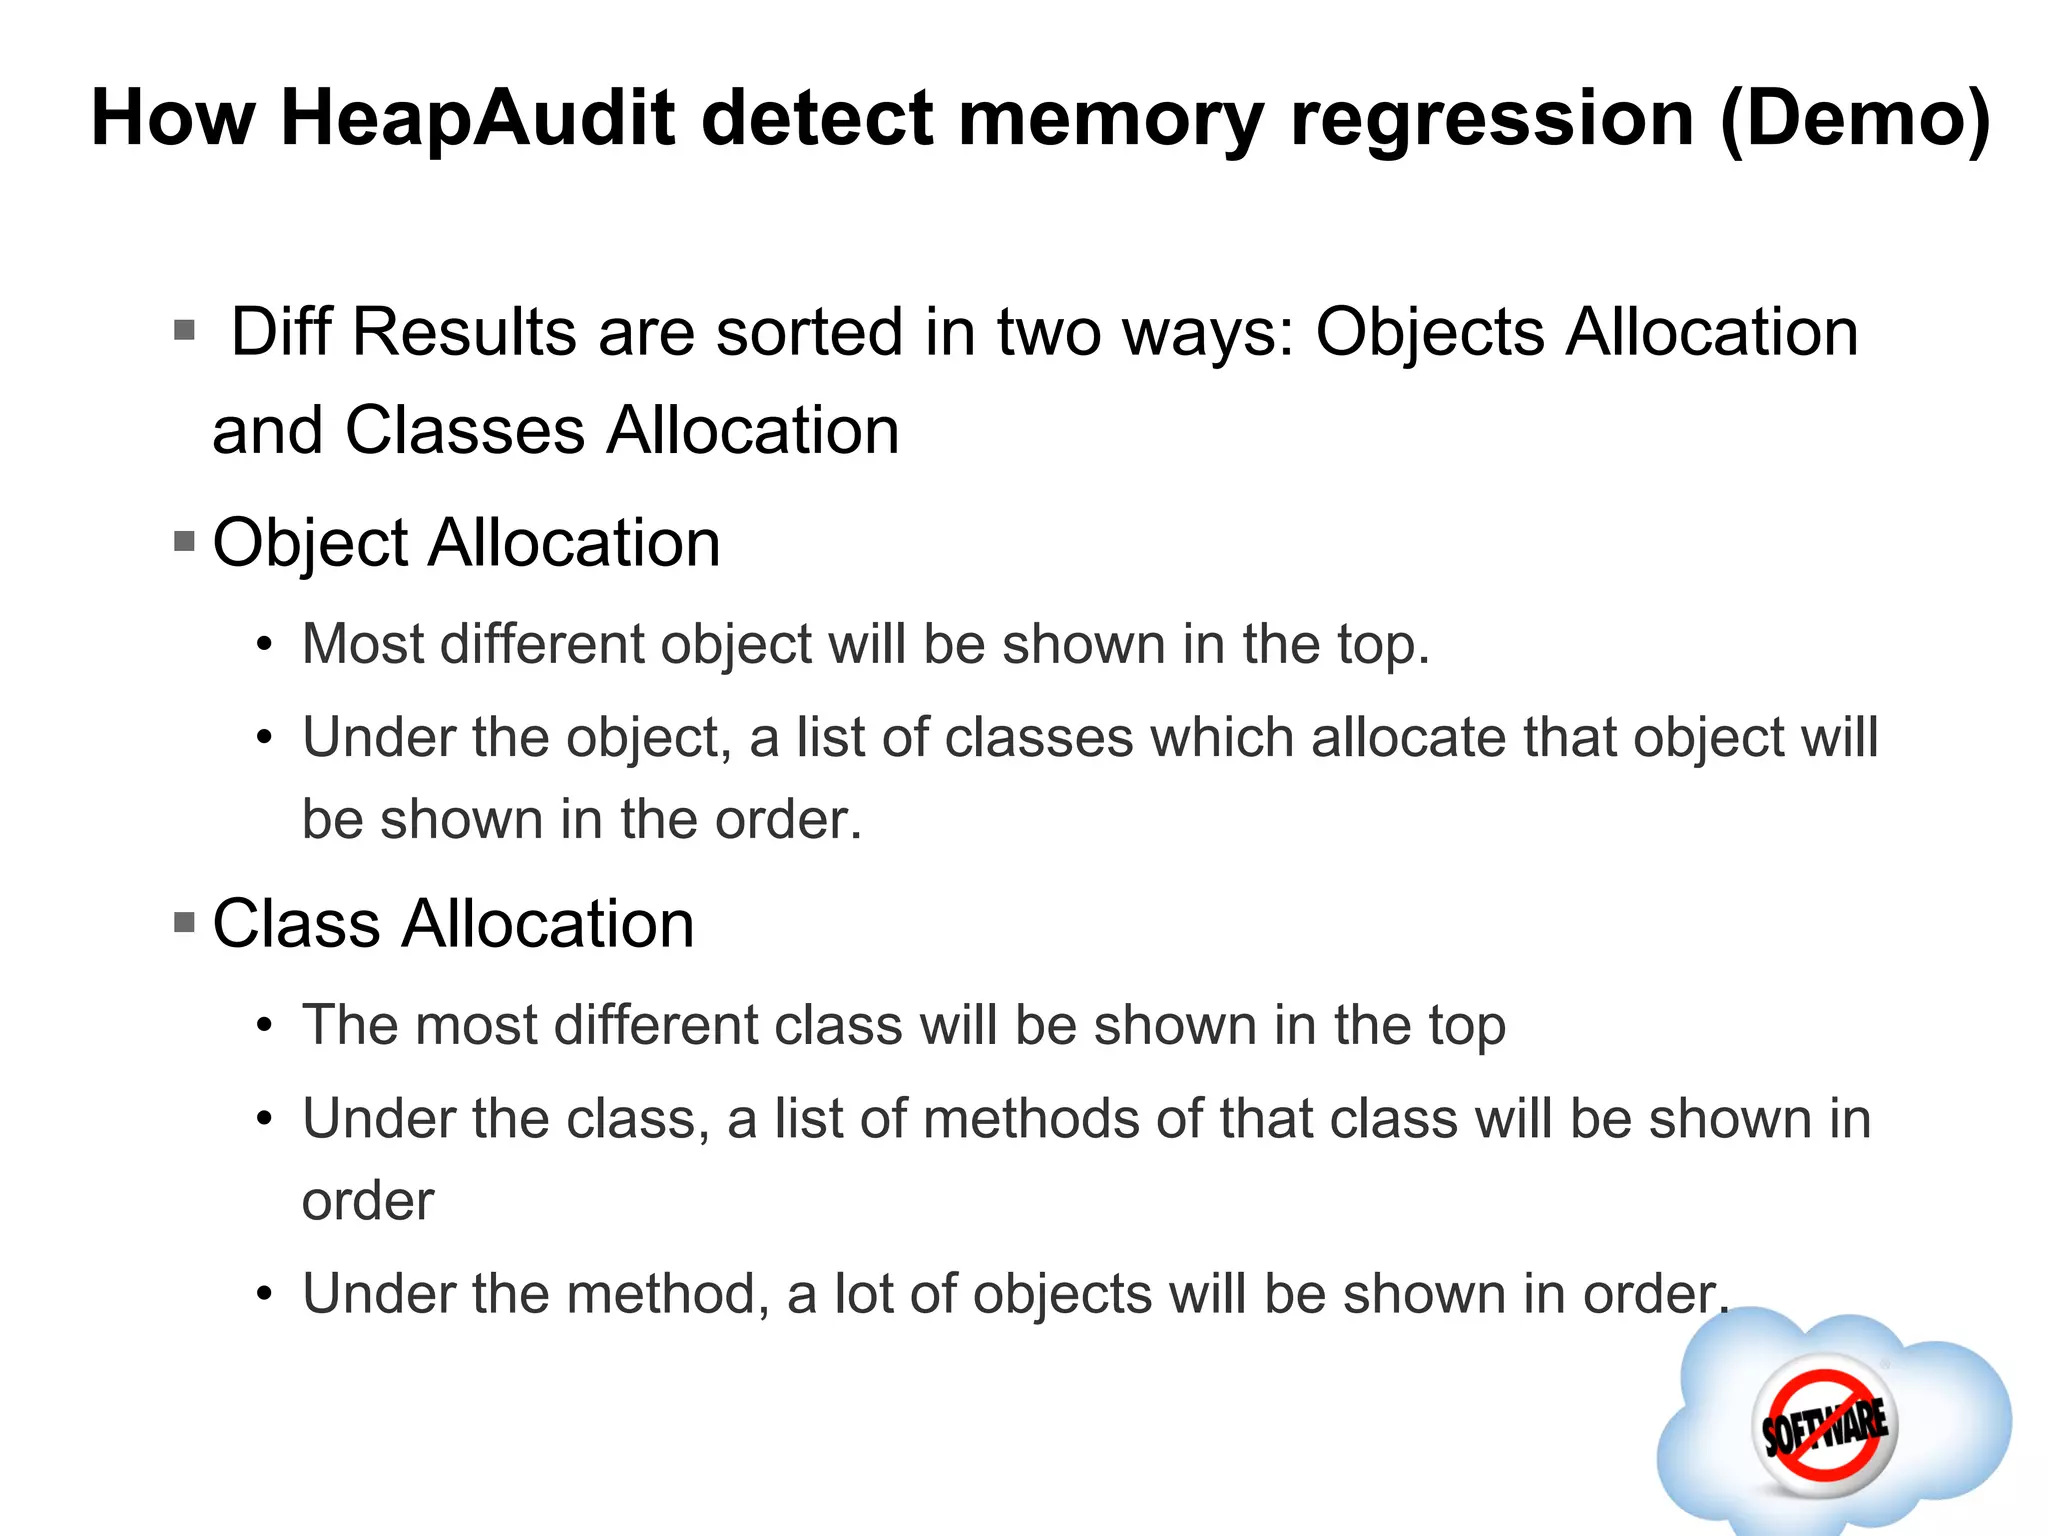


This document summarizes a presentation on performance methodology at Salesforce given at QCon Beijing 2014. It discusses: - The importance of performance for user experience, decreasing costs, and serving more customers. - Salesforce's dedicated performance team is organized by areas like UI, mobile, platforms, and infrastructure. - Key performance metrics include response time, throughput, CPU/memory utilization, and database metrics. - Performance is tested proactively via feature and regression tests, and passively via production analysis. Automated testing uses tools like JMeter and internal frameworks. Profilers like Yourkit and HeapAudit help identify causes.


![Q con shanghai2013-[ben lavender]-[long-distance relationships with robots]](https://cdn.slidesharecdn.com/ss_thumbnails/qconshanghai2013-benlavender-long-distancerelationshipswithrobots-131104024443-phpapp01-thumbnail.jpg?width=640&height=640&fit=bounds)
![Q con shanghai2013-[刘海锋]-[京东文件系统简介]](https://cdn.slidesharecdn.com/ss_thumbnails/qconshanghai2013-131104023843-phpapp01-thumbnail.jpg?width=640&height=640&fit=bounds)
![Q con shanghai2013-[韩军]-[超大型电商系统架构解密]](https://cdn.slidesharecdn.com/ss_thumbnails/qconshanghai2013-131104023713-phpapp01-thumbnail.jpg?width=640&height=640&fit=bounds)
![Q con shanghai2013-[jains krums]-[real-time-delivery-archiecture]](https://cdn.slidesharecdn.com/ss_thumbnails/qconshanghai2013-jainskrums-real-time-delivery-archiecture-131104014325-phpapp02-thumbnail.jpg?width=640&height=640&fit=bounds)
![Q con shanghai2013-[黄舒泉]-[intel it openstack practice]](https://cdn.slidesharecdn.com/ss_thumbnails/qconshanghai2013-intelitopenstackpractice-131104011958-phpapp02-thumbnail.jpg?width=640&height=640&fit=bounds)


![Coded Agents – with UiPath SDK + LangGraph [Virtual Hands-on Workshop]](https://cdn.slidesharecdn.com/ss_thumbnails/codedagentsdeck-251215155422-5497c599-thumbnail.jpg?width=640&height=640&fit=bounds)


