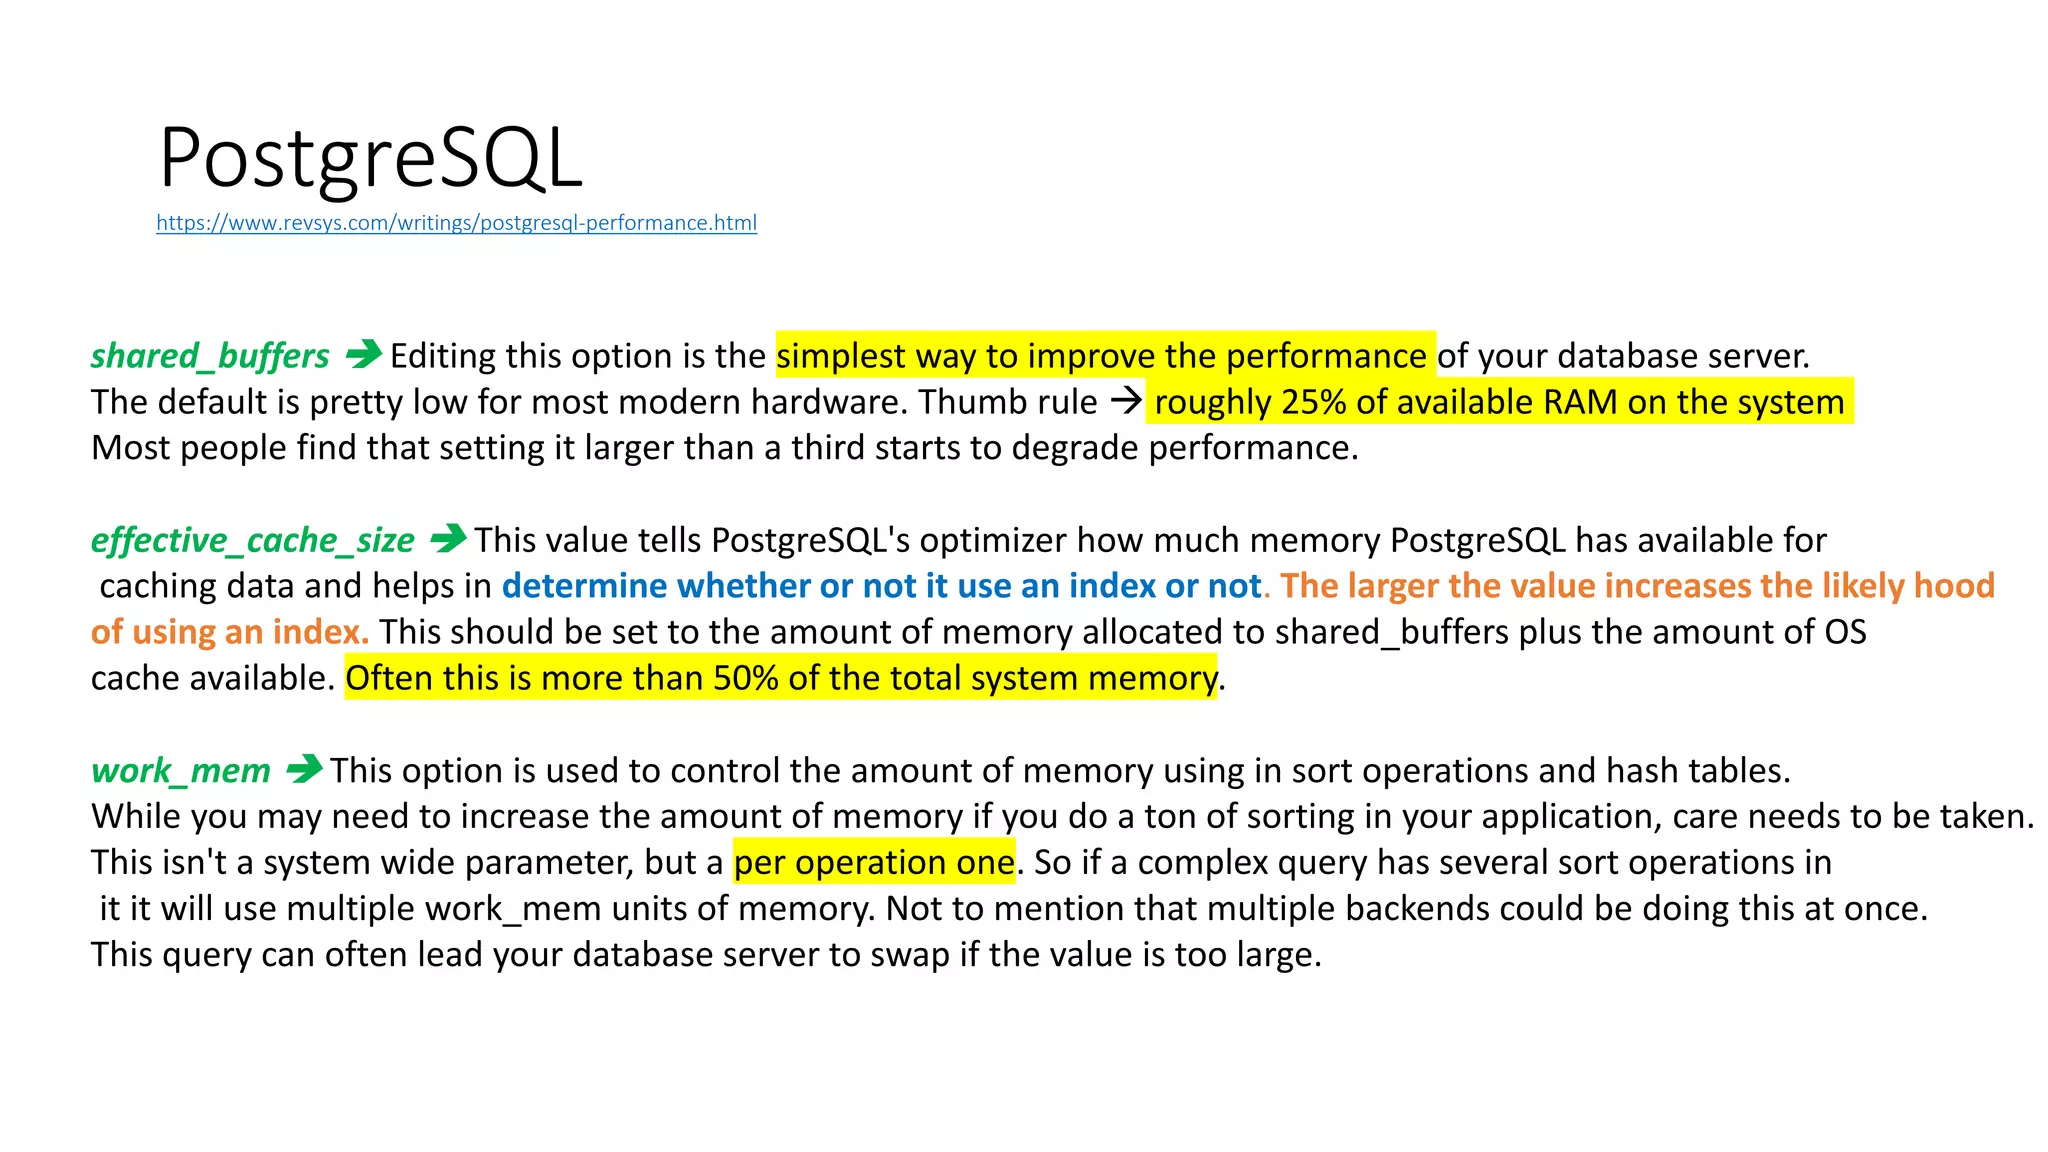
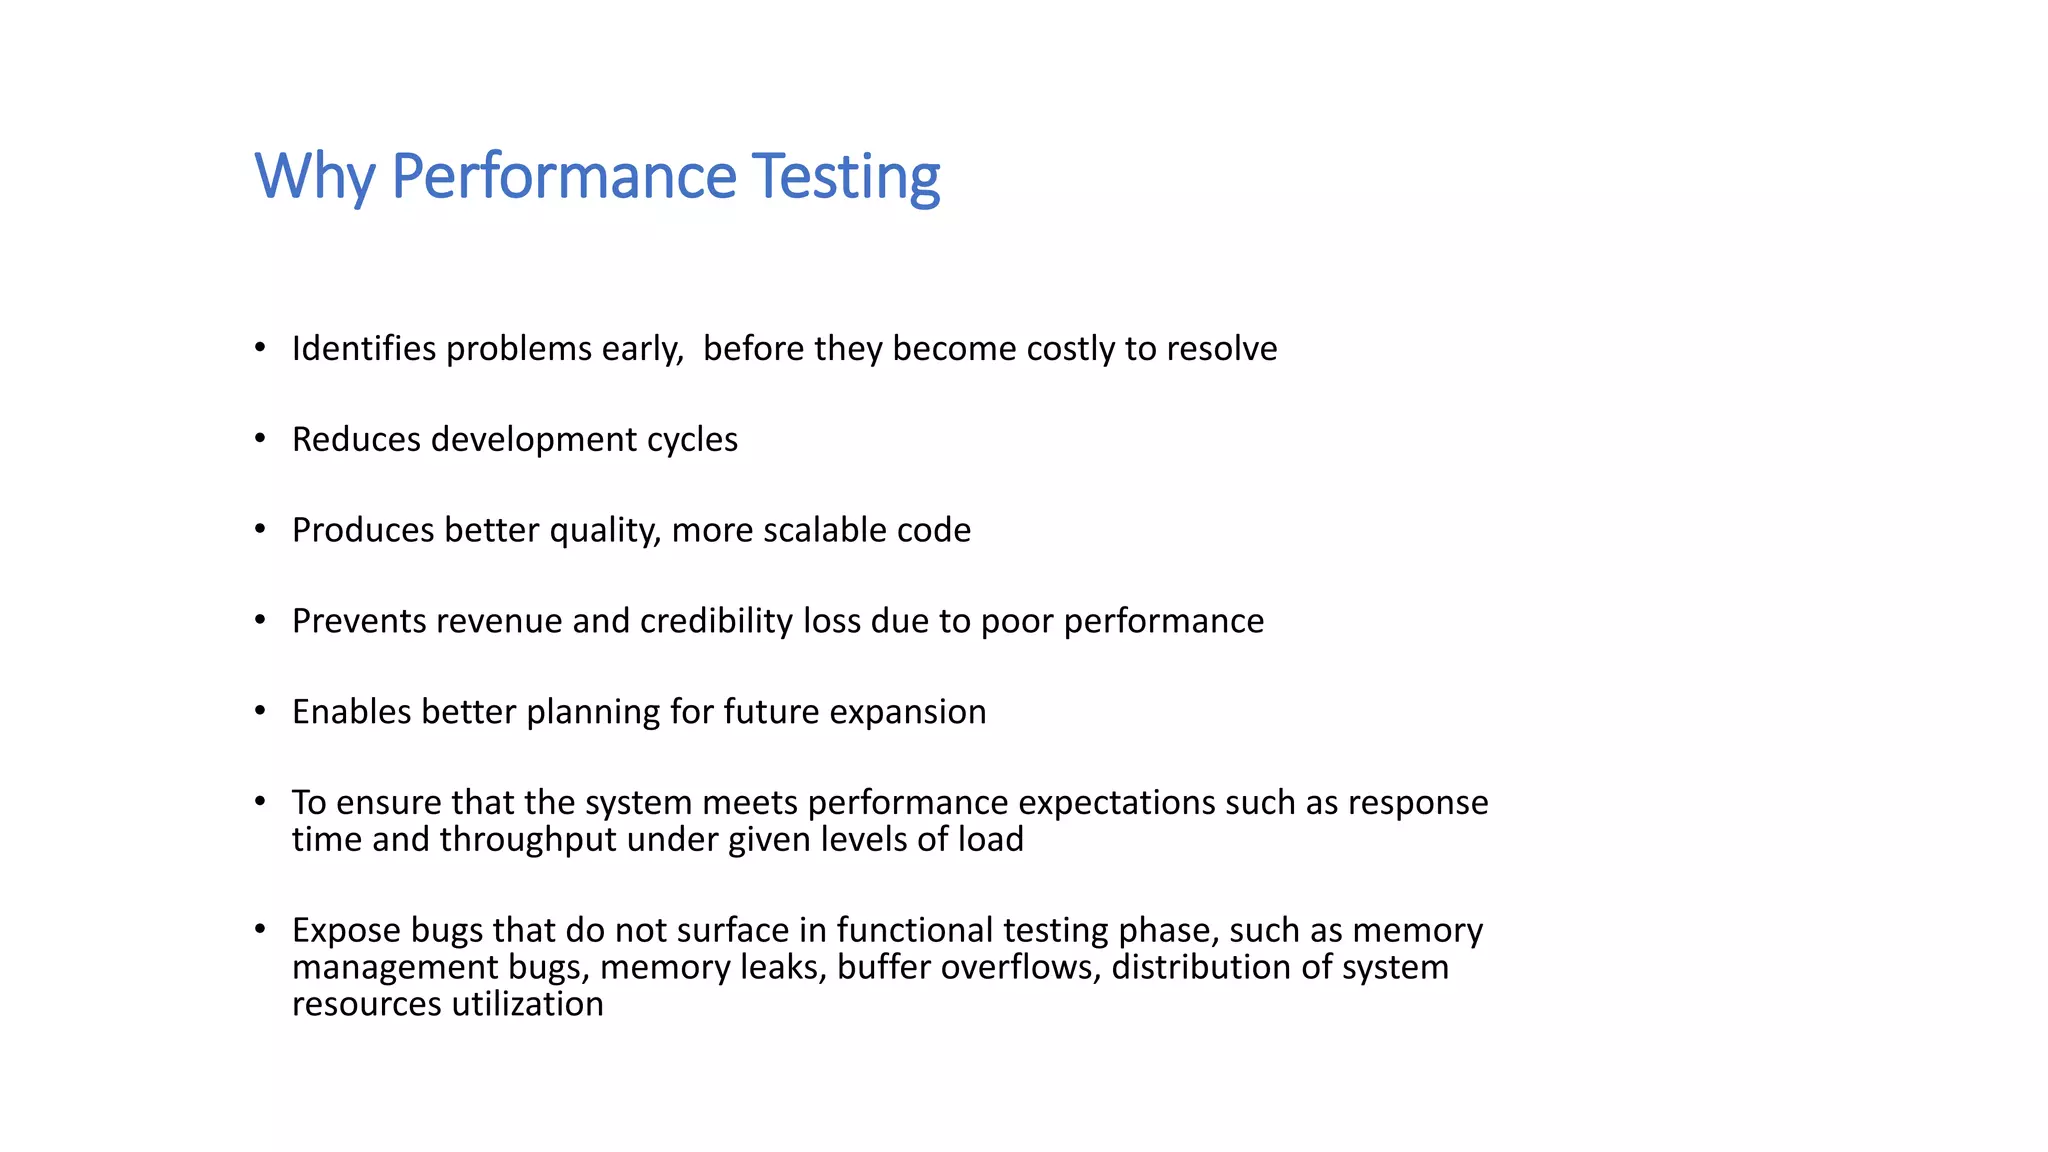
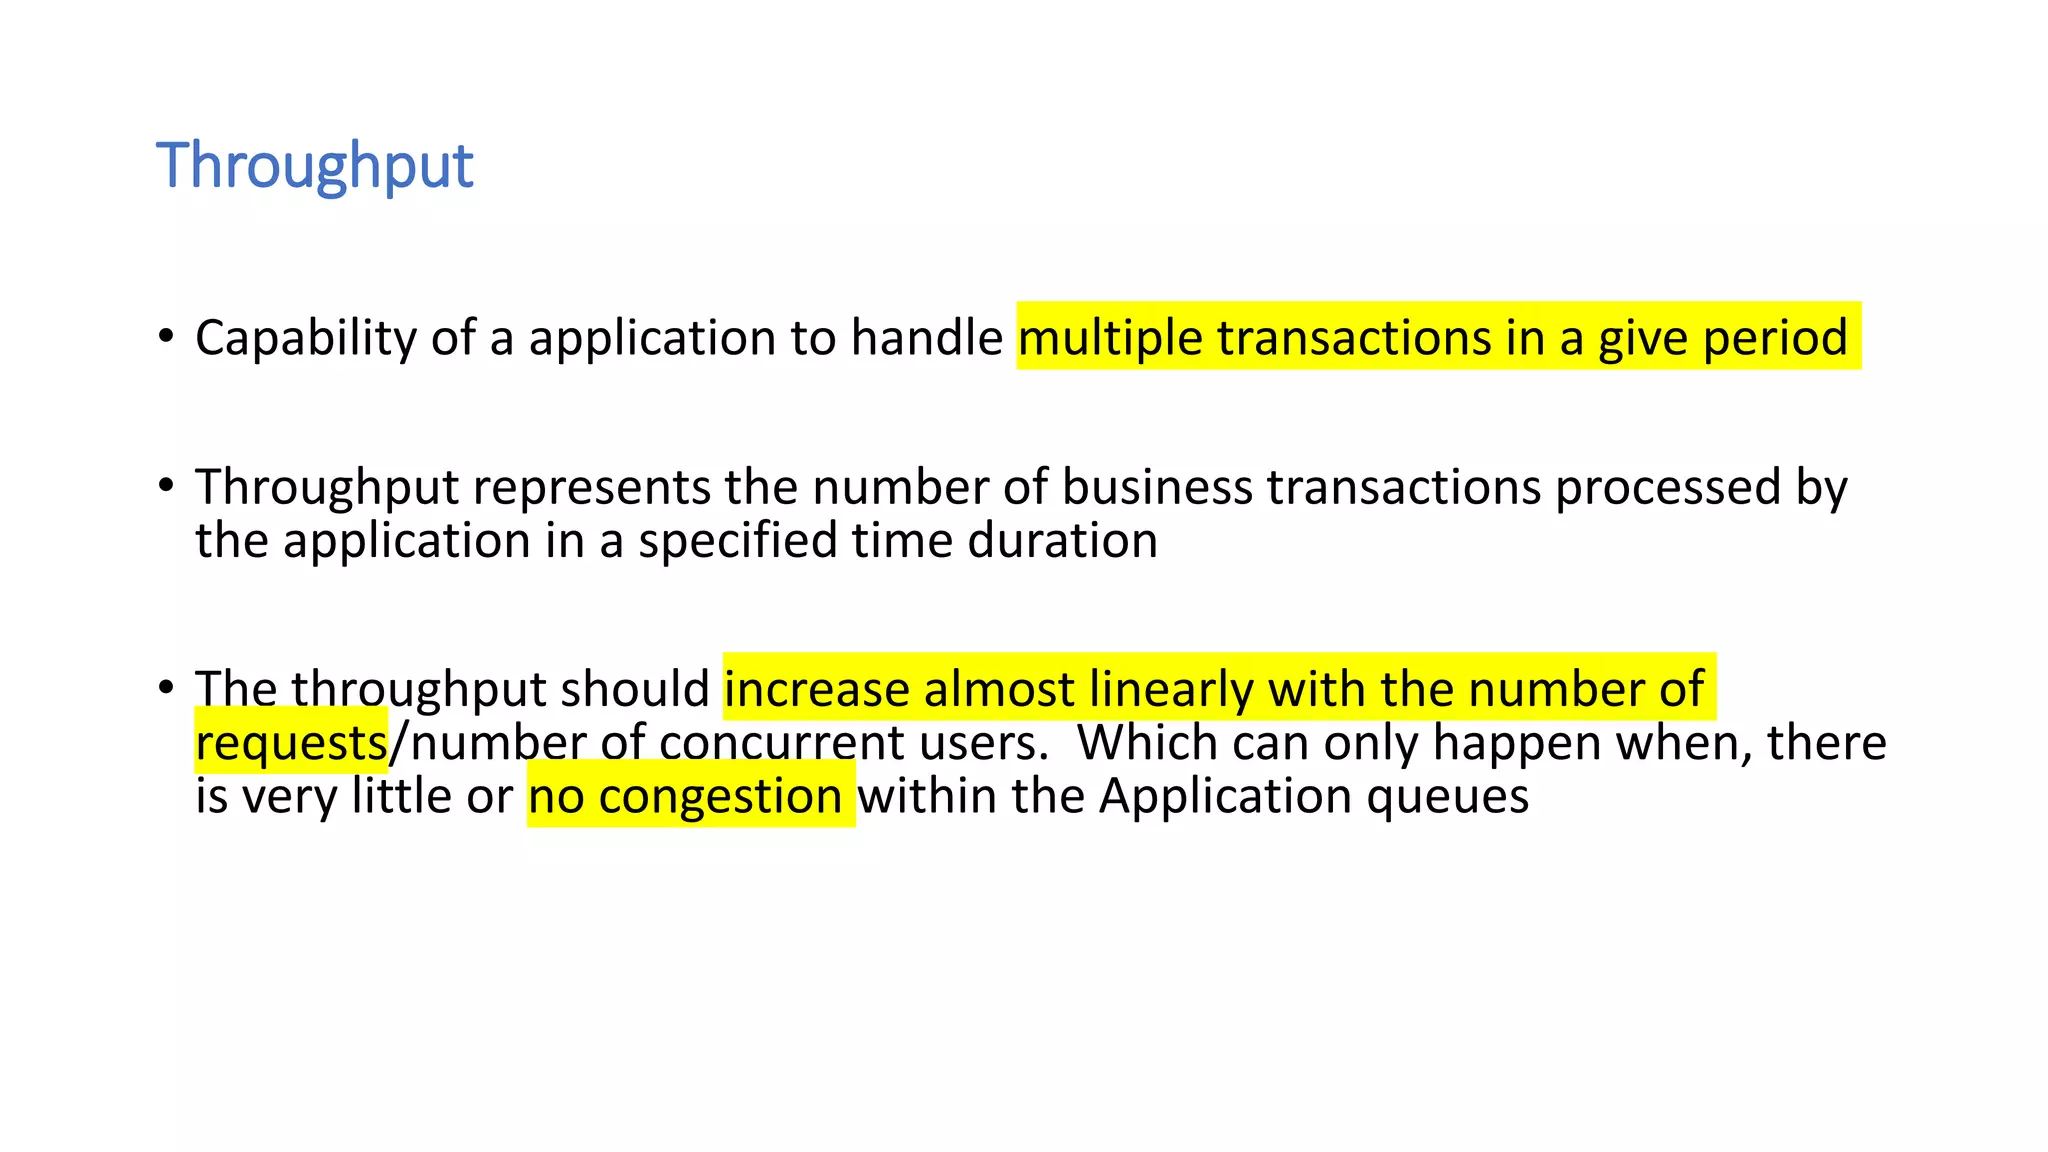
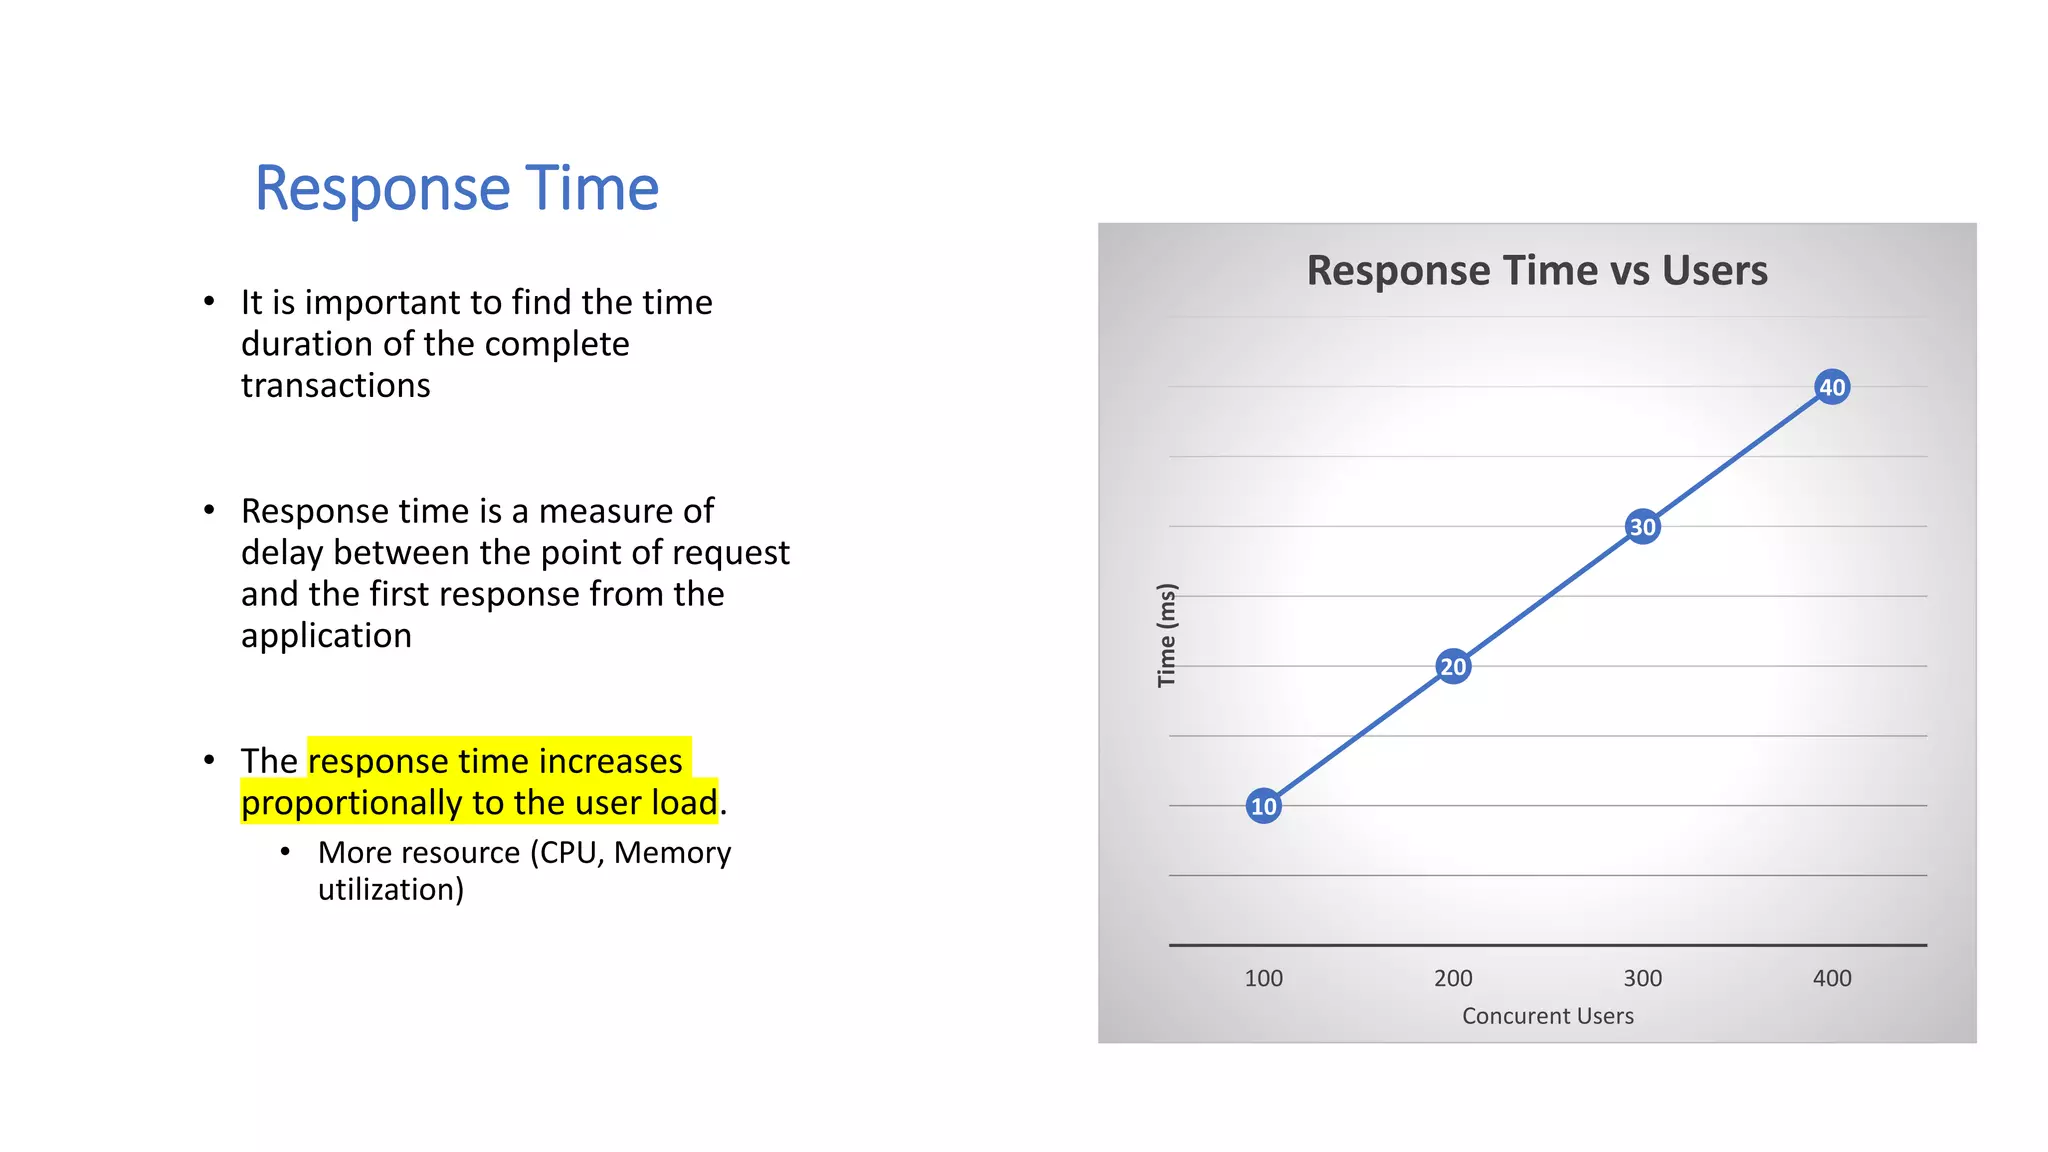
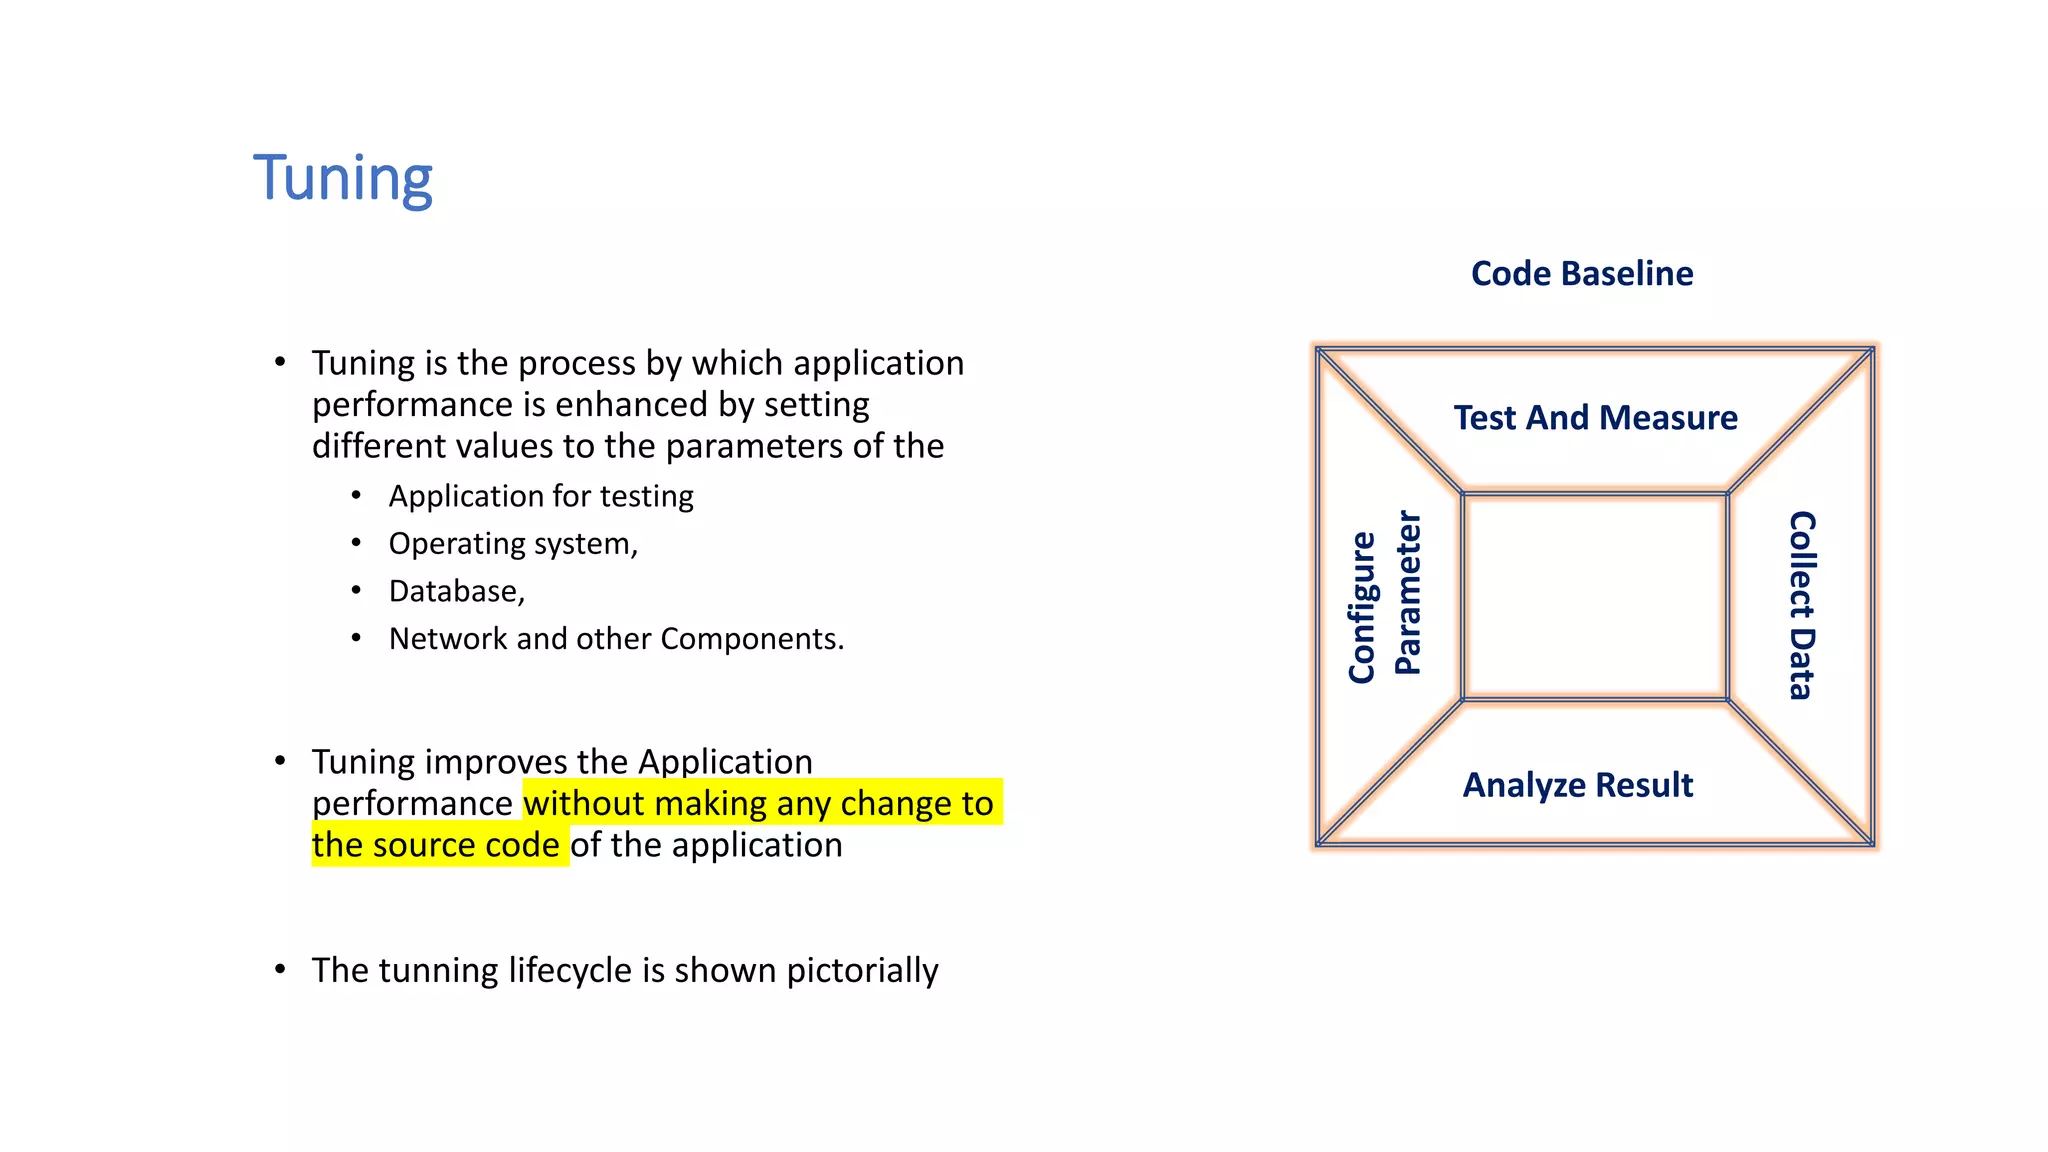
We all know that load testing is important, but it's all too common that it's left to the very end of a project and it's invariably the first thing that gets dropped when budgets and timeframes get cut. Furthermore, most of us don't know where or how to start implementing effective load tests, let alone how to analyse the results.
Lindsay Holmwood, Software Manager at Bulletproof Networks, will be talking about integrating performance testing into your application development + deploy cycle from the very beginning, using inexpensive and easy to use SaaS tools.
There will be a hands on demonstration of the Blitz load + performance testing tool, coupled with a brief dive into the Blitz API internals to retrieve and analyse advanced reporting information.
It's a very basic introduction of Load Runner for beginners, i explored it at my own, prepared slides & shared it with my colleagues.
What is Load Runner & why we need Performance testing etc.
Enjoy :)
You’ve worked hard to define, develop and execute a performance test on a new application to determine its behavior under load. You have barrels full of numbers. What’s next? The answer is definitely not to generate and send a canned report from your testing tool. Results interpretation and reporting is where a performance tester earns their stripes.
In the first half of this workshop we’ll start by looking at some results from actual projects and together puzzle out the essential message in each. This will be a highly interactive session where we will display a graph, provide a little context, and ask “what do you see here?” We will form hypotheses, draw tentative conclusions, determine what further information we need to confirm them, and identify key target graphs that give us the best insight on system performance and bottlenecks.
In the second half of this session, we’ll try to codify the analytic steps we went through in the first session, and consider a CAVIAR approach for collecting and evaluating test results: Collecting, Aggregating, Visualizing, Interpreting, Analyzing, And Reporting.
When you know the basics of Performance testing, the next question that comes to mind is how we can conduct Performance Testing. There are multiple tools available in the industry to meet the purpose. Among them, the most dominant one is Microfocus LoadRunner. This particular tool ease down the whole process of performance testing and helped to achieve the goal. In this session, you learn about LoadRunner, its fundamental components, and finally the LoadRunner usage in Performance Testing through a Demo.
Ad109 - XPages Performance and Scalabilityddrschiw
Understanding the XPages architecture is key to building performant scalable enterprise-ready Lotus Domino web applications. We'll show how to go under the hood to discover functional features that help your application perform and scale well. You'll learn about design patterns and techniques that ensure your applications are optimally tuned for your business requirements, and we'll show how to integrate existing business logic -- without increasing performance cost.
Using JMeter for Performance Testing Live Streaming ApplicationsBlazeMeter
With live video usage increasing to watch sporting events, popular TV shows, etc., load and performance testing live streaming applications has become a must to ensure they can withstand heavy traffic.
Our Sep 6, 2017 webinar looked at using Apache JMeter™ for testing streaming applications. Until now, JMeter supported the load testing of HTTP Live Streaming (HLS) applications, the leading protocol, with a few different elements. But now, a new HLS plugin for JMeter makes the process much simpler and efficient than before.
An overview of the HLS protocol including its key components
An introduction to the new JMeter HLS plugin
How to learn more and get involved with this open-source project
This session is for you if you want to learn tips and techniques that are used to optimize database development with special emphasis on SQL Server 2005. If you write lot of stored procedures and want to learn the tools of a DBA, this is the session for you. If you are new to SQL Server development environment, you will learn how the various constructs compare to each other and better performance can be produced every time with a brief introduction to understanding Execution Plans.
Eric Proegler Oredev Performance Testing in New ContextsEric Proegler
Virtualization, Cloud Deployments, and Cloud-Based Tools have challenged and changed performance testing practices. Today’s performance tester can summons tens of thousands of virtual users from the cloud in a few minutes at a cost far lower than the expensive on-premise installations of yesteryear.
Meanwhile, systems under test have changed more. Updated software stacks have increased the complexity of scripting and performance measurement, but the biggest changes are in the nature and quantities of resources powering the systems. Interpreting resource usage when resources are shared on a private virtualization platform is exceedingly difficult. Understanding resources when they live in a large public cloud is impossible.
Eric Proegler Early Performance Testing from CAST2014Eric Proegler
Development and deployment contexts have changed considerably over the last decade. The discipline of performance testing has had difficulty keeping up with modern testing principles and software development and deployment processes.
Most people still see performance testing as a single experiment, run against a completely assembled, code-frozen, production-resourced system, with the "accuracy" of simulation and environment considered critical to the value of the data the test provides.
But what can we do to provide actionable and timely information about performance and reliability when the software is not complete, when the system is not yet assembled, or when the software will be deployed in more than one environment?
Eric deconstructs “realism” in performance simulation, talks about performance testing more cheaply to test more often, and suggest strategies and techniques to get there. He will share findings from WOPR22, where performance testers from around the world came together in May 2014 to discuss this theme in a peer workshop.
Production profiling what, why and how (JBCN Edition)RichardWarburton
Production Profiling: What, Why and How You want to understand what an application is doing in production, but this information is often invisible. Profilers tell you what code your application is running but few developers profile and mostly on their development environments. Production profiling is now a practical reality that can help avoid performance problems
Presentation delivered by Matt Done, Head Of Platform Development at expanz Pty. Ltd. during DDD Sydney event on 2 July 2011.
Matt demonstrates what it takes to setup a highly sophisticated load test, using the Azure environment and how to use the results to optimise a fully blown application development platform and application server running on Azure.
Recording of this presentation can be found at www.youtube.com/expanzTV
Adding Value in the Cloud with Performance TestRodolfo Kohn
System quality attributes such performance, scalability, and availability are among the main concerns for cloud application developers and product managers. There are many examples of notable system failures that show how a company business can be affected during key events like a Cyber Monday. However, many difficulties come up when a team intends to consciously manage these type of quality attributes during development and operations. It is possible to group these difficulties in two main aspects: human aspects and technical aspects. During this presentation, I will share main technical difficulties we had to deal with in the last seven years working with different cloud services as well as key technical performance, scalability, and availability issues we were able to find and solve. It is about cases that are relevant through different products, technologies, and teams.
WebSphere Technical University: Introduction to the Java Diagnostic ToolsChris Bailey
IBM provides a number of free tools to assist in monitoring and diagnosing issues when running
any Java application - from Hello World to IBM or third-party, middleware-based applications. This
session introduces attendees to those tools, highlights how they have been extended with IBM
middleware product knowledge, how they have been integrated into IBM’s development tools,
and how to use them to investigate and resolve real-world problem scenarios
Presented at the WebSphere Technical University 2014, Dusseldorf
MongoDB 3.2 introduces a host of new features and benefits, including encryption at rest, document validation, MongoDB Compass, numerous improvements to queries and the aggregation framework, and more. To take advantage of these features, your team needs an upgrade plan.
In this session, we’ll walk you through how to build an upgrade plan. We’ll show you how to validate your existing deployment, build a test environment with a representative workload, and detail how to carry out the upgrade. By the end, you should be prepared to start developing an upgrade plan for your deployment.
Continuous Profiling in Production: What, Why and HowSadiq Jaffer
Everyone wants to understand what their application is really doing in production, but this information is normally invisible to developers. Profilers tell you what code your application is running but few developers profile and mostly on their development environments. Thankfully production profiling is now a practical reality that can help you solve and avoid performance problems.
Profiling in development can be problematic because it’s rare that you have a realistic workload or performance test for your system. Even if you’ve got accurate performance tests maintaining these and validating that they represent production systems is hugely time consuming and hard. Not only that but often the hardware and operating system that you run in production are different from your development environment.
This pragmatic talk will help you understand the ins and outs of profiling in a production system. You’ll learn about different techniques and approaches that help you understand what’s really happening with your system. This helps you to solve new performance problems, regressions and undertake capacity planning exercises.
Find out how profiling in production can uncover performance bottlenecks, aid scalability and reduce your costs.
Field Employee Tracking System| MiTrack App| Best Employee Tracking Solution|...informapgpstrackings
Keep tabs on your field staff effortlessly with Informap Technology Centre LLC. Real-time tracking, task assignment, and smart features for efficient management. Request a live demo today!
For more details, visit us : https://informapuae.com/field-staff-tracking/
In software engineering, the right architecture is essential for robust, scalable platforms. Wix has undergone a pivotal shift from event sourcing to a CRUD-based model for its microservices. This talk will chart the course of this pivotal journey.
Event sourcing, which records state changes as immutable events, provided robust auditing and "time travel" debugging for Wix Stores' microservices. Despite its benefits, the complexity it introduced in state management slowed development. Wix responded by adopting a simpler, unified CRUD model. This talk will explore the challenges of event sourcing and the advantages of Wix's new "CRUD on steroids" approach, which streamlines API integration and domain event management while preserving data integrity and system resilience.
Participants will gain valuable insights into Wix's strategies for ensuring atomicity in database updates and event production, as well as caching, materialization, and performance optimization techniques within a distributed system.
Join us to discover how Wix has mastered the art of balancing simplicity and extensibility, and learn how the re-adoption of the modest CRUD has turbocharged their development velocity, resilience, and scalability in a high-growth environment.
Providing Globus Services to Users of JASMIN for Environmental Data AnalysisGlobus
JASMIN is the UK’s high-performance data analysis platform for environmental science, operated by STFC on behalf of the UK Natural Environment Research Council (NERC). In addition to its role in hosting the CEDA Archive (NERC’s long-term repository for climate, atmospheric science & Earth observation data in the UK), JASMIN provides a collaborative platform to a community of around 2,000 scientists in the UK and beyond, providing nearly 400 environmental science projects with working space, compute resources and tools to facilitate their work. High-performance data transfer into and out of JASMIN has always been a key feature, with many scientists bringing model outputs from supercomputers elsewhere in the UK, to analyse against observational or other model data in the CEDA Archive. A growing number of JASMIN users are now realising the benefits of using the Globus service to provide reliable and efficient data movement and other tasks in this and other contexts. Further use cases involve long-distance (intercontinental) transfers to and from JASMIN, and collecting results from a mobile atmospheric radar system, pushing data to JASMIN via a lightweight Globus deployment. We provide details of how Globus fits into our current infrastructure, our experience of the recent migration to GCSv5.4, and of our interest in developing use of the wider ecosystem of Globus services for the benefit of our user community.
Enhancing Project Management Efficiency_ Leveraging AI Tools like ChatGPT.pdfJay Das
With the advent of artificial intelligence or AI tools, project management processes are undergoing a transformative shift. By using tools like ChatGPT, and Bard organizations can empower their leaders and managers to plan, execute, and monitor projects more effectively.
Into the Box Keynote Day 2: Unveiling amazing updates and announcements for modern CFML developers! Get ready for exciting releases and updates on Ortus tools and products. Stay tuned for cutting-edge innovations designed to boost your productivity.
Prosigns: Transforming Business with Tailored Technology SolutionsProsigns
Unlocking Business Potential: Tailored Technology Solutions by Prosigns
Discover how Prosigns, a leading technology solutions provider, partners with businesses to drive innovation and success. Our presentation showcases our comprehensive range of services, including custom software development, web and mobile app development, AI & ML solutions, blockchain integration, DevOps services, and Microsoft Dynamics 365 support.
Custom Software Development: Prosigns specializes in creating bespoke software solutions that cater to your unique business needs. Our team of experts works closely with you to understand your requirements and deliver tailor-made software that enhances efficiency and drives growth.
Web and Mobile App Development: From responsive websites to intuitive mobile applications, Prosigns develops cutting-edge solutions that engage users and deliver seamless experiences across devices.
AI & ML Solutions: Harnessing the power of Artificial Intelligence and Machine Learning, Prosigns provides smart solutions that automate processes, provide valuable insights, and drive informed decision-making.
Blockchain Integration: Prosigns offers comprehensive blockchain solutions, including development, integration, and consulting services, enabling businesses to leverage blockchain technology for enhanced security, transparency, and efficiency.
DevOps Services: Prosigns' DevOps services streamline development and operations processes, ensuring faster and more reliable software delivery through automation and continuous integration.
Microsoft Dynamics 365 Support: Prosigns provides comprehensive support and maintenance services for Microsoft Dynamics 365, ensuring your system is always up-to-date, secure, and running smoothly.
Learn how our collaborative approach and dedication to excellence help businesses achieve their goals and stay ahead in today's digital landscape. From concept to deployment, Prosigns is your trusted partner for transforming ideas into reality and unlocking the full potential of your business.
Join us on a journey of innovation and growth. Let's partner for success with Prosigns.
Climate Science Flows: Enabling Petabyte-Scale Climate Analysis with the Eart...Globus
The Earth System Grid Federation (ESGF) is a global network of data servers that archives and distributes the planet’s largest collection of Earth system model output for thousands of climate and environmental scientists worldwide. Many of these petabyte-scale data archives are located in proximity to large high-performance computing (HPC) or cloud computing resources, but the primary workflow for data users consists of transferring data, and applying computations on a different system. As a part of the ESGF 2.0 US project (funded by the United States Department of Energy Office of Science), we developed pre-defined data workflows, which can be run on-demand, capable of applying many data reduction and data analysis to the large ESGF data archives, transferring only the resultant analysis (ex. visualizations, smaller data files). In this talk, we will showcase a few of these workflows, highlighting how Globus Flows can be used for petabyte-scale climate analysis.
Custom Healthcare Software for Managing Chronic Conditions and Remote Patient...Mind IT Systems
Healthcare providers often struggle with the complexities of chronic conditions and remote patient monitoring, as each patient requires personalized care and ongoing monitoring. Off-the-shelf solutions may not meet these diverse needs, leading to inefficiencies and gaps in care. It’s here, custom healthcare software offers a tailored solution, ensuring improved care and effectiveness.
Listen to the keynote address and hear about the latest developments from Rachana Ananthakrishnan and Ian Foster who review the updates to the Globus Platform and Service, and the relevance of Globus to the scientific community as an automation platform to accelerate scientific discovery.
Software Engineering, Software Consulting, Tech Lead.
Spring Boot, Spring Cloud, Spring Core, Spring JDBC, Spring Security,
Spring Transaction, Spring MVC,
Log4j, REST/SOAP WEB-SERVICES.
In 2015, I used to write extensions for Joomla, WordPress, phpBB3, etc and I ...Juraj Vysvader
In 2015, I used to write extensions for Joomla, WordPress, phpBB3, etc and I didn't get rich from it but it did have 63K downloads (powered possible tens of thousands of websites).
Globus Compute wth IRI Workflows - GlobusWorld 2024Globus
As part of the DOE Integrated Research Infrastructure (IRI) program, NERSC at Lawrence Berkeley National Lab and ALCF at Argonne National Lab are working closely with General Atomics on accelerating the computing requirements of the DIII-D experiment. As part of the work the team is investigating ways to speedup the time to solution for many different parts of the DIII-D workflow including how they run jobs on HPC systems. One of these routes is looking at Globus Compute as a way to replace the current method for managing tasks and we describe a brief proof of concept showing how Globus Compute could help to schedule jobs and be a tool to connect compute at different facilities.
Understanding Globus Data Transfers with NetSageGlobus
NetSage is an open privacy-aware network measurement, analysis, and visualization service designed to help end-users visualize and reason about large data transfers. NetSage traditionally has used a combination of passive measurements, including SNMP and flow data, as well as active measurements, mainly perfSONAR, to provide longitudinal network performance data visualization. It has been deployed by dozens of networks world wide, and is supported domestically by the Engagement and Performance Operations Center (EPOC), NSF #2328479. We have recently expanded the NetSage data sources to include logs for Globus data transfers, following the same privacy-preserving approach as for Flow data. Using the logs for the Texas Advanced Computing Center (TACC) as an example, this talk will walk through several different example use cases that NetSage can answer, including: Who is using Globus to share data with my institution, and what kind of performance are they able to achieve? How many transfers has Globus supported for us? Which sites are we sharing the most data with, and how is that changing over time? How is my site using Globus to move data internally, and what kind of performance do we see for those transfers? What percentage of data transfers at my institution used Globus, and how did the overall data transfer performance compare to the Globus users?
Large Language Models and the End of ProgrammingMatt Welsh
Talk by Matt Welsh at Craft Conference 2024 on the impact that Large Language Models will have on the future of software development. In this talk, I discuss the ways in which LLMs will impact the software industry, from replacing human software developers with AI, to replacing conventional software with models that perform reasoning, computation, and problem-solving.
SOCRadar Research Team: Latest Activities of IntelBrokerSOCRadar
The European Union Agency for Law Enforcement Cooperation (Europol) has suffered an alleged data breach after a notorious threat actor claimed to have exfiltrated data from its systems. Infamous data leaker IntelBroker posted on the even more infamous BreachForums hacking forum, saying that Europol suffered a data breach this month.
The alleged breach affected Europol agencies CCSE, EC3, Europol Platform for Experts, Law Enforcement Forum, and SIRIUS. Infiltration of these entities can disrupt ongoing investigations and compromise sensitive intelligence shared among international law enforcement agencies.
However, this is neither the first nor the last activity of IntekBroker. We have compiled for you what happened in the last few days. To track such hacker activities on dark web sources like hacker forums, private Telegram channels, and other hidden platforms where cyber threats often originate, you can check SOCRadar’s Dark Web News.
Stay Informed on Threat Actors’ Activity on the Dark Web with SOCRadar!
Check out the webinar slides to learn more about how XfilesPro transforms Salesforce document management by leveraging its world-class applications. For more details, please connect with sales@xfilespro.com
If you want to watch the on-demand webinar, please click here: https://www.xfilespro.com/webinars/salesforce-document-management-2-0-smarter-faster-better/
Developing Distributed High-performance Computing Capabilities of an Open Sci...Globus
COVID-19 had an unprecedented impact on scientific collaboration. The pandemic and its broad response from the scientific community has forged new relationships among public health practitioners, mathematical modelers, and scientific computing specialists, while revealing critical gaps in exploiting advanced computing systems to support urgent decision making. Informed by our team’s work in applying high-performance computing in support of public health decision makers during the COVID-19 pandemic, we present how Globus technologies are enabling the development of an open science platform for robust epidemic analysis, with the goal of collaborative, secure, distributed, on-demand, and fast time-to-solution analyses to support public health.
Enterprise Resource Planning System includes various modules that reduce any business's workload. Additionally, it organizes the workflows, which drives towards enhancing productivity. Here are a detailed explanation of the ERP modules. Going through the points will help you understand how the software is changing the work dynamics.
To know more details here: https://blogs.nyggs.com/nyggs/enterprise-resource-planning-erp-system-modules/
2. Why Performance Testing
• Identifies problems early, before they become costly to resolve
• Reduces development cycles
• Produces better quality, more scalable code
• Prevents revenue and credibility loss due to poor performance
• Enables better planning for future expansion
• To ensure that the system meets performance expectations such as response
time and throughput under given levels of load
• Expose bugs that do not surface in functional testing phase, such as memory
management bugs, memory leaks, buffer overflows, distribution of system
resources utilization
3. Factors that governs Performance testing:
Response Time
Throughput
Tuning
Benchmarking
4. Throughput
• Capability of a application to handle multiple transactions in a give period
• Throughput represents the number of business transactions processed by
the application in a specified time duration
• The throughput should increase almost linearly with the number of
requests/number of concurrent users. Which can only happen when, there
is very little or no congestion within the Application queues
5. Response Time
10
20
30
40
100 200 300 400
Time(ms)
Concurent Users
Response Time vs Users
• It is important to find the time
duration of the complete
transactions
• Response time is a measure of
delay between the point of request
and the first response from the
application
• The response time increases
proportionally to the user load.
• More resource (CPU, Memory
utilization)
6. Tuning
• Tuning is the process by which application
performance is enhanced by setting
different values to the parameters of the
• Application for testing
• Operating system,
• Database,
• Network and other Components.
• Tuning improves the Application
performance without making any change to
the source code of the application
• The tunning lifecycle is shown pictorially
Test And Measure
CollectData
Analyze Result
Configure
Parameter
Code Baseline
7. Performance Testing Process
Test Planning
Creating vUser Scripts
Creating Scenario
Executing Scenario
Monitoring Scenario
Analyzing Test Results
Creating Scenario
Executing Scenario
Monitoring Scenario
Analyzing Test Results
Test Planning
Web Application Batch /command line Application
8. • Determine the performance test objectives
• N number of TPS from Web App
• N number of throughput for a period in Batch application
• Describe the Hardware environment
• Create a Benchmark to be recorded in subsequent
Phases
A. Define user tasks to be performed
B. Define percentage of users per task.
Test Planning
9. Virtual Users (VUs): Test Goals
Start with: 10 user Max Response Time <= 20 Sec
Incremented by: 10 user
Maximum: 200 user
Think Time: 5 sec
Test Script of typical WEB APP:
One typical user from login through completion
Test Script of typical BATCH JOB:
Execute the batch JOB
EXECUTE
10. • Monitoring the scenario: Monitor scenario execution using the various
runtime tools, NMON, Dynatrace, AppDynamics, Wily Introscope
• Analysing test results: During scenario execution, the tool records the
performance of the application under different loads and use-cases
• Use, graphs, charts and reports to analyse the application’s performance to
take corrective actions
MONITOR
ANALYZE
11. Schematic of WEB APP
Micro-service-1
Load testing in Web applications And micro-services
Optimize Code and configuration in one instance of MS, hence only one
connection is being shown in the picture
Micro-service-N
Micro-service-2
Micro-service-3 Database
Load
Balancer
Load Controller
Collect transaction response time
Collect system metrics (CPU, Memory, Threads)
Generate analysis reports and improvement suggestion
Load Generator
Simulate user activity
Simulate many user on each
generator
Agent
12. Schematic of Batch APP
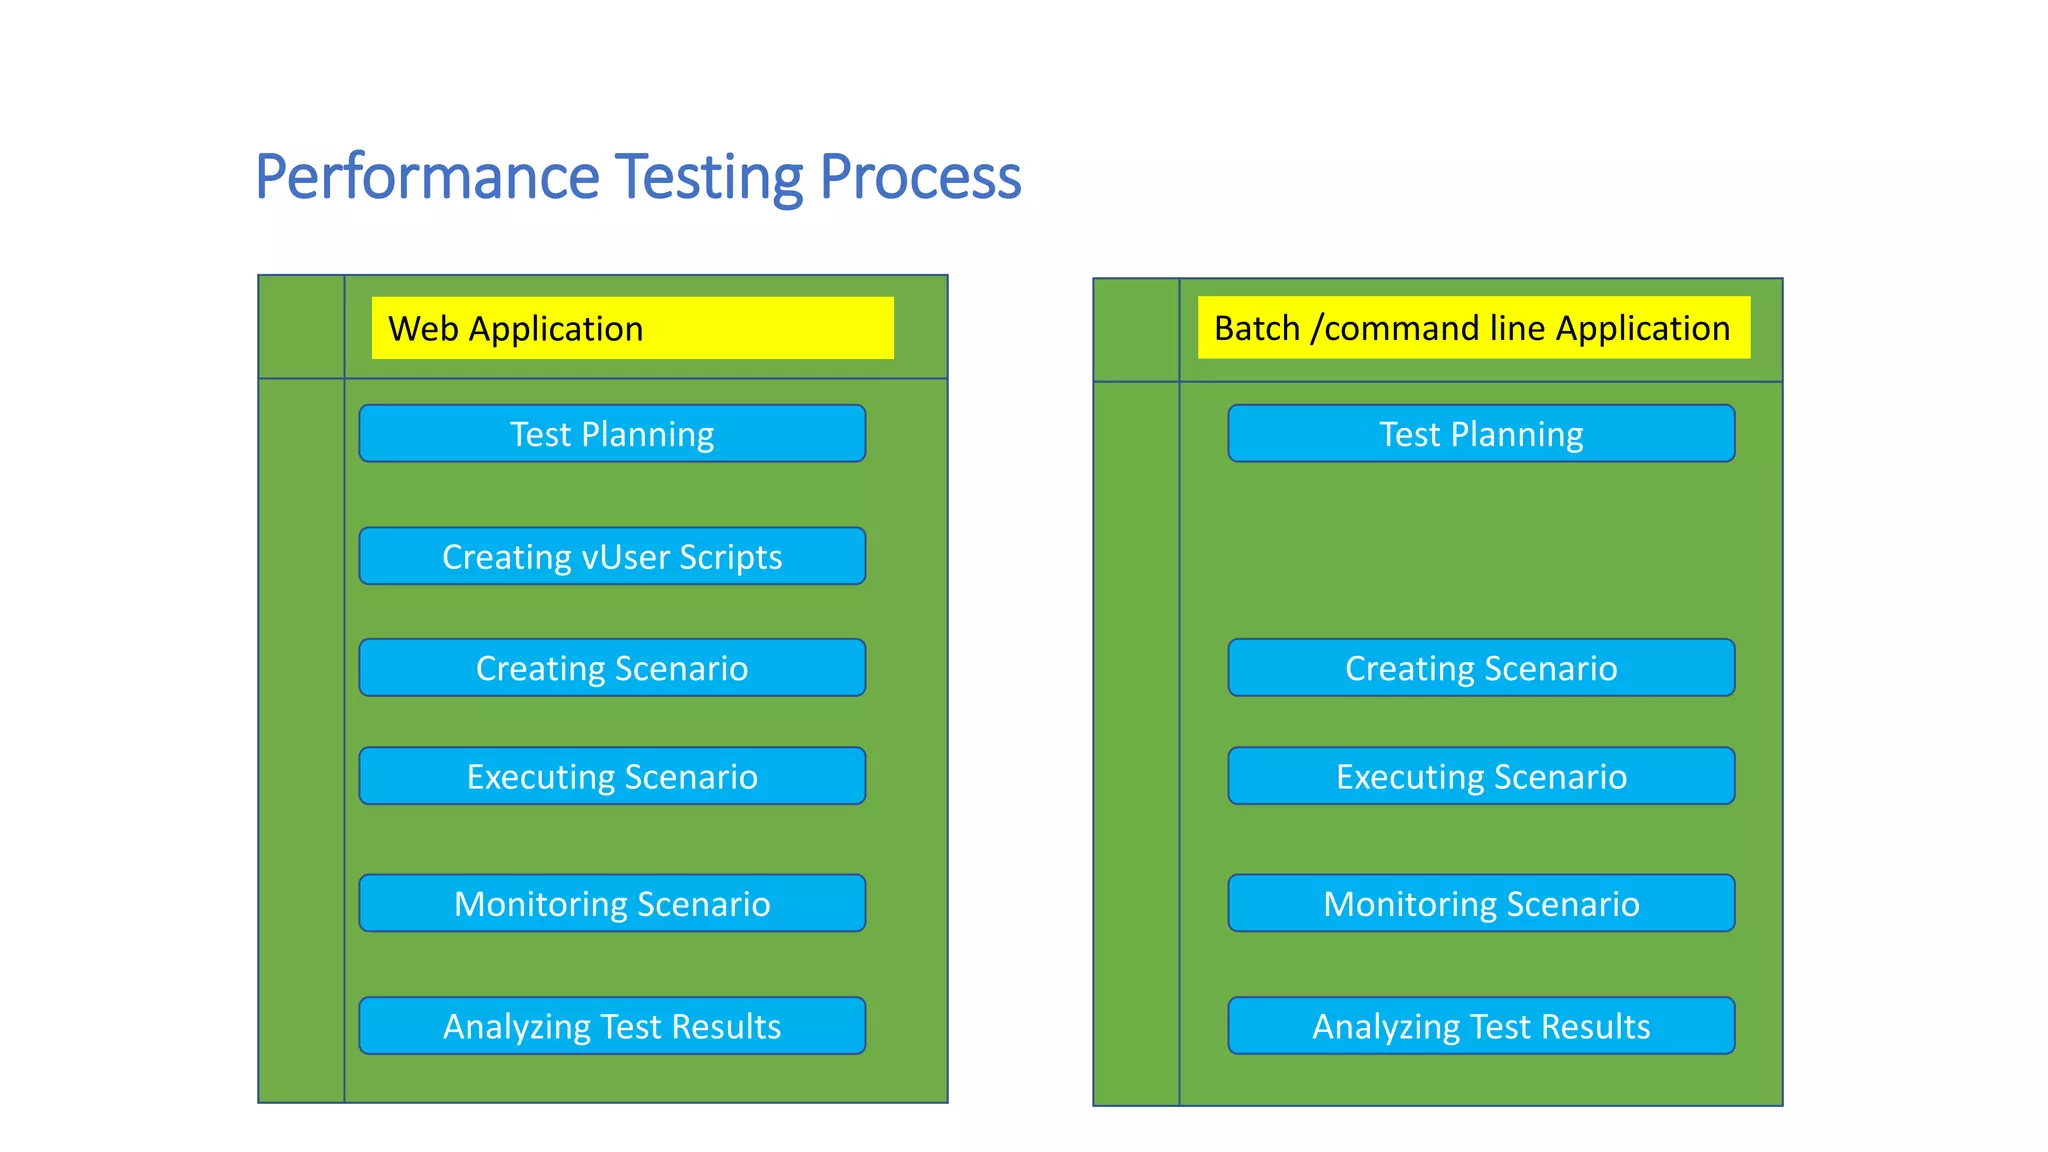
Load testing in Batch applications
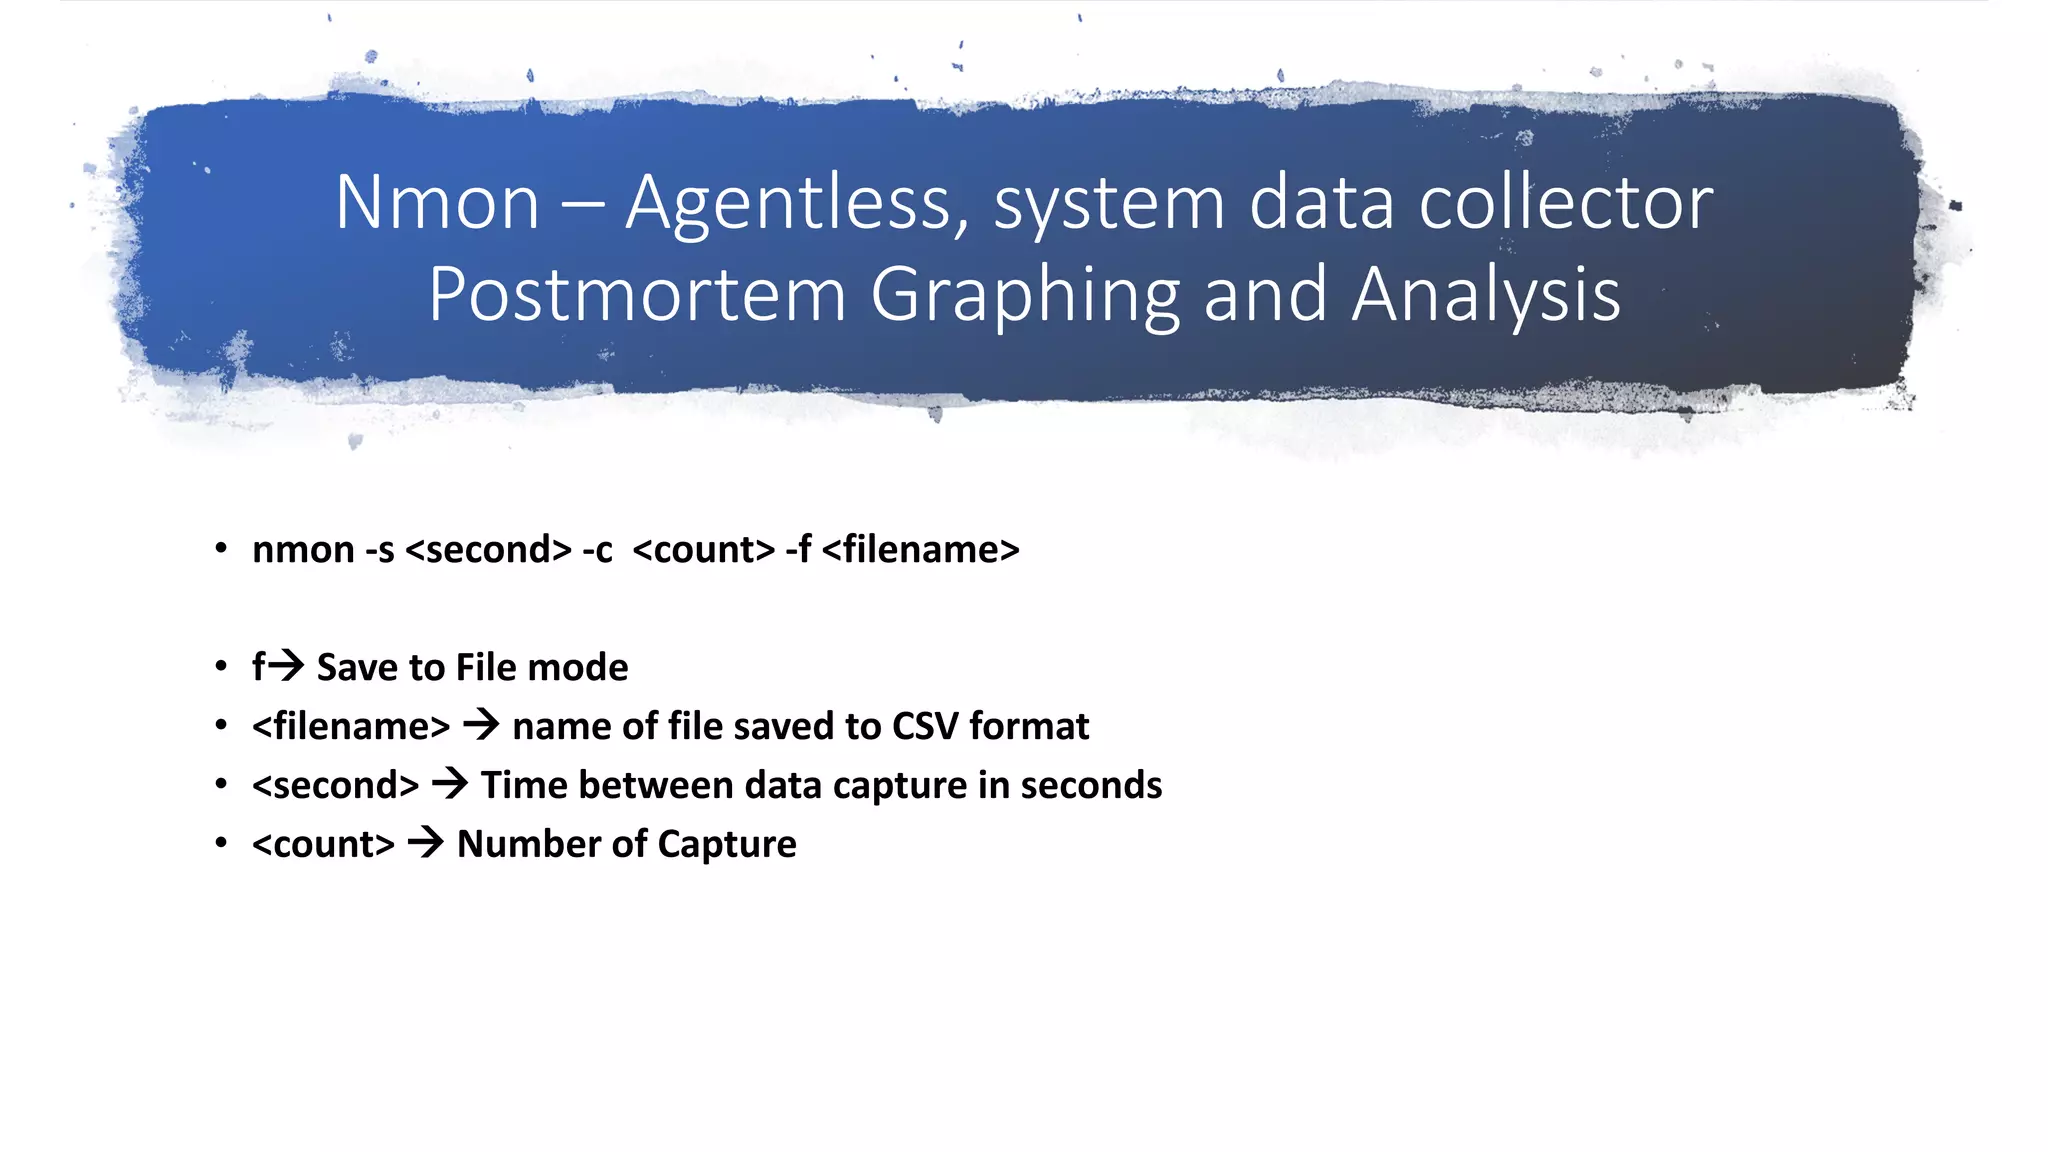
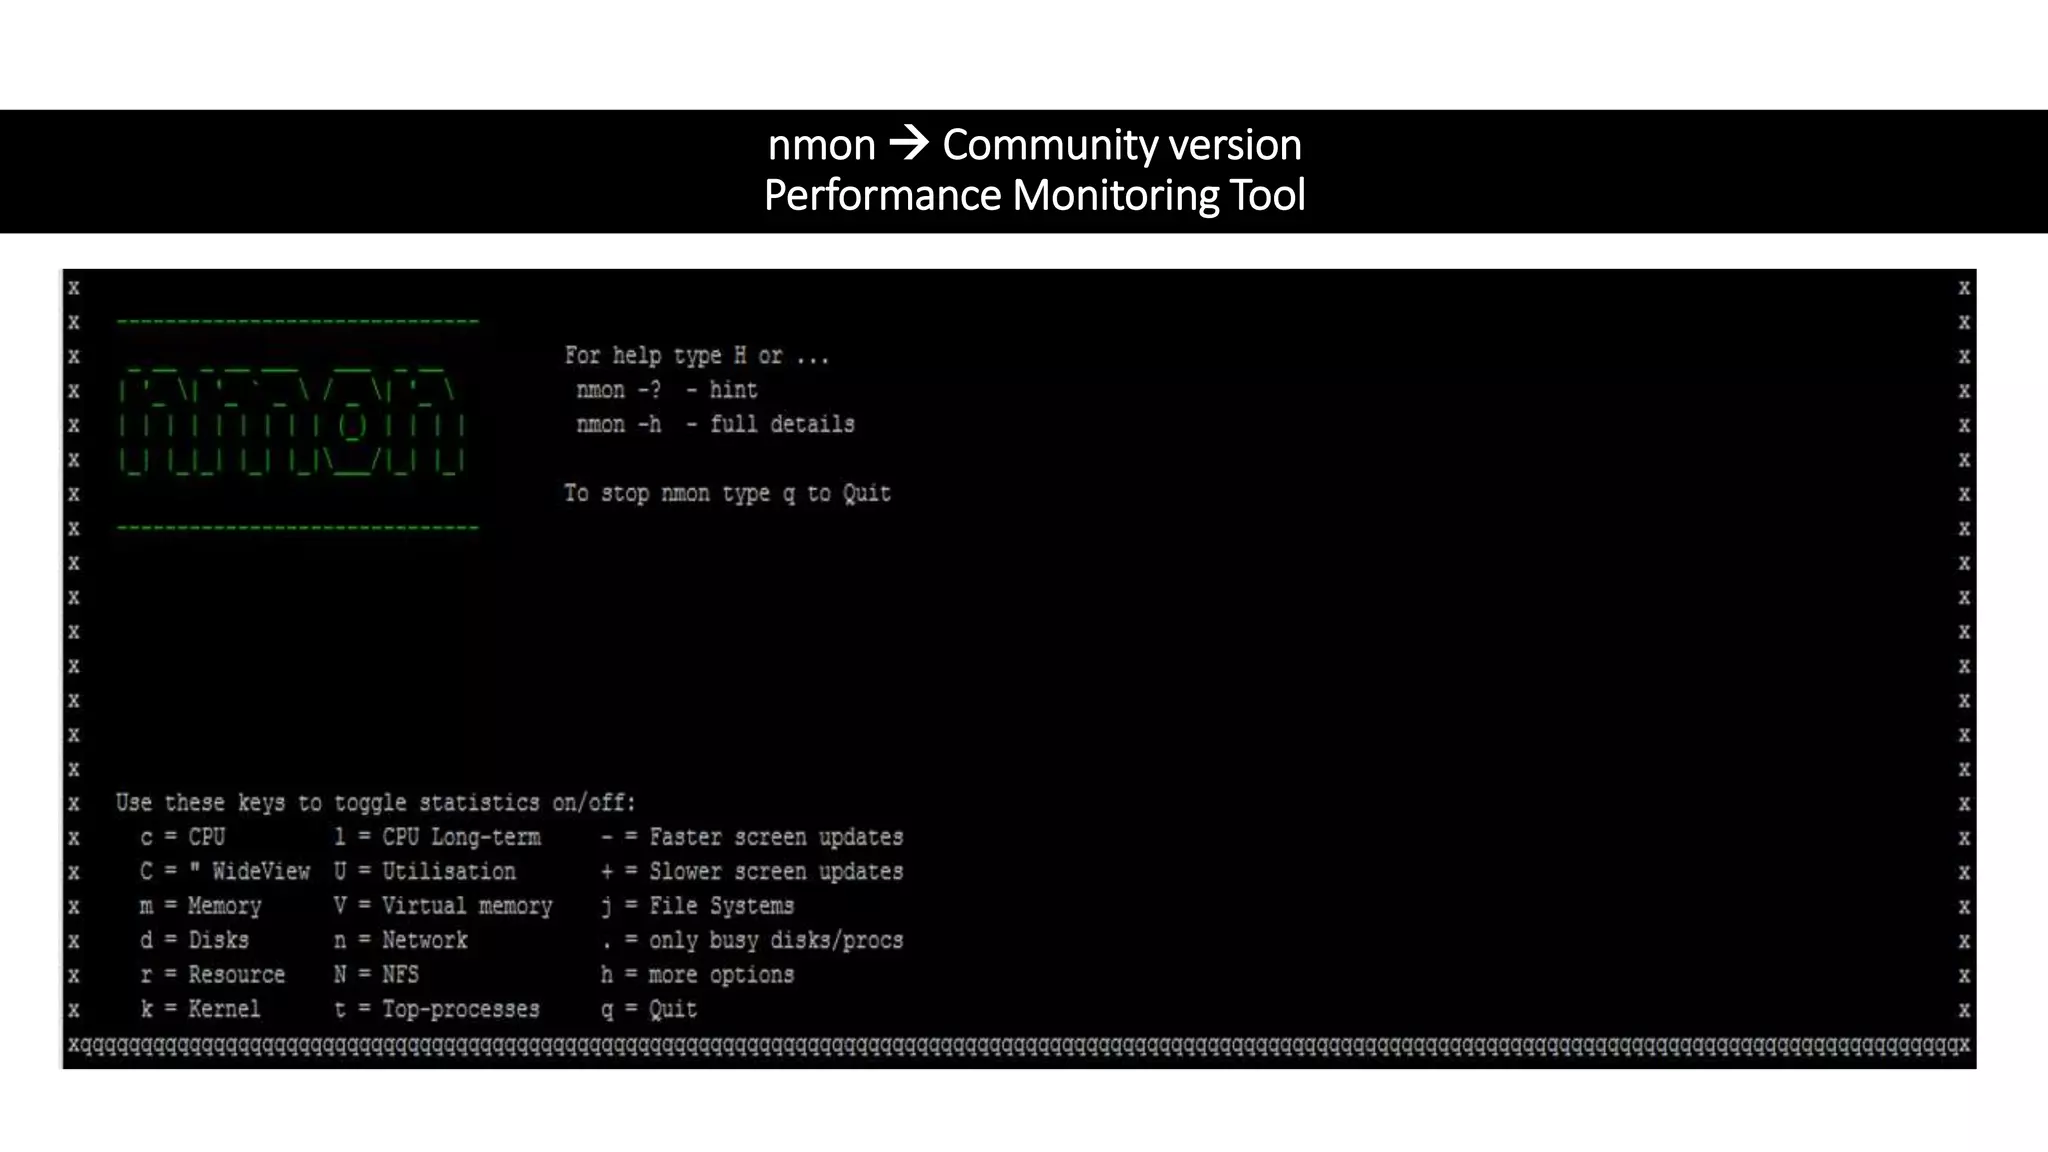
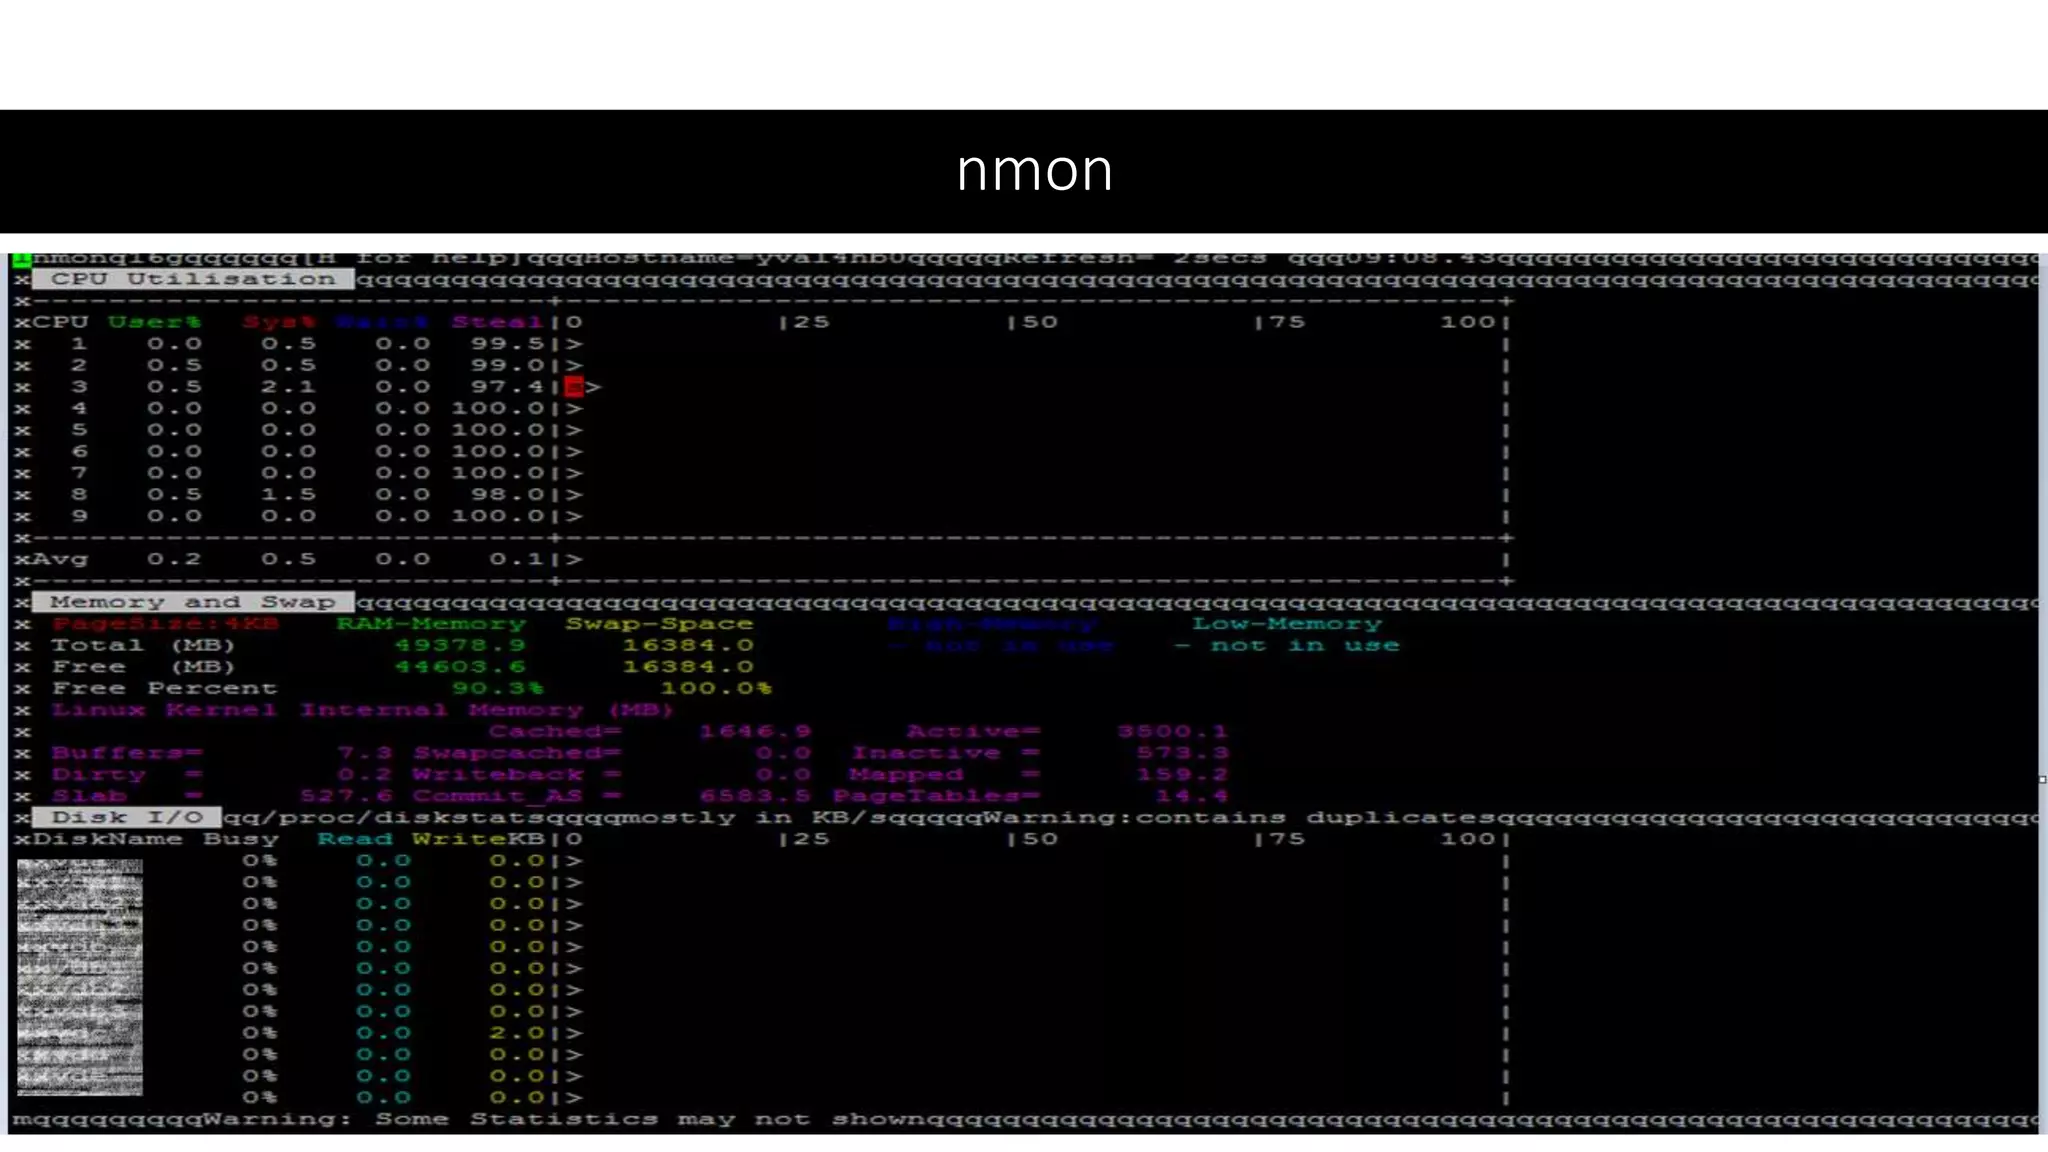
NMON System metric like CPU, Memory, Disk Usage for VM hosting APP and DB
Agent Base Code and Database drill down, Slow code and DB query identification
Batch
Application Database
Load Controller [Introscope, AppDynamics,
DynaTrace]
Collect transaction response time
Collect system metrics (CPU, Memory, Threads)
Generate analysis reports and improvement suggestion
Agent
Test File
System Metric
Collector
NMON
VM running Batch App VM hosting Database
System Metric
Collector
NMON
13. Application scalability
Golden Rule
Do One change at a time till the change is neutral to change in performance
Hardware
Memory
Monitor JVM memory Adjust till, change in Memory has no affect, Keep in mind Garbage
Collection Pause time with larger heap size
CPU
Monitor and adjust CPU value till it has no affect, a good system should give linear increase in
performance with increase in CPU value, speed and number of core
Disk
Monitor the disk I/O
Read and Write operation per second in terms of Byte/KB/MB
Implement caching to avoid Read/Write to disk if permitted by design
Software/Code
Analyze log to find any duplicate query, some of which could be sometime so heavy that system can
slow down by 10-20 times
Tune JPA/Hibernate and database parameters
Monitor the affect of multi-threading to set optimum number of concurrent threads in the application
Database
Change default DB parameters to appropriate value
PostgreSQL effective_cache_size & shared_buffers
Increase in cache can reduce SWAP resulting in enhance CPU utilization
14. Application scalability
Multi Threading
• Too many are not always good
• Non are not suitable
Multi-Threading Applicability scenario
• Multiple reads of non changing data are ok
• No Write by multiple threads to same resource (file system)
Independent Instances
• No session in web application
• Small functions small stack, better memory management
• No synchronization
• No usage of common system
• DB sequence for unique identifiers
15. Batch Insert without Explicit Flush
Batch inserts, updates property in hibernate
<property name ="hibernate.jdc.batch_size" value="20"/>
More than 20-30 does not give better result
0-20 improves time by 300%
Must be coupled with the ordered parameters ,Cascading and batching, the batching
is propagated to child
<property name="hibernate.order_inserts" value="true"/>
<property name="hibernate.order_updates" value="true"/>
Multiple insert/update/delete statement are combined together to do in batch
If our entities use GenerationType.IDENTITY identifier generator, Hibernate will silently
disable batch inserts/updates.
Use Pagination to avoids OOM on client side and improved performance
16. Using
EntityManager.flush() and
EntityManager.clear() in application code, whenever batch size is reached, removes
OutOfMemory errors and enhances performance, since the persistence context are
regulary cleared
@Transactional
@Test
public void flushingAfterBatch() {
for (int i = 0; i < 1000; i++) {
if (i > 0 && i % BATCH_SIZE == 0) {
entityManager.flush();
entityManager.clear();
}
MyObj obj = createMyObj(i);
entityManager.persist(obj);
}
}
Batch Insert with Explicit Flush
17. Spring Batch-Partition to parallelize the batch without code
Offline Tables
Insert
Online Tables
Rename Offline
to Online Table
No impact to online tables, parallel processing
Step-2- split to
smaller files
Step-3-Insert
in Parallel
Offline Tables
Daily Refresh
Truncate
Step-1-
Truncate
Step-4-Reanme
Spring-Batch Partition for Parallel Processing
19. PostgreSQL Slow Query Report
postgresql.conf:
shared_preload_libraries = 'pg_stat_statements'
pg_stat_statements.max = 10000 Maximum number of statements tracked by the module, default=5K
pg_stat_statements.track = all top, all, none, default =top
Query to check above is applied
SELECT * FROM pg_available_extensions
WHERE
name = 'pg_stat_statements' and
installed_version is not null;
• top those issued directly by clients
• all track nested statements (such as
statements invoked within functions)
• none disable statement statistics
collection
20. SELECT queryid,query AS short_query, round(total_time::numeric, 2) AS total_time, calls, rows,
round(total_time::numeric / calls, 2) AS avg_time, round((100 * total_time / sum(total_time::numeric)
OVER ())::numeric, 2) AS percentage_cpu FROM pg_stat_statements ORDER BY total_time DESC LIMIT
20;
https://gist.github.com/anvk/475c22cbca1edc5ce94546c871460fdd
21. Use non-commercial tool During Development
Stage To figure out performance bottlenecks
Using HPROF
HPROF is a tool to profile Heap and CPU, which is shipped along with Java.
It can be used during development.
The JVM creates a huge file with the name java.hprof.txt after it shuts down.
This contains information about heap profiles, allocated memories to instances, dynamic stack traces, etc.
java agentlib:hprof=heap=sites Hello.java
Other JDK Tools
• JVisualVM
• JConsole
• Java mission control JMC
• JHAT heap dump analysis
• JSTACK
• Eclipse Memory Analyzer (MAT)
• Heap dump analysis
22. Heap Dump Creation and Analysis
Create Heap Dump
1. Using JMAP (JDK tool)
1. jmap -dump:live,file=/tmp/heapDump.bin PID
1. live objects in the heap are dumped
2. Using JVM Option
1. -XX:+HeapDumpOnOutOfMemoryError -XX:HeapDumpPath=/logs/heapdump
Analyze Heap Dump with Eclipse Memory Analyzer
1. More convenient and easy
Analyze Heap Dump JHAT (JDK tool)
1. jhat -J-Xmx2g -port 7001 /tmp/heapDump.bin
2. WEB ACCESS TO JHAT
1. http://localhost:7001
23. Thread Dump Creation and Analysis
Create Thread Dump
1. Using JSTACK (JDK tool)
1. jstack -l <PID> > <FILE-PATH>
2. Using KILL
1. kill -3 <PID>
3. Take in sample of say few minute (e.g. 5,10,15 ) interval
to check whether the threads present in first thread dump are still present in subsequent dumps
Analyze Thread Dump
1. These are text file which could be manually analyzed
2. Introscope
24. PostgreSQLhttps://www.revsys.com/writings/postgresql-performance.html
shared_buffers Editing this option is the simplest way to improve the performance of your database server.
The default is pretty low for most modern hardware. Thumb rule roughly 25% of available RAM on the system
Most people find that setting it larger than a third starts to degrade performance.
effective_cache_size This value tells PostgreSQL's optimizer how much memory PostgreSQL has available for
caching data and helps in determine whether or not it use an index or not. The larger the value increases the likely hood
of using an index. This should be set to the amount of memory allocated to shared_buffers plus the amount of OS
cache available. Often this is more than 50% of the total system memory.
work_mem This option is used to control the amount of memory using in sort operations and hash tables.
While you may need to increase the amount of memory if you do a ton of sorting in your application, care needs to be taken.
This isn't a system wide parameter, but a per operation one. So if a complex query has several sort operations in
it it will use multiple work_mem units of memory. Not to mention that multiple backends could be doing this at once.
This query can often lead your database server to swap if the value is too large.
25. Hardware
RAM — The more RAM you have the more disk cache you will have.
This greatly impacts performance considering memory I/O is thousands of times faster than disk I/O.
Disk types — Obviously fast Ultra-320 SCSI ( Solid State) disks are your best option, however high end SATA drives are also
very good. With SATA each disk is substantially cheaper and with that you can afford more spindles than with SCSI on
the same budget.
Disk configuration — The optimum configuration is RAID 1+0 with as many disks as possible.
Separate disk for pg_xlog <transaction log , can not be deleted> ,
and pg_log < error messages, executed query log, dead lock information, can be deleted>
CPUs — The more CPUs the better, however if your database does not use many complex functions your money is best
spent on more RAM or a better disk subsystem
26. Leak Detection and Connection Pool in Hikari
maximumPoolSize=10
leakDetectionThreshold=60000
hikari.properties
Explain check to Check Index scan strategy
Index the join keys in child tables
leakDetectionThreshold
• This property controls the amount of time that a connection can be out of the pool before a
message is logged indicating a possible connection leak.
• The default value of 0 means leak detection is disabled.
• Lowest acceptable value for enabling leak detection is 2000 (2 secs).
• E.g. A slow DB server can delay the query response time more than this value, and report leak.
• E.g. The query itself is slower than the threshold value
• Useful for transactional system
• Be careful, a reporting application may take much longer to load data
27. Check blocking Query
PostgreSQL 9.6
SELECT * FROM pg_stat_activity WHERE waiting = TRUE;
PostgreSQL 10
SELECT * FROM pg_stat_activity WHERE wait_event IS NOT NULL AND
backend_type = 'client backend';
28. @Entity
@Table(name = “table_parent")
public class ParentEntity {
@OneToMany(mappedBy = "ParentEntity, fetch = FetchType.EAGER,)
private Set<ChildEntity> ChildEntity;
}
@Entity
@Table(name = “table_child")
public class ChildEntity {
}
Common N+1 issue in Eager load situation and solution
Parent Child data required to be loaded in single Query by Eager Loading, In case of Lazy loading the Fetch Join not required
29. Common N+1 issue in Eager load situation and solution
Results into Single Query
CriteriaBuilder builder = entityManager.getCriteriaBuilder();
CriteriaQuery<ParentEntity> criteria = builder.createQuery(ParentEntity.class);
Root<ParentEntity> root = criteria.from(ParentEntity.class);
// changes multiple query Single Query
Fetch<ParentEntity, ChildEntity> jn = root.fetch("ChildEntity", JoinType.INNER);
return entityManager.createQuery(criteria).getResultList();
Select *
from table_parent as a inner join table_child as b on a.parent_id = b.child_id where a.parent_id=‘xyz;
Results into Multiple Queries:
CriteriaBuilder builder = entityManager.getCriteriaBuilder();
CriteriaQuery<ParentEntity> criteria = builder.createQuery(ParentEntity.class);
Root<ParentEntity> root = criteria.from(ParentEntity.class);
return entityManager.createQuery(criteria).getResultList();
30. Wily Introscope :
Gives below metrics for Performance Monitoring and Analysis
CPU Utilization
Java Thread Monitoring
Java Memory Utilization
OS memory Utilization
File System Usage
SQL Query Monitoring
Java Code Profiling
32. Nmon – Agentless, system data collector
Postmortem Graphing and Analysis
• nmon -s <second> -c <count> -f <filename>
• f Save to File mode
• <filename> name of file saved to CSV format
• <second> Time between data capture in seconds
• <count> Number of Capture
35. Suddenly the world has come to a crawl
1. Watch out for the disk space in app server which may often run out during
high volume load test due to large application logs, big request, and
response files in application server
2. Watch out for the disk space in database server which may run out due to
large transaction queries, temp file generation, DB log generation.
38. Important CPU states
system (sy)
The low-level kernel tasks, like interacting with the hardware, memory allocation, communicating between OS processes,
running device drivers and managing the file system, CPU scheduler.
user (us)
One level up, the “user” CPU state shows CPU time used by user space processes. Like your application, or the database
server running on your machine.
idle (id)
The “idle” CPU state shows the CPU time that’s not actively being used. Internally, idle time is usually calculated by a task
with the lowest possible priority.
iowait (wa)
“iowait” is a sub category of the “idle” state. It marks time spent waiting for input or output operations, like reading or
writing to disk. When the processor waits for a file to be opened, for example, the time spend will be marked as “iowait”.
For example, when an in-memory database needs to flush a lot of data to disk, or when memory is swapped to disk.
Other statistics
The “hardware interrupt” (hi or irq) and “software interrupt” (si, or softirq) categories are time spent servicing interrupts,
and the “steal” (st) subcategory marks time spent waiting for a virtual CPU in a virtual machine.