Download as PDF, PPTX

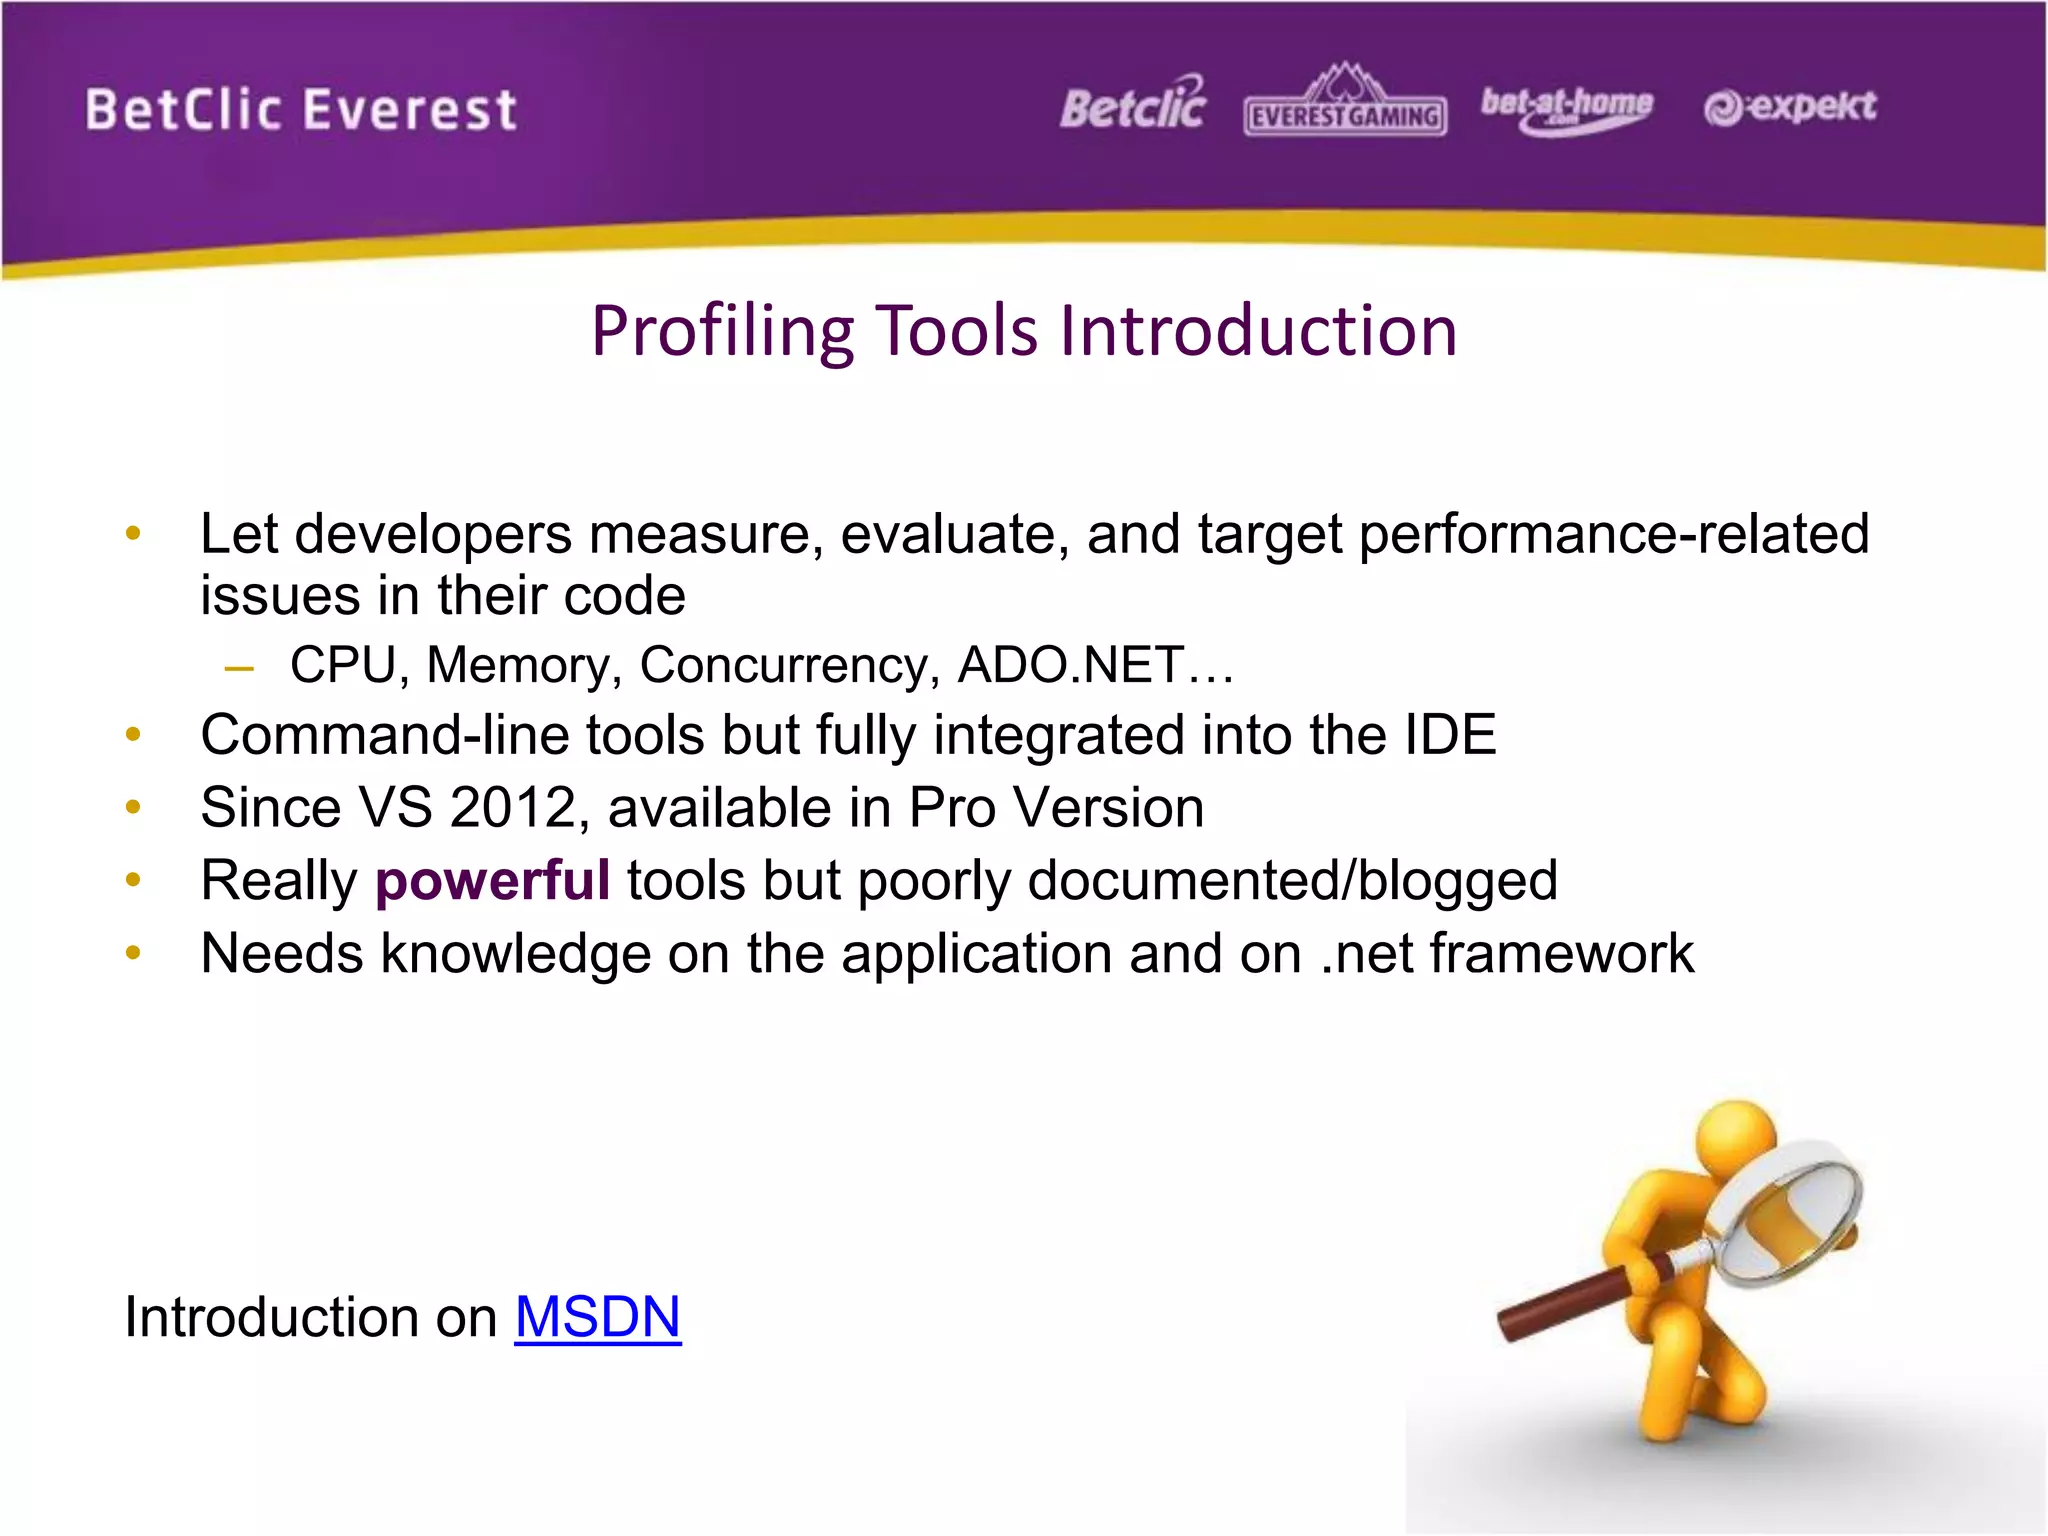
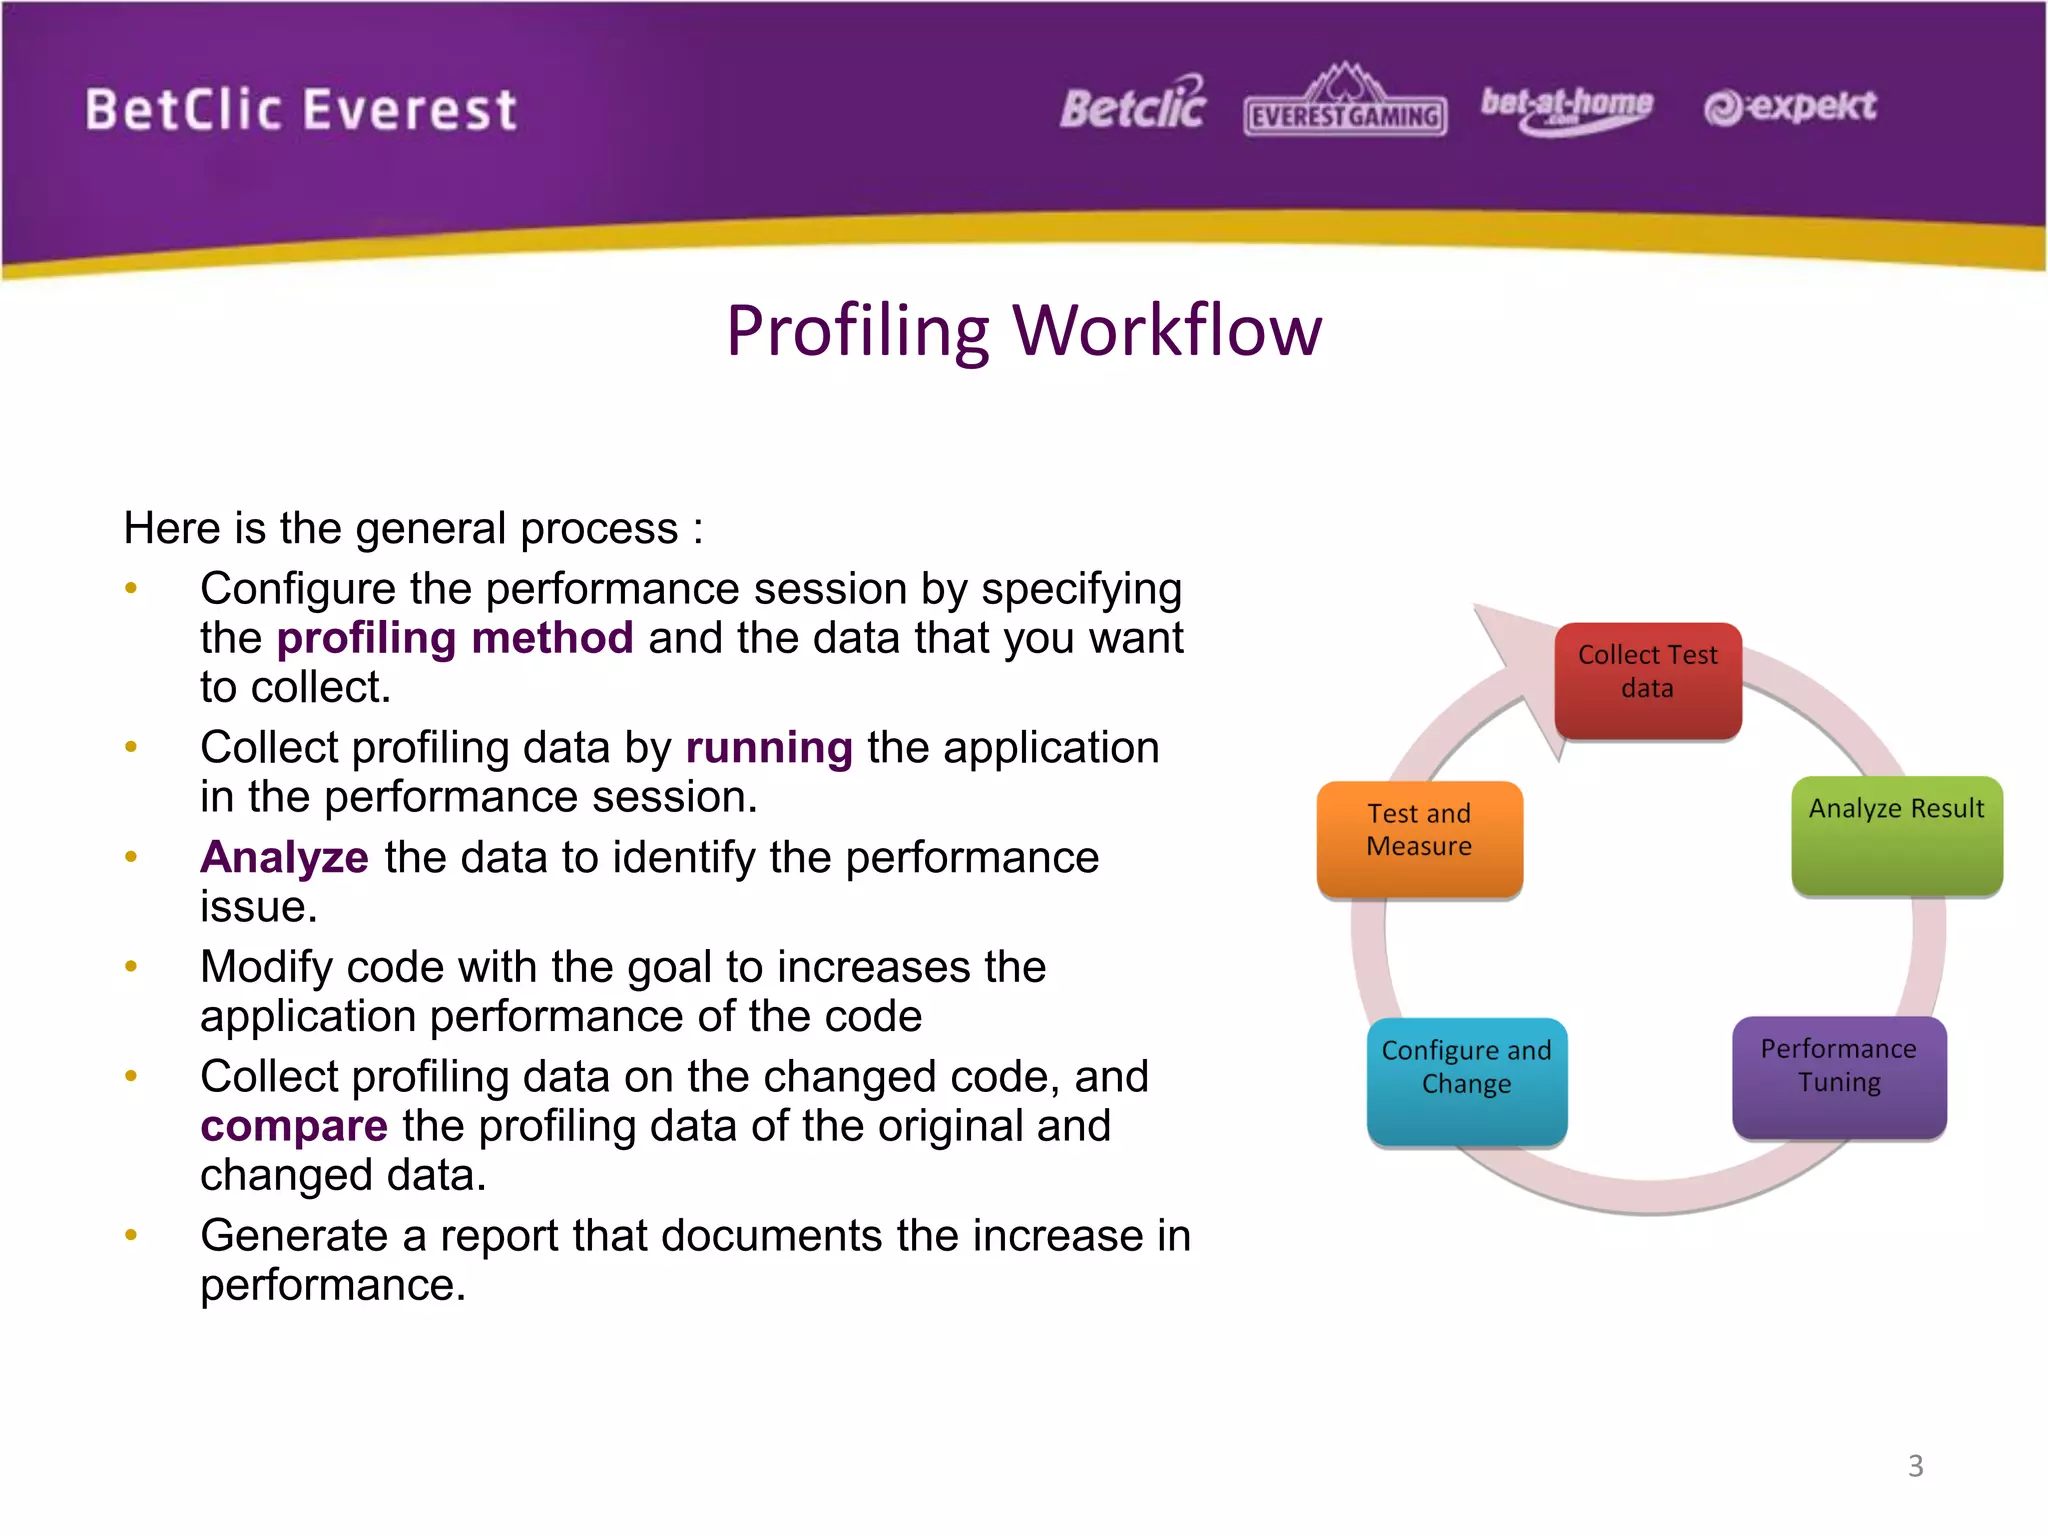
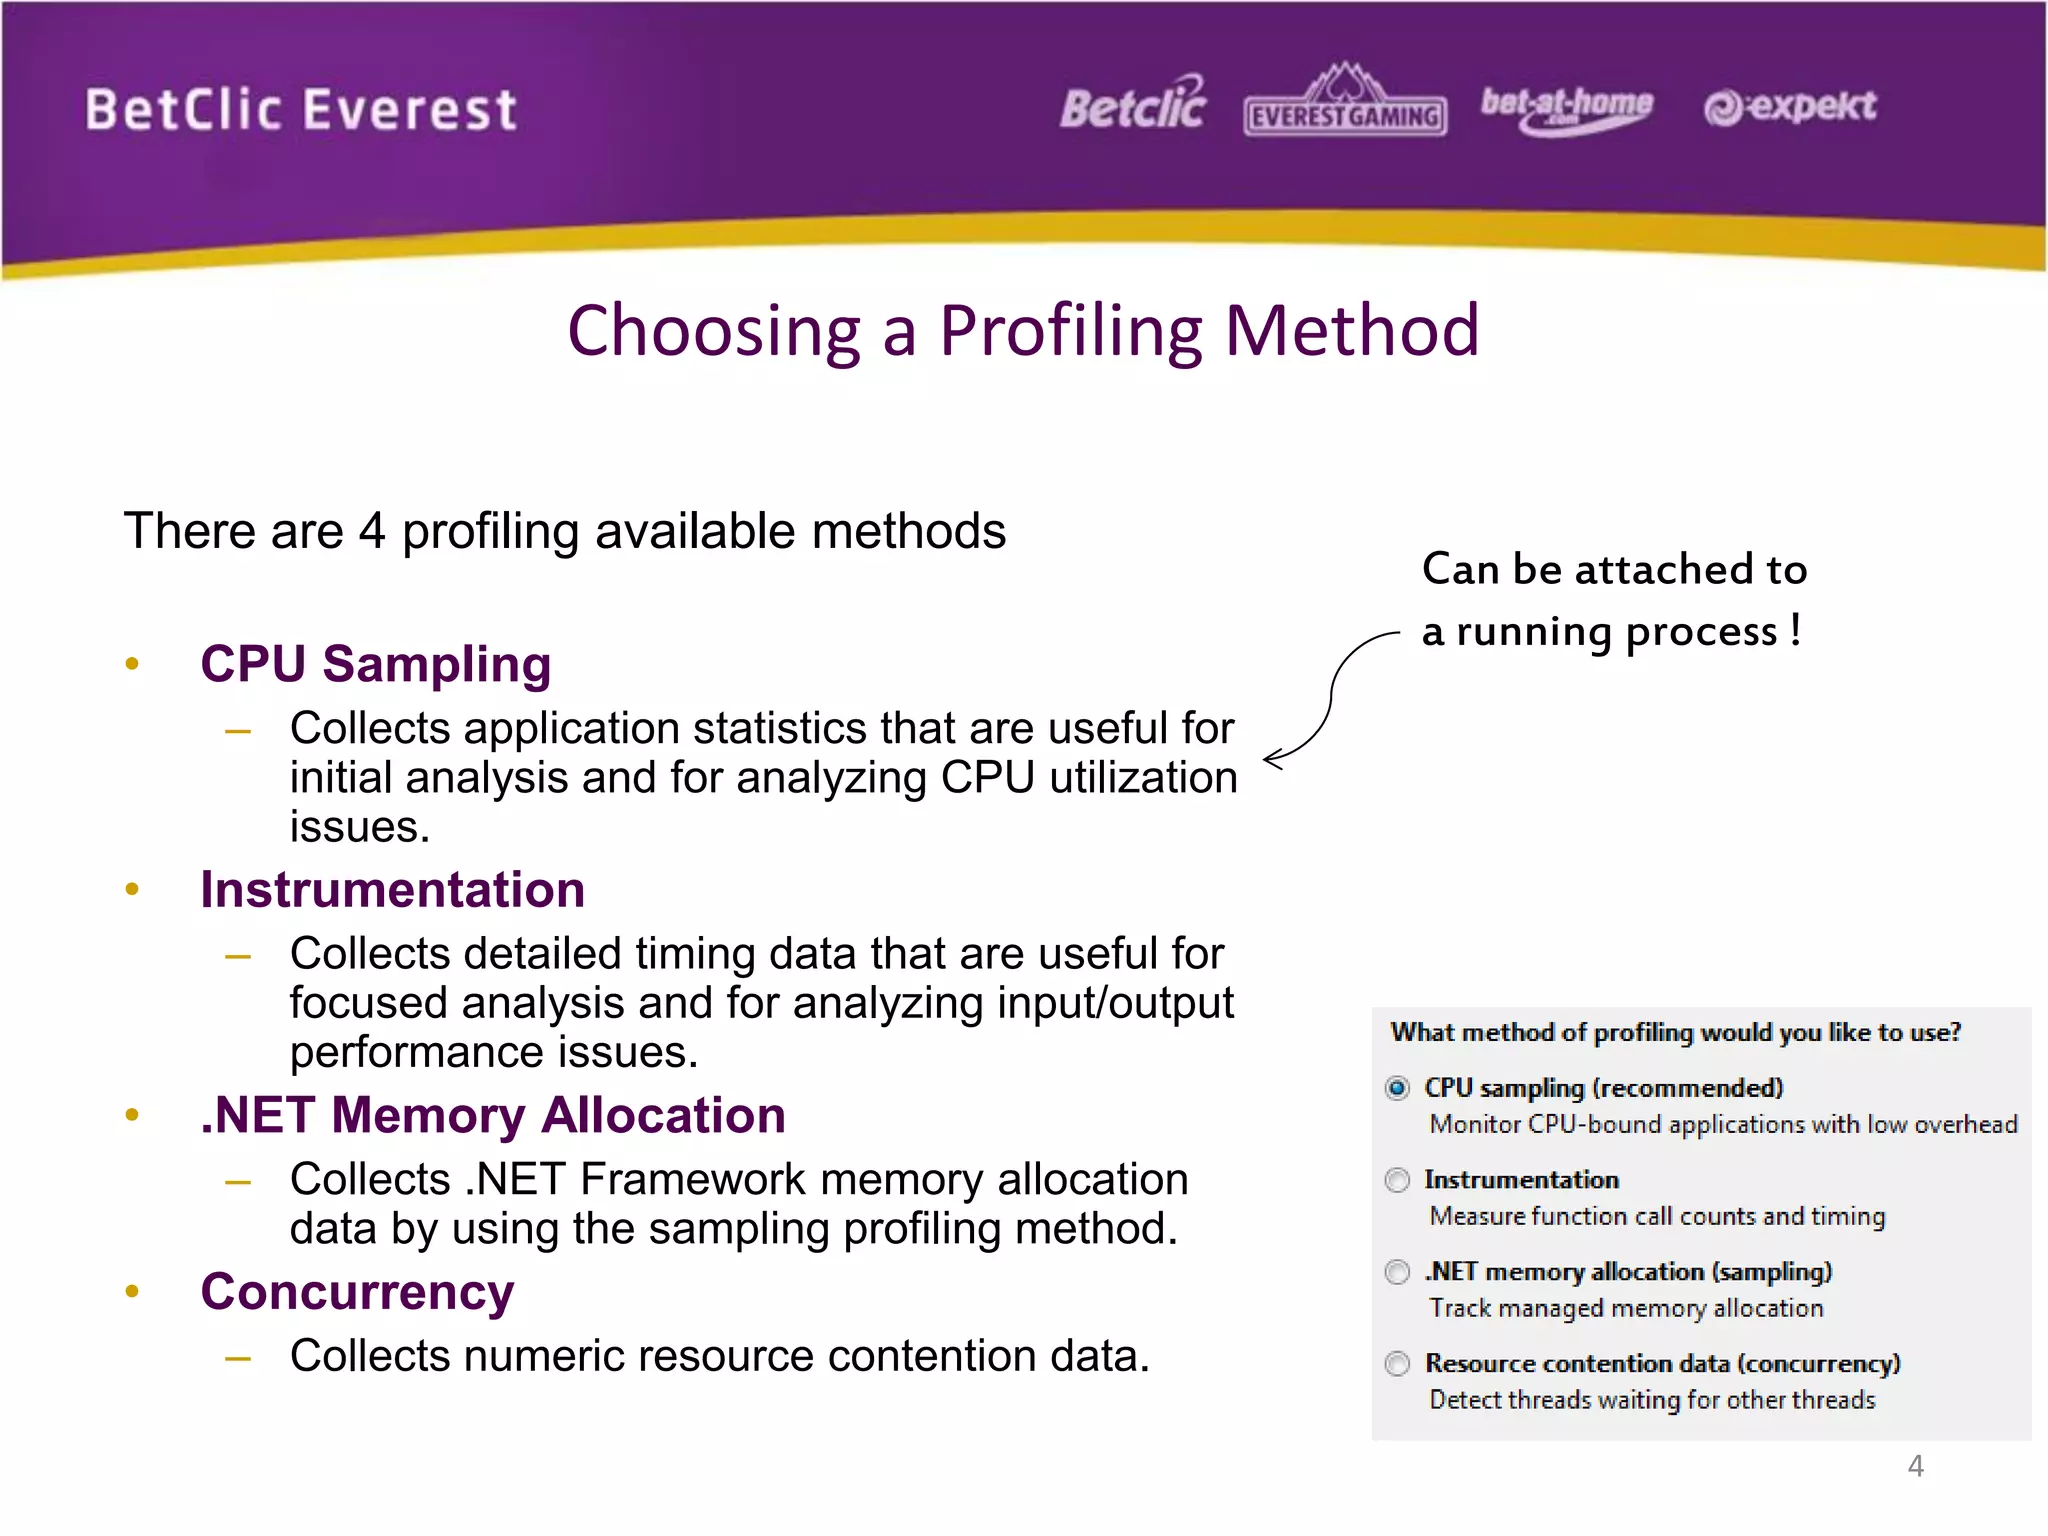

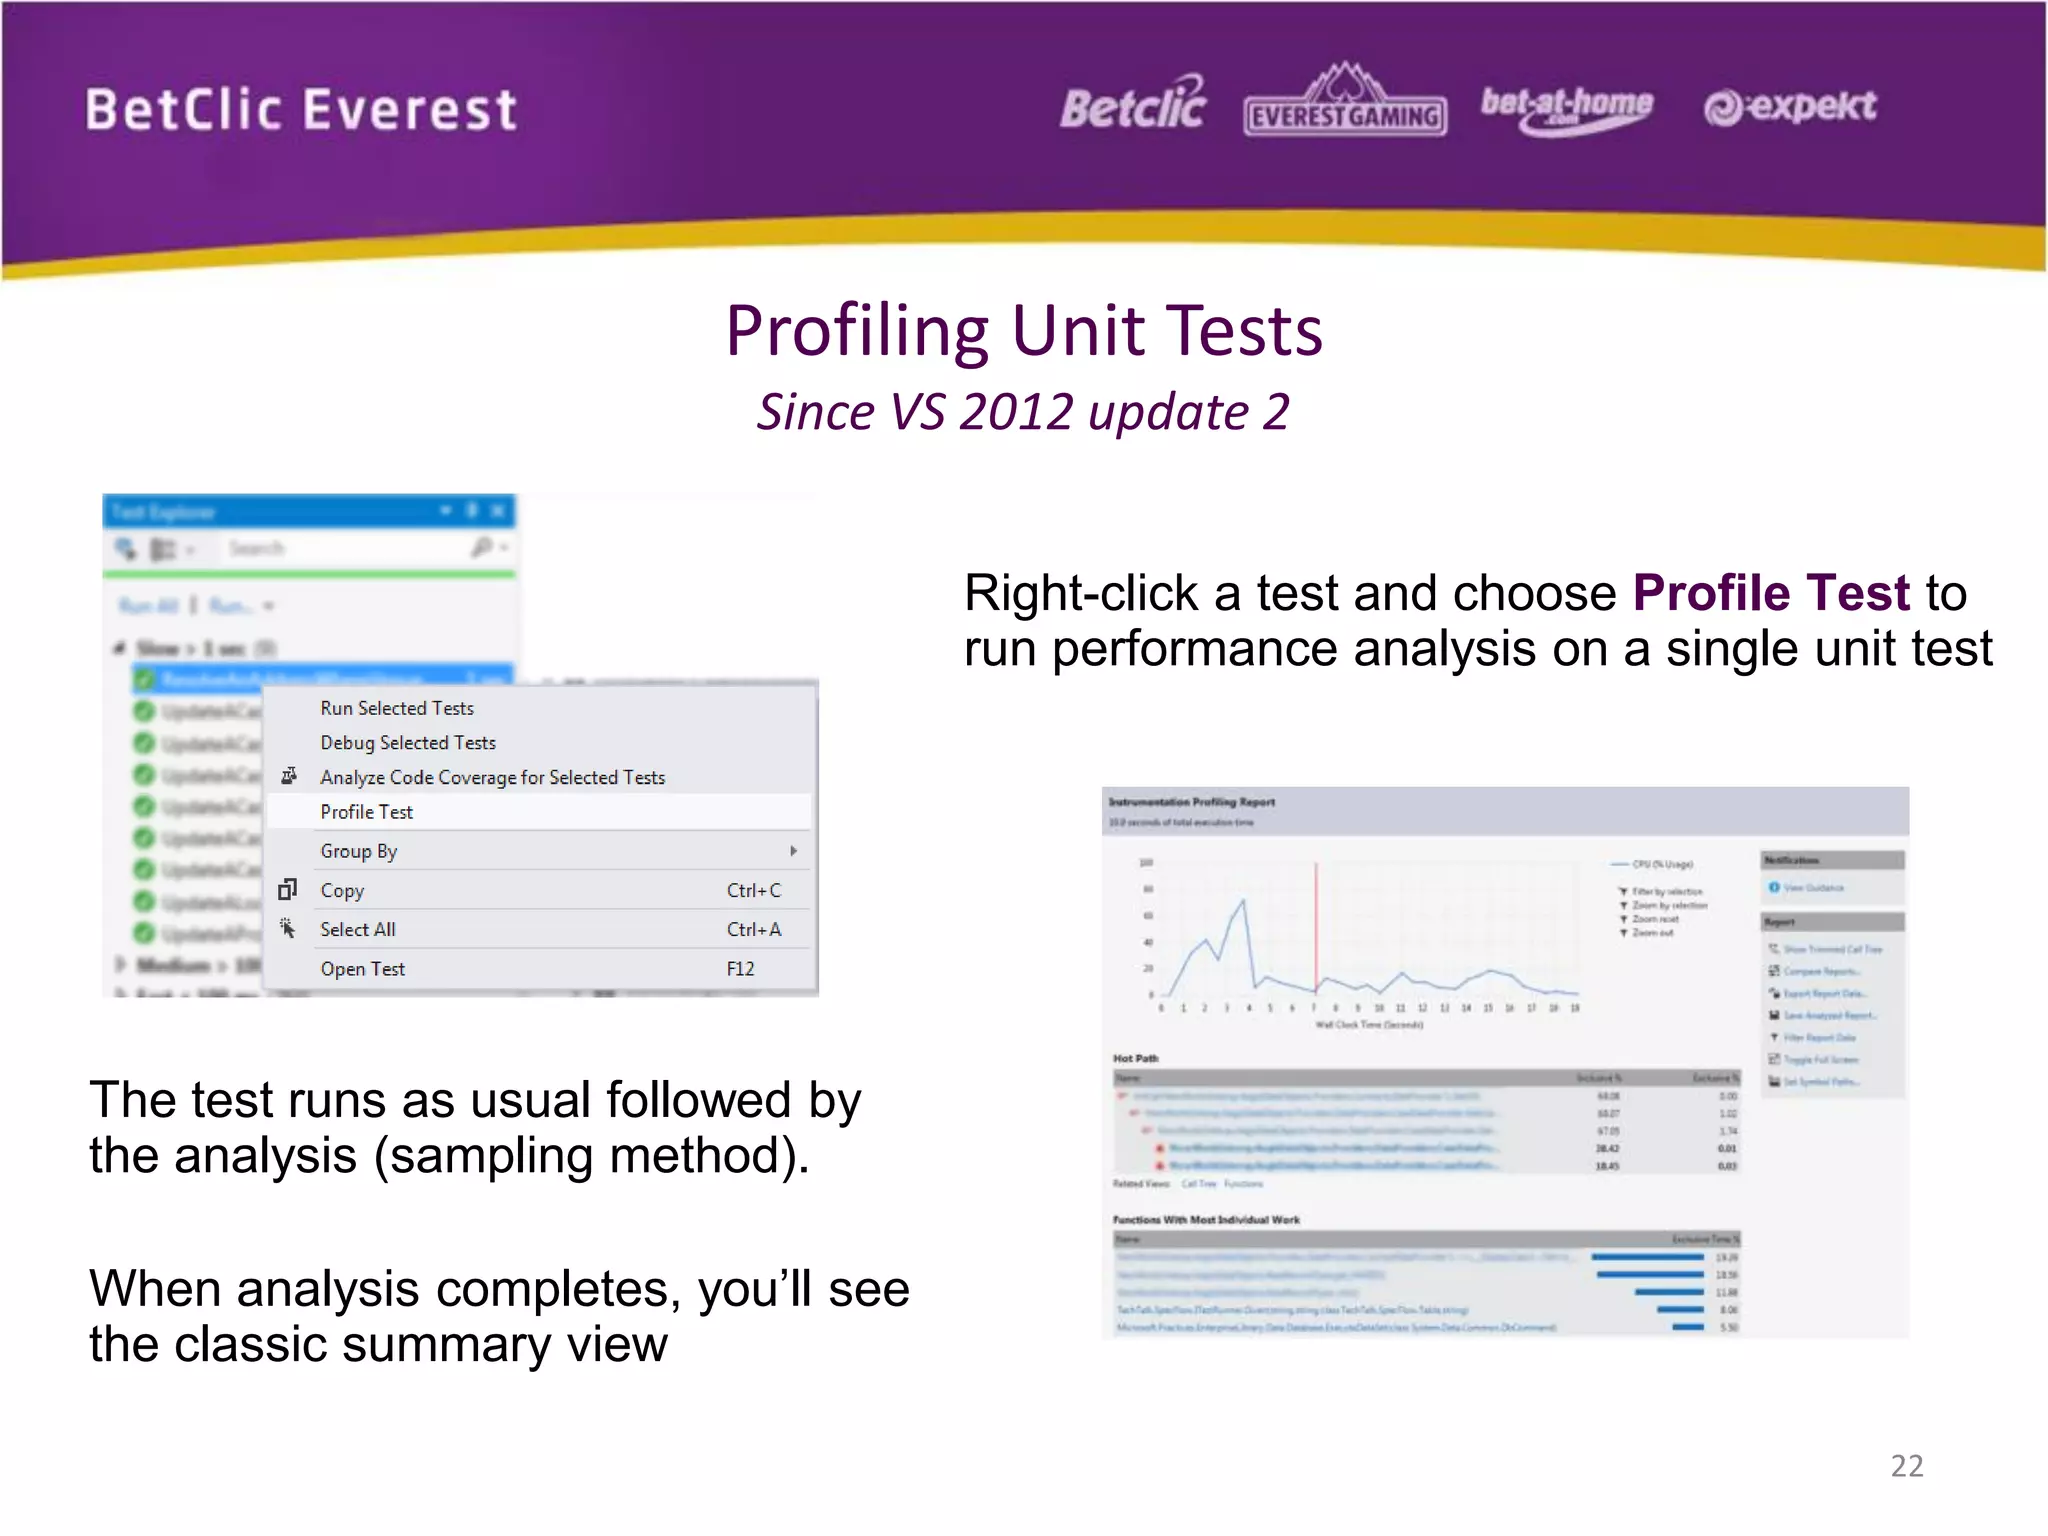


The document discusses the Visual Studio Profiler, a tool designed for developers to measure and improve performance issues in applications. It outlines the profiling process, various methods available, and detailed profiling workflows for CPU sampling, instrumentation, memory allocation, and concurrency. Additionally, it highlights the importance of data collection, analysis, and offers insights into optimizing application performance.