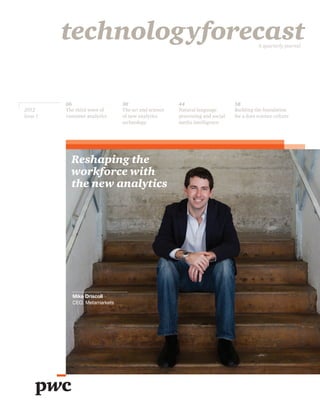
A quarterly journal


          06                   30                    44                      58
2012      The third wave of    The art and science   Natural language        Building the foundation
Issue 1   customer analytics   of new analytics      processing and social   for a data science culture
                               technology            media intelligence


            Reshaping the
            workforce with
            the new analytics


            Mike Driscoll
            CEO, Metamarkets
Acknowledgments


                                             Advisory                        Center for Technology
                                             Principal & Technology Leader   & Innovation
                                             Tom DeGarmo                     Managing Editor
                                                                             Bo Parker
                                             US Thought Leadership
                                             Partner-in-Charge               Editors
                                             Tom Craren                      Vinod Baya
                                                                             Alan Morrison
                                             Strategic Marketing
                                             Natalie Kontra                  Contributors
                                             Jordana Marx                    Galen Gruman
                                                                             Steve Hamby and Orbis Technologies
                                                                             Bud Mathaisel
                                                                             Uche Ogbuji
                                                                             Bill Roberts
                                                                             Brian Suda

                                                                             Editorial Advisors
                                                                             Larry Marion

                                                                             Copy Editor
                                                                             Lea Anne Bantsari

                                                                             Transcriber
                                                                             Dawn Regan


02	   PwC Technology Forecast 2012 Issue 1
US studio                            Industry perspectives                       Jonathan Newman
Design Lead                          During the preparation of this              Senior Director, Enterprise Web & EMEA
Tatiana Pechenik                     publication, we benefited greatly           eSolutions
                                     from interviews and conversations           Ingram Micro
Designer                             with the following executives:
Peggy Fresenburg                                                                 Ashwin Rangan
                                     Kurt J. Bilafer                             Chief Information Officer
Illustrators                         Regional Vice President, Analytics,         Edwards Lifesciences
Don Bernhardt                        Asia Pacific Japan
James Millefolie                     SAP                                         Seth Redmore
                                                                                 Vice President, Marketing and Product
                                     Jonathan Chihorek                           Management
Production
                                     Vice President, Global Supply Chain         Lexalytics
Jeff Ginsburg
                                     Systems
                                     Ingram Micro                                Vince Schiavone
Online                                                                           Co-founder and Executive Chairman
Managing Director Online Marketing   Zach Devereaux                              ListenLogic
Jack Teuber                          Chief Analyst
                                     Nexalogy Environics                         Jon Slade
Designer and Producer                                                            Global Online and Strategic Advertising
Scott Schmidt                        Mike Driscoll                               Sales Director
                                     Chief Executive Officer                     Financial Times
Animator                             Metamarkets
Roger Sano                                                                       Claude Théoret
                                     Elissa Fink                                 President
Reviewers                            Chief Marketing Officer                     Nexalogy Environics
Jeff Auker                           Tableau Software
Ken Campbell                                                                     Saul Zambrano
Murali Chilakapati                   Kaiser Fung                                 Senior Director,
Oliver Halter                        Adjunct Professor                           Customer Energy Solutions
Matt Moore                           New York University                         Pacific Gas & Electric
Rick Whitney
                                     Kent Kushar
Special thanks                       Chief Information Officer
Cate Corcoran                        E. & J. Gallo Winery
WIT Strategy
                                     Josée Latendresse
Nisha Pathak                         Owner
Metamarkets                          Latendresse Groupe Conseil

Lisa Sheeran                         Mario Leone
Sheeran/Jager Communication          Chief Information Officer
                                     Ingram Micro

                                     Jock Mackinlay
                                     Director, Visual Analysis
                                     Tableau Software


                                     	                               Reshaping the workforce with the new analytics	     03
The right data +
                                                the right resolution =
                                                a new culture
                                                of inquiry


                                                Message from the editor                    disease sit at the other end of the size
                                                James Balog1 may have more influence       spectrum. Scientists’ understanding
                                                on the global warming debate than          of the role of amyloid particles in
                                                any scientist or politician. By using      Alzheimer’s has relied heavily on
                                                time-lapse photographic essays of          technologies such as scanning tunneling
                                                shrinking glaciers, he brings art and      microscopes.2 These devices generate
                                                science together to produce striking       visual data at sufficient resolution
                                                visualizations of real changes to          so that scientists can fully explore
                                                the planet. In 60 seconds, Balog           the physical geometry of amyloid
                                                shows changes to glaciers that take        particles in relation to the brain’s
                                                place over a period of many years—         neurons. Once again, data at the right
                                                introducing forehead-slapping              resolution together with the ability to
                                                insight to a topic that can be as          visually understand a phenomenon
                                                difficult to see as carbon dioxide.        are moving science forward.
                                                Part of his success can be credited to
                                                creating the right perspective. If the     Science has long focused on data-driven
                                                photographs had been taken too close       understanding of phenomenon. It’s
Tom DeGarmo
                                                to or too far away from the glaciers,      called the scientific method. Enterprises
US Technology Consulting Leader                 the insight would have been lost. Data     also use data for the purposes of
thomas.p.degarmo@us.pwc.com                     at the right resolution is the key.        understanding their business outcomes
                                                                                           and, more recently, the effectiveness and
                                                Glaciers are immense, at times more        efficiency of their business processes.
                                                than a mile deep. Amyloid particles        But because running a business is not the
                                                that are the likely cause of Alzheimer’s   same as running a science experiment,


                                                1	 http://www.jamesbalog.com/.             2	Davide Brambilla, et al., “Nanotechnologies for
                                                                                             Alzheimer’s disease: diagnosis, therapy, and safety
                                                                                             issues,” Nanomedicine: Nanotechnology, Biology and
                                                                                             Medicine 7, no. 5 (2011): 521–540.


04	      PwC Technology Forecast 2012 Issue 1
there has long been a divergence             with big data techniques (including           This issue also includes interviews
between analytics as applied to science      NoSQL and in-memory databases),               with executives who are using new
and the methods and processes that           through advanced statistical packages         analytics technologies and with subject
define analytics in the enterprise.          (from the traditional SPSS and SAS            matter experts who have been at the
                                             to open source offerings such as R),          forefront of development in this area:
This difference partly has been a            to analytic visualization tools that put
question of scale and instrumentation.       interactive graphics in the control of        •	 Mike Driscoll of Metamarkets
Even a large science experiment (setting     business unit specialists. This arc is           considers how NoSQL and other
aside the Large Hadron Collider) will        positioning the enterprise to establish          analytics methods are improving
introduce sufficient control around the      a new culture of inquiry, where                  query speed and providing
inquiry of interest to limit the amount of   decisions are driven by analytical               greater freedom to explore.
data collected and analyzed. Any large       precision that rivals scientific insight.
enterprise comprises tens of thousands                                                     •	 Jon Slade of the Financial Times
of moving parts, from individual             The first article, “The third wave of            (FT.com) discusses the benefits
employees to customers to suppliers to       customer analytics,” on page 06 reviews          of cloud analytics for online
products and services. Measuring and         the impact of basic computing trends             ad placement and pricing.
retaining the data on all aspects of an      on emerging analytics technologies.
enterprise over all relevant periods of      Enterprises have an unprecedented             •	 Jock Mackinlay of Tableau Software
time are still extremely challenging,        opportunity to reshape how business              describes the techniques behind
even with today’s IT capacities.             gets done, especially when it comes              interactive visualization and
                                             to customers. The second article,                how more of the workforce can
But targeting the most important             “The art and science of new analytics            become engaged in analytics.
determinants of success in an enterprise     technology,” on page 30 explores the
context for greater instrumentation—         mix of different techniques involved          •	 Ashwin Rangan of Edwards
often customer information—can be and        in making the insights gained from               Lifesciences highlights new
is being done today. And with Moore’s        analytics more useful, relevant, and             ways that medical devices can
Law continuing to pay dividends, this        visible. Some of these techniques are            be instrumented and how new
instrumentation will expand in the           clearly in the data science realm, while         business models can evolve.
future. In the process, and with careful     others are more art than science. The
attention to the appropriate resolution      article, “Natural language processing         Please visit pwc.com/techforecast
of the data being collected, enterprises     and social media intelligence,” on            to find these articles and other issues
that have relied entirely on the art of      page 44 reviews many different                of the Technology Forecast online.
management will increasingly blend in        language analytics techniques in use          If you would like to receive future
the science of advanced analytics. Not       for social media and considers how            issues of this quarterly publication as
surprisingly, the new role emerging in       combinations of these can be most             a PDF attachment, you can sign up at
the enterprise to support these efforts      effective.“How CIOs can build the             pwc.com/techforecast/subscribe.
is often called a “data scientist.”          foundation for a data science culture”
                                             on page 58 considers new analytics as         As always, we welcome your feedback
This issue of the Technology Forecast        an unusually promising opportunity            and your ideas for future research
examines advanced analytics through          for CIOs. In the best case scenario,          and analysis topics to cover.
this lens of increasing instrumentation.     the IT organization can become the
PwC’s view is that the flow of data          go-to group, and the CIO can become
at this new, more complete level of          the true information leader again.
resolution travels in an arc beginning


                                             	                                 Reshaping the workforce with the new analytics	       05
Bahrain World Trade Center
 gets approximately 15% of its
 power from these wind turbines


06	    PwC Technology Forecast 2012 Issue 1
The third wave of
customer analytics
These days, there’s only one way to scale the
analysis of customer-related information to
increase sales and profits—by tapping the data
and human resources of the extended enterprise.
By Alan Morrison and Bo Parker


As director of global online and              strategic issues. The parallel processing,
strategic advertising sales for FT.com,       in-memory technology, the interface,
the online face of the Financial Times,       and many other enhancements led to
Jon Slade says he “looks at the 6 billion     better business results, including double-
ad impressions [that FT.com offers]           digit growth in ad yields and 15 to 20
each year and works out which one             percent accuracy improvement in the
is worth the most for any particular          metrics for its ad impression supply.
client who might buy.” This activity
previously required labor-intensive           The technology trends behind
extraction methods from a multitude           FT.com’s improvements in advertising
of databases and spreadsheets. Slade          operations—more accessible data;
made the process much faster and              faster, less-expensive computing; new
vastly more effective after working           software tools; and improved user
with Metamarkets, a company that              interfaces—are driving a new era in
offers a cloud-based, in-memory               analytics use at large companies around
analytics service called Druid.               the world, in which enterprises make
                                              decisions with a precision comparable
“Before, the sales team would send            to scientific insight. The new analytics
an e-mail to ad operations for an             uses a rigorous scientific method,
inventory forecast, and it could take         including hypothesis formation and
a minimum of eight working hours              testing, with science-oriented statistical
and as long as two business days to           packages and visualization tools. It is
get an answer,” Slade says. Now, with         spawning business unit “data scientists”
a direct interface to the data, it takes      who are replacing the centralized
a mere eight seconds, freeing up the          analytics units of the past. These trends
ad operations team to focus on more           will accelerate, and business leaders


	                                 Reshaping the workforce with the new analytics	     07
Figure 1: How better customer analytics capabilities are affecting enterprises

                                                                               Processing power and memory keep increasing, the
                                                 More computing speed,         ability to leverage massive parallelization continues to
                                               storage, and ability to scale
                                                                               expand in the cloud, and the cost per processed bit
                                                                               keeps falling.
                                                         Leads to

                                                                               Data scientists are seeking larger data sets and iterating
                                               More time and better tools      more to refine their questions and find better answers.
                                                                               Visualization capabilities and more intuitive user
                                                                               interfaces are making it possible for most people in
                                                                               the workforce to do at least basic exploration.

                                                                               Social media data is the most prominent example of the
                                                   More data sources           many large data clouds emerging that can help
                                                                               enterprises understand their customers better. These
                                                                               clouds augment data that business units have direct
                                                                               access to internally now, which is also growing.

                                                                               A core single metric can be a way to rally the entire
                                               More focus on key metrics       organization’s workforce, especially when that core
                                                                               metric is informed by other metrics generated with the
                                                                               help of effective modeling.

                                                                               Whether an enterprise is a gaming or an e-commerce
                                                 Better access to results      company that can instrument its own digital environ-
                                                                               ment, or a smart grid utility that generates, slices, dices,
                                                                               and shares energy consumption analytics for its
                                                                               customers and partners, better analytics are going
                                                         Leads to
                                                                               direct to the customer as well as other stakeholders.
                                                                               And they’re being embedded where users can more
                                                                               easily find them.

                                                                               Visualization and user interface improvements have
                                               A broader culture of inquiry    made it possible to spread ad hoc analytics capabilities
                                                                               across the workplace to every user role. At the same
                                                                               time, data scientists—people who combine a creative
                                                                               ability to generate useful hypotheses with the savvy to
                                                         Leads to              simulate and model a business as it’s changing—have
                                                                               never been in more demand than now.

                                                                               The benefits of a broader culture of inquiry include new
                                                   Less guesswork              opportunities, a workforce that shares a better under-
                                                                               standing of customer needs to be able to capitalize on
                                                   Less bias
                                                                               the opportunities, and reduced risk. Enterprises that
                                                   More awareness              understand the trends described here and capitalize
                                                   Better decisions            on them will be able to change company culture and
                                                                               improve how they attract and retain customers.


                                             who embrace the new analytics will be         in this issue focus on the technologies
                                             able to create cultures of inquiry that       behind these capabilities (see the
                                             lead to better decisions throughout           article, “The art and science of new
                                             their enterprises. (See Figure 1.)            analytics technology,” on page 30)
                                                                                           and identify the main elements of a
                                             This issue of the Technology Forecast         CIO strategic framework for effectively
                                             explores the impact of the new                taking advantage of the full range of
                                             analytics and this culture of inquiry.        analytics capabilities (see the article,
                                             This first article examines the essential     “How CIOs can build the foundation for
                                             ingredients of the new analytics, using       a data science culture,” on page 58).
                                             several examples. The other articles


08	   PwC Technology Forecast 2012 Issue 1
More computing speed,                       decision-making capabilities. “Because
storage, and ability to scale               our technology is optimized for the
Basic computing trends are providing        cloud, we can harness the processing
the momentum for a third wave               power of tens, hundreds, or thousands
in analytics that PwC calls the new         of servers depending on our customers’
analytics. Processing power and             data and their specific needs,” states
memory keep increasing, the ability         Mike Driscoll, CEO of Metamarkets.
to leverage massive parallelization         “We can ask questions over billions
continues to expand in the cloud, and       of rows of data in milliseconds. That
the cost per processed bit keeps falling.   kind of speed combined with data
                                            science and visualization helps business
FT.com benefited from all of these          users understand and consume
trends. Slade needs multiple computer       information on top of big data sets.”
screens on his desk just to keep up. His
job requires a deep understanding of        Decades ago, in the first wave of
the readership and which advertising        analytics, small groups of specialists
suits them best. Ad impressions—            managed computer systems, and even
appearances of ads on web pages—            smaller groups of specialists looked for
are the currency of high-volume media       answers in the data. Businesspeople
industry websites. The impressions          typically needed to ask the specialists
need to be priced based on the reader       to query and analyze the data. As
segments most likely to see them and        enterprise data grew, collected from
click through. Chief executives in          enterprise resource planning (ERP)
France, for example, would be a reader      systems and other sources, IT stored the
segment FT.com would value highly.          more structured data in warehouses so
                                            analysts could assess it in an integrated
“The trail of data that users create        form. When business units began to
when they look at content on a website      ask for reports from collections of data
like ours is huge,” Slade says. “The        relevant to them, data marts were born,
real challenge has been trying to           but IT still controlled all the sources.
understand what information is useful
to us and what we do about it.”             The second wave of analytics saw
                                            variations of centralized top-down data
FT.com’s analytics capabilities were        collection, reporting, and analysis. In
a challenge, too. “The way that data        the 1980s, grassroots decentralization
was held—the demographics data, the         began to counter that trend as the PC
behavior data, the pricing, the available   era ushered in spreadsheets and other
inventory—was across lots of different      methods that quickly gained widespread
databases and spreadsheets,” Slade          use—and often a reputation for misuse.
says. “We needed an almost witchcraft-      Data warehouses and marts continue
like algorithm to provide answers to        to store a wealth of helpful data.
‘How many impressions do I have?’ and
‘How much should I charge?’ It was an       In both waves, the challenge for
extremely labor-intensive process.”         centralized analytics was to respond to
                                            business needs when the business units
FT.com saw a possible solution when         themselves weren’t sure what findings
it first talked to Metamarkets about        they wanted or clues they were seeking.
an initial concept, which evolved as
they collaborated. Using Metamarkets’       The third wave does that by giving
analytics platform, FT.com could            access and tools to those who act
quickly iterate and investigate             on the findings. New analytics taps
numerous questions to improve its           the expertise of the broad business


                                            	                                Reshaping the workforce with the new analytics	   09
Figure 2: The three waves of analytics and the impact of decentralization
     Cloud computing accelerates decentralization of the analytics function.
                                                                                                                                      Cloud co-creation


                                                                                          Self-service                                             Data
                                                                                                                                                  in the
Trend toward decentralization


                                                                                                                                                  cloud
                                  Central IT generated                                                   C
                                                                                                  B
                                                                                          A
                                                                                      1
                                                                                      2
                                                                                      3
                                                                                      4                                           The trend toward
                                                                                      5                                           decentralization continues as
                                                                                      6
                                                                                      7
                                                                                                                                  business units, customers, and
                                                                                                                                  other stakeholders collaborate
                                                                                                                                  to diagnose and work on
                                                                                  PCs and then the web and an                     problems of mutual interest in
                                                                                  increasingly interconnected                     the cloud.
                                                                                  business ecosystem have provided
                                Analytics functions in enterprises                more responsive alternatives.
                                were all centralized in the beginning,
                                but not always responsive to
                                business needs.


                                                                         ecosystem to address the lack of            More time and better tools
                                                                         responsiveness from central analytics       Big data techniques—including NoSQL1
                                                                         units. (See Figure 2.) Speed, storage,      and in-memory databases, advanced
                                                                         and scale improvements, with the            statistical packages (from SPSS and
                                                                         help of cloud co-creation, have             SAS to open source offerings such as R),
                                                                         made this decentralized analytics           visualization tools that put interactive
                                                                         possible. The decentralized analytics       graphics in the control of business
                                                                         innovation has evolved faster than          unit specialists, and more intuitive
                                                                         the centralized variety, and PwC            user interfaces—are crucial to the new
                                                                         expects this trend to continue.             analytics. They make it possible for
                                                                                                                     many people in the workforce to do
                                                                         “In the middle of looking at some data,     some basic exploration. They allow
                                                                         you can change your mind about what         business unit data scientists to use larger
                                                                         question you’re asking. You need to be      data sets and to iterate more as they test
                                                                         able to head toward that new question       hypotheses, refine questions, and find
                                                                         on the fly,” says Jock Mackinlay,           better answers to business problems.
                                                                         director of visual analysis at Tableau
                                                                         Software, one of the vendors of the new     Data scientists are nonspecialists
                                                                         visualization front ends for analytics.     who follow a scientific method of
                                                                         “No automated system is going to keep       iterative and recursive analysis with a
                                                                         up with the stream of human thought.”       practical result in mind. Even without
                                                                                                                     formal training, some business users
                                                                                                                     in finance, marketing, operations,
                                                                                                                     human capital, or other departments


                                                                                                                     1	 See “Making sense of Big Data,” Technology Forecast
                                                                                                                        2010, Issue 3, http://www.pwc.com/us/en/technology-
                                                                                                                        forecast/2010/issue3/index.jhtml, for more information
                                                                                                                        on Hadoop and other NoSQL databases.


     10	                         PwC Technology Forecast 2012 Issue 1
Case study


    How the E. & J. Gallo Winery
    matches outbound shipments
    to retail customers
    E. & J. Gallo Winery, one of the world’s    Years ago, Gallo’s senior management
    largest producers and distributors of       understood that customer analytics
    wines, recognizes the need to precisely     would be increasingly important. The
    identify its customers for two reasons:     company’s most recent investments are
    some local and state regulations mandate    extensions of what it wanted to do 25
    restrictions on alcohol distribution,       years ago but was limited by availability
    and marketing brands to individuals         of data and tools. Since 1998, Gallo
    requires knowing customer preferences.      IT has been working on advanced
                                                data warehouses, analytics tools, and
    “The majority of all wine is consumed       visualization. Gallo was an early adopter
    within four hours and five miles            of visualization tools and created IT
    of being purchased, so this makes           subgroups within brand marketing to
    it critical that we know which              leverage the information gathered.
    products need to be marketed and
    distributed by specific destination,”       The success of these early efforts has
    says Kent Kushar, Gallo’s CIO.              spurred Gallo to invest even more
                                                in analytics. “We went from step
    Gallo knows exactly how its products        function growth to logarithmic growth
    move through distributors, but              of analytics; we recently reinvested
    tracking beyond them is less clear.         heavily in new appliances, a new
    Some distributors are state liquor          system architecture, new ETL [extract,
    control boards, which supply the            transform, and load] tools, and new
    wine products to retail outlets and         ways our SQL calls were written; and
    other end customers. Some sales are         we began to coalesce unstructured
    through military post exchanges, and        data with our traditional structured
    in some cases there are restrictions and    consumer data,” says Kushar.
    regulations because they are offshore.
                                                “Recognizing the power of these
    Gallo has a large compliance                capabilities has resulted in our taking a
    department to help it manage the            10-year horizon approach to analytics,”
    regulatory environment in which Gallo       he adds. “Our successes with analytics
    products are sold, but Gallo wants          to date have changed the way we
    to learn more about the customers           think about and use analytics.”
    who eventually buy and consume
    those products, and to learn from           The result is that Gallo no longer relies
    them information to help create             on a single instance database, but has
    new products that localize tastes.          created several large purpose-specific
                                                databases. “We have also created
    Gallo sometimes cannot obtain point of      new service level agreements for our
    sales data from retailers to complete the   internal customers that give them
    match of what goes out to what is sold.     faster access and more timely analytics
    Syndicated data, from sources such as       and reporting,” Kushar says. Internal
    Information Resources, Inc. (IRI), serves   customers for Gallo IT include supply
    as the matching link between distribution   chain, sales, finance, distribution,
    and actual consumption. This results        and the web presence design team.
    in the accumulation of more than 1GB
    of data each day as source information
    for compliance and marketing.


	                                   Reshaping the workforce with the new analytics	         11
already have the skills, experience,         Analytics tools were once the province
                                             and mind-set to be data scientists.          of experts. They weren’t intuitive,
                                             Others can be trained. The teaching of       and they took a long time to learn.
                                             the discipline is an obvious new focus       Those who were able to use them
                                             for the CIO. (See the article,”How           tended to have deep backgrounds
                                             CIOs can build the foundation for a          in mathematics, statistical analysis,
                                             data science culture” on page 58.)           or some scientific discipline. Only
                                                                                          companies with dedicated teams of
                                             Visualization tools have been especially     specialists could make use of these
                                             useful for Ingram Micro, a technology        tools. Over time, academia and the
                                             products distributor, which uses them        business software community have
                                             to choose optimal warehouse locations        collaborated to make analytics tools
                                             around the globe. Warehouse location is      more user-friendly and more accessible
                                             a strategic decision, and Ingram Micro       to people who aren’t steeped in the
                                             can run many what-if scenarios before it     mathematical expressions needed to
                                             decides. One business result is shorter-     query and get good answers from data.
                                             term warehouse leases that give Ingram
                                             Micro more flexibility as supply chain       Products from QlikTech, Tableau
                                             requirements shift due to cost and time.     Software, and others immerse users in
                                                                                          fully graphical environments because
                                             “Ensuring we are at the efficient frontier   most people gain understanding more
                                             for our distribution is essential in this    quickly from visual displays of numbers
                                             fast-paced and tight-margin business,”       rather than from tables. “We allow
Over time, academia                          says Jonathan Chihorek, vice president       users to get quickly to a graphical view
and the business                             of global supply chain systems at Ingram     of the data,” says Tableau Software’s
                                             Micro. “Because of the complexity,           Mackinlay. “To begin with, they’re
software community                           size, and cost consequences of these         using drag and drop for the fields
have collaborated                            warehouse location decisions, we run         in the various blended data sources
                                             extensive models of where best to            they’re working with. The software
to make analytics                            locate our distribution centers at least     interprets the drag and drop as algebraic
tools more user-                             once a year, and often twice a year.”        expressions, and that gets compiled
                                                                                          into a query database. But users don’t
friendly and more                            Modeling has become easier thanks            need to know all that. They just need
accessible to people                         to mixed integer, linear programming         to know that they suddenly get to
                                             optimization tools that crunch large         see their data in a visual form.”
who aren’t steeped                           and diverse data sets encompassing
in the mathematical                          many factors. “A major improvement           Tableau Software itself is a prime
                                             came from the use of fast 64-bit             example of how these tools are
expressions needed to                        processors and solid-state drives that       changing the enterprise. “Inside
query and get good                           reduced scenario run times from              Tableau we use Tableau everywhere,
                                             six to eight hours down to a fraction        from the receptionist who’s keeping
answers from data.                           of that,” Chihorek says. “Another            track of conference room utilization
                                             breakthrough for us has been improved        to the salespeople who are monitoring
                                             visualization tools, such as spider and      their pipelines,” Mackinlay says.
                                             bathtub diagrams that help our analysts
                                             choose the efficient frontier curve          These tools are also enabling
                                             from a complex array of data sets that       more finance, marketing, and
                                             otherwise look like lists of numbers.”       operational executives to become
                                                                                          data scientists, because they help
                                                                                          them navigate the data thickets.


12	   PwC Technology Forecast 2012 Issue 1
Figure 3: Improving the signal-to-noise ratio in social media monitoring

Social media is a high-noise environment          But there are ways to reduce the noise                  And focus on significant conversations

 work boots                                                                                               Illuminating and helpful dialogue
       leather                                                                                 heel                                                 heel
                 boots                                                             color fashion                                        color fashion
                         construction safety                                        style                                                style
                               rugged                              leather                   cool                          leather                cool


                                                           shoes                                    toe            shoes                                 toe
                                                                           boots                                                boots
                                                           price                    safety                         price                 safety
                                                                   store                    value                       store                    value
                                                                                      rugged                                               rugged
                                                                           wear                                                  wear

                                                                                   construction                                          construction

An initial set of relevant terms is used to cut   With proper guidance, machines can do                   Visualization tools present “lexical maps” to
back on the noise dramatically, a first step      millions of correlations, clustering words by           help the enterprise unearth instances of
toward uncovering useful conversations.           context and meaning.                                    useful customer dialog.


Source: Nexalogy Environics and PwC, 2012


More data sources                                 of shoes and boots. The manufacturer
The huge quantities of data in the                was mining conventional business data
cloud and the availability of enormous            for insights about brand status, but
low-cost processing power can help                it had not conducted any significant
enterprises analyze various business              analysis of social media conversations
problems—including efforts to                     about its products, according to Josée
understand customers better, especially           Latendresse, who runs Latendresse
through social media. These external              Groupe Conseil, which was advising
clouds augment data that business units           the company on its repositioning
already have direct access to internally.         effort. “We were neglecting the
                                                  wealth of information that we could
Ingram Micro uses large, diverse data             find via social media,” she says.
sets for warehouse location modeling,
Chihorek says. Among them: size,                  To expand the analysis, Latendresse
weight, and other physical attributes             brought in technology and expertise
of products; geographic patterns of               from Nexalogy Environics, a company
consumers and anticipated demand                  that analyzes the interest graph implied
for product categories; inbound and               in online conversations—that is, the
outbound transportation hubs, lead                connections between people, places, and
times, and costs; warehouse lease and             things. (See “Transforming collaboration
operating costs, including utilities;             with social tools,” Technology Forecast
and labor costs—to name a few.                    2011, Issue 3, for more on interest
                                                  graphs.) Nexalogy Environics studied
Social media can also augment                     millions of correlations in the interest
internal data for enterprises willing to          graph and selected fewer than 1,000
learn how to use it. Some companies               relevant conversations from 90,000 that
ignore social media because so much               mentioned the products. In the process,
of the conversation seems trivial,                Nexalogy Environics substantially
but they miss opportunities.                      increased the “signal” and reduced
                                                  the “noise” in the social media about
Consider a North American apparel                 the manufacturer. (See Figure 3.)
maker that was repositioning a brand


                                                  	                                          Reshaping the workforce with the new analytics	               13
Figure 4: Adding social media analysis techniques
                                             suggests other changes to the BI process
                                             Here’s one example of how the larger business intelligence (BI) process might
                                             Adding SMA techniques
                                             change with the addition of social media analysis.

                                             One apparel maker started with its conventional BI analysis cycle.
                                             Conventional BI techniques                         1               1.   Develop questions
                                             used by an apparel                                                 2.   Collect data
                                             company client ignored                 5                   2       3.   Clean data
                                             social media and required
                                             lots of data cleansing. The                                        4.   Analyze data
                                             results often lacked insight.                                      5.   Present results
                                                                                            4       3

                                             Then it added social media and targeted focus groups to the mix.
                                             The company’s revised approach                                     1. Develop questions
                                                                                                1
                                             added several elements such as                                     2. Refine conventional BI
                                             social media analysis and              6                   2          - Collect data
                                             expanded others, but kept the                                         - Clean data
                                             focus group phase near the                                            - Analyze data
                                             beginning of the cycle. The                                        3. Conduct focus groups
                                             company was able to mine new           5                   3
                                                                                                                   (retailers and end users)
                                             insights from social media
                                                                                                4               4. Select conversations
                                             conversations about market
                                             segments that hadn’t occurred to                                   5. Analyze social media
                                             the company to target before.                                      6. Present results

                                             Then it tuned the process for maximum impact.
                                             The company’s current                                              1. Develop questions
                                                                                                1
                                             approach places focus                                              2. Refine conventional BI
                                             groups near the end, where                 7               2          - Collect data
                                             they can inform new                                                   - Clean data
                                             questions more directly. This                                         - Analyze data
                                             approach also stresses how         6                           3
                                                                                                                3. Select conversations
                                             the results get presented to
                                                                                                                4. Analyze social media
                                             executive leadership.                          5       4
                                                                                                                5. Present results
                                                                                                                6. Tailor results to audience
                                                                                                                7. Conduct focus groups
                                                New step added                                                     (retailers and end users)


                                             What Nexalogy Environics discovered                generally. “The key step,” she says,
                                             suggested the next step for the brand              “is to define the questions that you
                                             repositioning. “The company wasn’t                 want to have answered. You will
                                             marketing to people who were blogging              definitely be surprised, because
                                             about its stuff,” says Claude Théoret,             the system will reveal customer
                                             president of Nexalogy Environics.                  attitudes you didn’t anticipate.”
                                             The shoes and boots were designed
                                             for specific industrial purposes, but              Following the social media analysis
                                             the blogging influencers noted their               (SMA), Latendresse saw the retailer
                                             fashion appeal and their utility when              and its user focus groups in a new
                                             riding off-road on all-terrain vehicles            light. The analysis “had more complete
                                             and in other recreational settings.                results than the focus groups did,” she
                                             “That’s a whole market segment                     says. “You could use the focus groups
                                             the company hadn’t discovered.”                    afterward to validate the information
                                                                                                evident in the SMA.” The revised
                                             Latendresse used the analysis to                   intelligence development process
                                             help the company expand and                        now places focus groups closer to the
                                             refine its intelligence process more               end of the cycle. (See Figure 4.)


14	   PwC Technology Forecast 2012 Issue 1
Figure 5: The benefits of big data analytics: A carrier example
By analyzing billions of call records, carriers are able to obtain early warning of groups of subscribers likely to switch services.
Here is how it works:

 1 Carrier notes big peaks          2 Dataspora brought in to                        3 The initial analysis debunks some               Carrier’s
       in churn.*                      analyze all call records.                         myths and raises new questions            prime hypothesis
                                                                                         discussed with the carrier.                   disproved

                                                                                        Dropped calls/poor service?            Merged to family plan?
                                             14 billion                                 Preferred phone unavailable?           Offer by competitor?
                                         call data records
                                              analyzed                                  Financial trouble?                     Dropped dead?
                                                                                        Incarcerated?                          Friend dropped recently!


                                                                                                           Pattern spotted: Those with a
                                                                                                           relationship to a dropped customer
   $                     $
        DON’T GO!                                                                                          (calls lasting longer than two minutes,
       We’ll miss you!                                                                                     more than twice in the previous
   $                     $                                                                                 month) are 500% more likely to drop.


 6 Marketers begin                  5 Data group deploys a call                      4 Further analysis confirms that friends influence
       campaigns that target           record monitoring system that                     other friends’ propensity to switch services.
       at-risk subscriber groups       issues an alert that identifies
       with special offers.            at-risk subscribers.                        * Churn: the proportion of contractual subscribers who leave during
                                                                                     a given time period


Source: Metamarkets and PwC, 2012


Third parties such as Nexalogy                   A telecom provider illustrates the
Environics are among the first to                point. The carrier was concerned
take advantage of cloud analytics.               about big peaks in churn—customers
Enterprises like the apparel maker may           moving to another carrier—but hadn’t
have good data collection methods                methodically mined the whole range of
but have overlooked opportunities to             its call detail records to understand the
mine data in the cloud, especially social        issue. Big data analysis methods made
media. As cloud capabilities evolve,             a large-scale, iterative analysis possible.
enterprises are learning to conduct more         The carrier partnered with Dataspora, a
iteration, to question more assumptions,         consulting firm run by Driscoll before he
and to discover what else they can               founded Metamarkets. (See Figure 5.)2
learn from data they already have.
                                                 “We analyzed 14 billion call data
More focus on key metrics                        records,” Driscoll recalls, “and built a
One way to start with new analytics is           high-frequency call graph of customers
to rally the workforce around a single           who were calling each other. We found
core metric, especially when that core           that if two subscribers who were friends
metric is informed by other metrics              spoke more than once for more than
generated with the help of effective             two minutes in a given month and the
modeling. The core metric and the                first subscriber cancelled their contract
model that helps everyone understand             in October, then the second subscriber
it can steep the culture in the language,        became 500 percent more likely to
methods, and tools around the                    cancel their contract in November.”
process of obtaining that goal.
                                                 2	 For more best practices on methods to address churn,
                                                    see Curing customer churn, PwC white paper, http://
                                                    www.pwc.com/us/en/increasing-it-effectiveness/
                                                    publications/curing-customer-churn.jhtml, accessed
                                                    April 5, 2012.


                                                 	                                           Reshaping the workforce with the new analytics	              15
Data mining on that scale required           that policymakers are encouraging
                                             distributed computing across hundreds        more third-party access to the usage
                                             of servers and repeated hypothesis           data from the meters. “One of the big
                                             testing. The carrier assumed that            policy pushes at the regulatory level
                                             dropped calls might be one reason            is to create platforms where third
                                             why clusters of subscribers were             parties can—assuming all privacy
                                             cancelling contracts, but the Dataspora      guidelines are met—access this data
                                             analysis disproved that notion,              to build business models they can
                                             finding no correlation between               drive into the marketplace,” says
                                             dropped calls and cancellation.              Zambrano. “Grid management and
                                                                                          energy management will be supplied
                                             “There were a few steps we took. One         by both the utilities and third parties.”
                                             was to get access to all the data and next
                                             do some engineering to build a social        Zambrano emphasizes the importance
                                             graph and other features that might          of customer participation to the energy
                                             be meaningful, but we also disproved         efficiency push. The issue he raises is
                                             some other hypotheses,” Driscoll says.       the extent to which blended operational
                                             Watching what people actually did            and customer data can benefit the
                                             confirmed that circles of friends were       larger ecosystem, by involving millions
                                             cancelling in waves, which led to the        of residential and business customers.
                                             peaks in churn. Intense focus on the key     “Through the power of information
                                             metric illustrated to the carrier and its    and presentation, you can start to show
                                             workforce the power of new analytics.        customers different ways that they can
“Through the power                                                                        become stewards of energy,” he says.
 of information and                          Better access to results
                                             The more pervasive the online                As a highly regulated business, the
 presentation, you can                       environment, the more common the             utility industry has many obstacles to
 start to show customers                     sharing of information becomes.              overcome to get to the point where
                                             Whether an enterprise is a gaming            smart grids begin to reach their
 different ways that they                    or an e-commerce company that                potential, but the vision is clear:
 can become stewards                         can instrument its own digital
                                             environment, or a smart grid utility         •	 Show customers a few key
 of energy.”                                 that generates, slices, dices, and              metrics and seasonal trends in
                                             shares energy consumption analytics             an easy-to-understand form.
 —Saul Zambrano, PG&E                        for its customers and partners, better
                                             analytics are going direct to the            •	 Provide a means of improving those
                                             customer as well as other stakeholders.         metrics with a deeper dive into where
                                             And they’re being embedded where                they’re spending the most on energy.
                                             users can more easily find them.
                                                                                          •	 Allow them an opportunity to
                                             For example, energy utilities preparing         benchmark their spending by
                                             for the smart grid are starting to              providing comparison data.
                                             invite the help of customers by
                                             putting better data and more broadly         This new kind of data sharing could be a
                                             shared operational and customer              chance to stimulate an energy efficiency
                                             analytics at the center of a co-created      competition that’s never existed between
                                             energy efficiency collaboration.             homeowners and between business
                                                                                          property owners. It is also an example of
                                             Saul Zambrano, senior director of            how broadening access to new analytics
                                             customer energy solutions at Pacific         can help create a culture of inquiry
                                             Gas & Electric (PG&E), an early              throughout the extended enterprise.
                                             installer of smart meters, points out


16	   PwC Technology Forecast 2012 Issue 1
Case study


    Smart shelving: How the
    E. & J. Gallo Winery analytics
    team helps its retail partners
    Some of the data in the E. & J. Gallo         what the data reveal (for underlying
    Winery information architecture is for        trends of specific brands by location),
    production and quality control, not just      or to conduct R&D in a test market,
    customer analytics. More recently, Gallo      or to listen to the web platforms.
    has adopted complex event processing
    methods on the source information,            These insights inform a specific design
    so it can look at successes and failures      for “smart shelving,” which is the
    early in its manufacturing execution          placement of products by geography
    system, sales order management,               and location within the store. Gallo
    and the accounting system that                offers a virtual wine shelf design
    front ends the general ledger.                schematic to retailers, which helps
                                                  the retailer design the exact details
    Information and information flow are          of how wine will be displayed—by
    the lifeblood of Gallo, but it is clearly     brand, by type, and by price. Gallo’s
    a team effort to make the best use            wine shelf design schematic will help
    of the information. In this team:             the retailer optimize sales, not just for
                                                  Gallo brands but for all wine offerings.
    •	 Supply chain looks at the flows.
                                                  Before Gallo’s wine shelf design
    •	 	 ales determines what information is
       S                                          schematic, wine sales were not a major
       needed to match supply and demand.         source of retail profits for grocery stores,
                                                  but now they are the first or second
    •	 	 &D undertakes the heavy-duty
       R                                          highest profit generators in those stores.
       customer data integration, and it          “Because of information models such as
       designs pilots for brand consumption.      the wine shelf design schematic, Gallo
                                                  has been the wine category captain for
    •	 	 T provides the data and consulting
       I                                          some grocery stores for 11 years in a row
       on how to use the information.             so far,” says Kent Kushar, CIO of Gallo.

    Mining the information for patterns and
    insights in specific situations requires
    the team. A key goal is what Gallo refers
    to as demand sensing—to determine
    the stimulus that creates demand by
    brand and by product. This is not just
    a computer task, but is heavily based
    on human intervention to determine


	                                     Reshaping the workforce with the new analytics	         17
Conclusion: A broader                      have found. The return on investment
                                             culture of inquiry                         for finding a new market segment can
                                             This article has explored how              be the difference between long-term
                                             enterprises are embracing the big data,    viability and stagnation or worse.
                                             tools, and science of new analytics
                                             along a path that can lead them to a       Tackling the new kinds of data being
                                             broader culture of inquiry, in which       generated is not the only analytics task
                                             improved visualization and user            ahead. Like the technology distributor,
                                             interfaces make it possible to spread ad   enterprises in all industries have
                                             hoc analytics capabilities to every user   concerns about scaling the analytics
                                             role. This culture of inquiry appears      for data they’re accustomed to having
                                             likely to become the age of the data       and now have more. Publishers can
                                             scientists—workers who combine             serve readers better and optimize ad
                                             a creative ability to generate useful      sales revenue by tuning their engines
                                             hypotheses with the savvy to simulate      for timing, pricing, and pinpointing
                                             and model a business as it’s changing.     ad campaigns. Telecom carriers can
                                                                                        mine all customer data more effectively
                                             It’s logical that utilities are            to be able to reduce the expense
                                             instrumenting their environments as        of churn and improve margins.
                                             a step toward smart grids. The data
                                             they’re generating can be overwhelming,    What all of these examples suggest is a
                                             but that data will also enable the         greater need to immerse the extended
                                             analytics needed to reduce energy          workforce—employees, partners, and
                                             consumption to meet efficiency and         customers—in the data and analytical
                                             environmental goals. It’s also logical     methods they need. Without a view
                                             that enterprises are starting to hunt      into everyday customer behavior,
                                             for more effective ways to filter social   there’s no leverage for employees to
                                             media conversations, as apparel makers     influence company direction when


                                             One way to raise awareness about the
                                             power of new analytics comes from
                                             articulating the results in a visual form
                                             that everyone can understand. Another
                                             is to enable the broader workforce to
                                             work with the data themselves and to ask
                                             them to develop and share the results of
                                             their own analyses.


18	   PwC Technology Forecast 2012 Issue 1
Table 1: Key elements of a culture of inquiry

 Element                      How it is manifested within an organization                   Value to the organization

 Executive support            Senior executives asking for data to support any              Set the tone for the rest of the organization with
                              opinion or proposed action and using interactive              examples
                              visualization tools themselves

 Data availability            Cloud architecture (whether private or public) and            Find good ideas from any source
                              semantically rich data integration methods

 Analytics tools              Higher-profile data scientists embedded in the                Identify hidden opportunities
                              business units

 Interactive visualization    Visual user interfaces and the right tool for the right       Encourage a culture of inquiry
                              person

 Training                     Power users in individual departments                         Spread the word and highlight the most effective and
                                                                                            user-friendly techniques

 Sharing                      Internal portals or other collaborative environments          Prove that the culture of inquiry is real
                              to publish and discuss inquiries and results


markets shift and there are no insights       would be to designate, train, and
into improving customer satisfaction.         compensate the more enthusiastic users
Computing speed, storage, and scale           in all units—finance, product groups,
make those insights possible, and it is       supply chain, human resources, and
up to management to take advantage            so forth—as data scientists. Table 1
of what is becoming a co-creative             presents examples of approaches to
work environment in all industries—           fostering a culture of inquiry.
to create a culture of inquiry.
                                              The arc of all the trends explored
Of course, managing culture change is         in this article is leading enterprises
a much bigger challenge than simply           toward establishing these cultures
rolling out more powerful analytics           of inquiry, in which decisions can be
software. It is best to have several          informed by an analytical precision
starting points and to continue to find       comparable to scientific insight. New
ways to emphasize the value of analytics      market opportunities, an energized
in new scenarios. One way to raise            workforce with a stake in helping to
awareness about the power of new              achieve a better understanding of
analytics comes from articulating the         customer needs, and reduced risk are
results in a visual form that everyone        just some of the benefits of a culture of
can understand. Another is to enable          inquiry. Enterprises that understand
the broader workforce to work with            the trends described here and capitalize
the data themselves and to ask them to        on them will be able to improve how
develop and share the results of their        they attract and retain customers.
own analyses. Still another approach


                                              	                                         Reshaping the workforce with the new analytics	          19
PwC: What’s your background,


The nature of cloud-
                                                                                      and how did you end up running
                                                                                      a data science startup?
                                                                                      MD: I came to Silicon Valley after

based data science
                                                                                      studying computer science and biology
                                                                                      for five years, and trying to reverse
                                                                                      engineer the genome network for
Mike Driscoll of Metamarkets talks about                                              uranium-breathing bacteria. That
                                                                                      was my thesis work in grad school.
the analytics challenges and opportunities                                            There was lots of modeling and causal
that businesses moving to the cloud face.                                             inference. If you were to knock this gene
                                                                                      out, could you increase the uptake of the
                                                                                      reduction of uranium from a soluble to
Interview conducted by Alan Morrison and Bo Parker
                                                                                      an insoluble state? I was trying all these
                                                                                      simulations and testing with the bugs
                                                                                      to see whether you could achieve that.

                                                                                      PwC: You wanted to clean up
                                                                                      radiation leaks at nuclear plants?
                                               Mike Driscoll                          MD: Yes. The Department of
                                               Mike Driscoll is CEO of Metamarkets,   Energy funded the research work
                                               a cloud-based analytics company he     I did. Then I came out here and I
                                               co-founded in San Francisco in 2010.   gave up on the idea of building a
                                                                                      biotech company, because I didn’t
                                                                                      think there was enough commercial
                                                                                      viability there from what I’d seen.

                                                                                      I did think I could take this toolkit I’d
                                                                                      developed and apply it to all these other
                                                                                      businesses that have data. That was the
                                                                                      genesis of the consultancy Dataspora.
                                                                                      As we started working with companies
                                                                                      at Dataspora, we found this huge gap
                                                                                      between what was possible and what
                                                                                      companies were actually doing.

                                                                                      Right now the real shift is that
                                                                                      companies are moving from this very
                                                                                      high-latency-course era of reporting
                                                                                      into one where they start to have lower
                                                                                      latency, finer granularity, and better


20	     PwC Technology Forecast 2012 Issue 1
Some companies don’t have all the capabilities                                       Critical
                                                                                    business
they need to create data science value.                                             questions
Companies need these three capabilities
to excel in creating data science value.                                                                                Value and
                                                                                                                        change
                                                                             Good            Data
                                                                             data           science


visibility into their operations. They        expensive relational database. There          PwC: How are companies that do
realize the problem with being walking        needs to be different temperatures            have data science groups meeting
amnesiacs, knowing what happened              of data, and companies need to                the challenge? Take the example
to their customers in the last 30 days        put different values on the data—             of an orphan drug that is proven
and then forgetting every 30 days.            whether it’s hot or cold, whether it’s        to be safe but isn’t particularly
                                              active. Most companies have only one          effective for the application it
Most businesses are just now                  temperature: they either keep it hot in       was designed for. Data scientists
figuring out that they have this              a database, or they don’t keep it at all.     won’t know enough about a broad
wealth of information about their                                                           range of potential biological
customers and how their customers             PwC: So they could just                       systems for which that drug might
interact with their products.                 keep it in the cloud?                         be applicable, but the people
                                              MD: Absolutely. We’re starting to             who do have that knowledge
PwC: On its own, the new                      see the emergence of cloud-based              don’t know the first thing about
availability of data creates                  databases where you say, “I don’t             data science. How do you bring
demand for analytics.                         need to maintain my own database              those two groups together?
MD: Yes. The absolute number-one              on the premises. I can just rent some         MD: My data science Venn diagram
thing driving the current focus in            boxes in the cloud and they can               helps illustrate how you bring those
analytics is the increase in data. What’s     persist our customer data that way.”          groups together. The diagram has three
different now from what happened 30                                                         circles. [See above.] The first circle is
years ago is that analytics is the province   Metamarkets is trying to deliver              data science. Data scientists are good
of people who have data to crunch.            DaaS—data science as a service. If a          at this. They can take data strings,
                                              company doesn’t have analytics as a           perform processing, and transform
What’s causing the data growth? I’ve          core competency, it can use a service         them into data structures. They have
called it the attack of the exponentials—     like ours instead. There’s no reason for      great modeling skills, so they can use
the exponential decline in the cost of        companies to be doing a lot of tasks          something like R or SAS and start to
compute, storage, and bandwidth,              that they are doing in-house. You need        build a hypothesis that, for example,
and the exponential increase in the           to pick and choose your battles.              if a metric is three standard deviations
number of nodes on the Internet.                                                            above or below the specific threshold
Suddenly the economics of computing           We will see a lot of IT functions             then someone may be more likely to
over data has shifted so that almost all      being delivered as cloud-based                cancel their membership. And data
the data that businesses generate is          services. And now inside of those             scientists are great at visualization.
worth keeping around for its analysis.        cloud-based services, you often
                                              will find an open source stack.               But companies that have the tools and
PwC: And yet, companies are                                                                 expertise may not be focused on a
still throwing data away.                     Here at Metamarkets, we’ve drawn              critical business question. A company
MD: So many businesses keep only              heavily on open source. We have               is trying to build what it calls the
60 days’ worth of data. The storage           Hadoop on the bottom of our stack,            technology genome. If you give them
cost is so minimal! Why would you             and then at the next layer we have our        a list of parts in the iPhone, they can
throw it away? This is the shift at the       own in-memory distributed database.           look and see how all those different
big data layer; when these companies          We’re running on Amazon Web Services          parts are related to other parts in
store data, they store it in a very           and have hundreds of nodes there.             camcorders and laptops. They built
                                                                                            this amazingly intricate graph of the


                                              	                                 Reshaping the workforce with the new analytics	       21
“[Companies] realize the problem with being
 walking amnesiacs, knowing what happened
 to their customers in the last 30 days and then
 forgetting every 30 days.”


actual makeup. They’ve collected large          shopping carts?” Well, the company           PwC: In many cases, the data
amounts of data. They have PhDs from            has 600 million shopping cart flows          is going to be fresh enough,
Caltech; they have Rhodes scholars;             that it has collected in the last six        because the nature of the business
they have really brilliant people.              years. So the company says, “All right,      doesn’t change that fast.
But they don’t have any real critical           data science group, build a sequential       MD: Real time actually means two
business questions, like “How is this           model that shows what we need to             things. The first thing has to do with
going to make me more money?”                   do to intervene with people who have         the freshness of data. The second
                                                abandoned their shopping carts and           has to do with the query speed.
The second circle in the diagram is             get them to complete the purchase.”
critical business questions. Some                                                            By query speed, I mean that if you have
companies have only the critical business       PwC: The questioning nature of               a question, how long it takes to answer
questions, and many enterprises fall            business—the culture of inquiry—             a question such as, “What were your top
in this category. For instance, the CEO         seems important here. Some                   products in Malaysia around Ramadan?”
says, “We just released a new product           who lack the critical business
and no one is buying it. Why?”                  questions don’t ask enough                   PwC: There’s a third one also,
                                                questions to begin with.                     which is the speed to knowledge.
The third circle is good data. A beverage       MD: It’s interesting—a lot of businesses     The data could be staring you
company or a retailer has lots of POS           have this focus on real-time data,           in the face, and you could have
[point of sale] data, but it may not have       and yet it’s not helping them get            incredibly insightful things in
the tools or expertise to dig in and figure     answers to critical business questions.      the data, but you’re sitting there
out fast enough where a drink was               Some companies have invested a               with your eyes saying, “I don’t
selling and what demographics it was            lot in getting real-time monitoring          know what the message is here.”
selling to, so that the company can react.      of their systems, and it’s expensive.        MD: That’s right. This is about how fast
                                                It’s harder to do and more fragile.          can you pull the data and how fast can
On the other hand, sometimes some                                                            you actually develop an insight from it.
web companies or small companies                A friend of mine worked on the data
have critical business questions and            team at a web company. That company          For learning about things quickly
they have the tools and expertise.              developed, with a real effort, a real-time   enough after they happen, query speed
But because they have no customers,             log monitoring framework where they          is really important. This becomes
they don’t have any data.                       can see how many people are logging          a challenge at scale. One of the
                                                in every second with 15-second latency       problems in the big data space is that
PwC: Without the data, they                     across the ecosystem. It was hard to keep    databases used to be fast. You used
need to do a simulation.                        up and it was fragile. It broke down and     to be able to ask a question of your
MD: Right. The intersection in the Venn         they kept bringing it up, and then they      inventory and you’d get an answer
diagram is where value is created. When         realized that they take very few business    in seconds. SQL was quick when the
you think of an e-commerce company              actions in real time. So why devote          scale wasn’t large; you could have an
that says, “How do we upsell people             all this effort to a real-time system?       interactive dialogue with your data.
and reduce the number of abandoned


22	      PwC Technology Forecast 2012 Issue 1
But now, because we’re collecting          appliance. We solve the performance
millions and millions of events a          problem in the cloud. Our mantra is
day, data platforms have seen real         visibility and performance at scale.
performance degradation. Lagging
performance has led to degradation         Data in the cloud liberates companies
of insights. Companies literally           from some of these physical box
are drowning in their data.                confines and constraints. That means
                                           that your data can be used as inputs to
In the 1970s, when the intelligence        other types of services. Being a cloud
agencies first got reconnaissance          service really reduces friction. The
satellites, there was this proliferation   coefficient of friction around data has
in the amount of photographic data         for a long time been high, and I think
they had, and they realized that it        we’re seeing that start to drop. Not
paralyzed their decision making. So to     just the scale or amount of data being
this point of speed, I think there are a   collected, but the ease with which data
number of dimensions here. Typically       can interoperate with different services,
when things get big, they get slow.        both inside your company and out.

PwC: Isn’t that the problem                I believe that’s where tremendous
the new in-memory database                 value lies.
appliances are intended to solve?
MD: Yes. Our Druid engine on the back
end is directly competitive with those
proprietary appliances. The biggest
difference between those appliances
and what we provide is that we’re cloud
                                               “Being a cloud service really
based and are available on Amazon.              reduces friction. The coefficient
If your data and operations are in
                                                of friction around data has for a
the cloud, it does not make sense               long time been high, and I think
to have your analytics on some                 we’re seeing that start to drop.”


                                           	                                Reshaping the workforce with the new analytics	   23
PwC: What is your role at the


Online advertising
                                                                                           FT [Financial Times], and
                                                                                           how did you get into it?
                                                                                           JS: I’m the global advertising sales

analytics in the cloud
                                                                                           director for all our digital products.
                                                                                           I’ve been in advertising sales and in
                                                                                           publishing for about 15 years and at
Jon Slade of the Financial Times describes                                                 the FT for about 7 years. And about
                                                                                           three and a half years ago I took this
the 123-year-old business publication’s                                                    role—after a quick diversion into
advanced approach to its online ad sales.                                                  landscape gardening, which really gave
                                                                                           me the idea that digging holes for a
                                                                                           living was not what I wanted to do.
Interview conducted by Alan Morrison, Bo Parker, and Bud Mathaisel
                                                                                           PwC: The media business has
                                                                                           changed during that period of
                                                                                           time. How has the business model
                                                                                           at FT.com evolved over the years?
                                                                                           JS: From the user’s perspective, FT.com
                                               Jon Slade                                   is like a funnel, really, where you have
                                               Jon Slade is global online and strategic    free access at the outer edge of the
                                               advertising sales director at FT.com, the   funnel, free access for registration in
                                               digital arm of the Financial Times.         the middle, and then the subscriber
                                                                                           at the innermost part. The funnel is
                                                                                           based on the volume of consumption.

                                                                                           From an ad sales perspective, targeting
                                                                                           the most relevant person is essential.
                                                                                           So the types of clients that we’re talking
                                                                                           about—companies like PwC, Rolex, or
                                                                                           Audi—are not interested in a scatter
                                                                                           graph approach to advertising. The
                                                                                           advertising business thrives on targeting
                                                                                           advertising very, very specifically.

                                                                                           On the one hand, we have an ad model
                                                                                           that requires very precise, targeted
                                                                                           information. And on the other hand, we
                                                                                           have a metered model of access, which
                                                                                           means we have lots of opportunity to
                                                                                           collect information about our users.


24	     PwC Technology Forecast 2012 Issue 1
“We have what we call the web app with FT.com.
                                                 We’re not available through the iTunes Store
                                                 anymore. We use the technology called HTML5,
                                                 which essentially allows us to have the same kind
                                                 of touch screen interaction as an app would, but
                                                 we serve it through a web page.”


PwC: How does a company like the            from maybe 1 percent or 2 percent           One or two other publishers are starting
FT sell digital advertising space?          just three years ago. So that’s a           to understand that this is a pretty good
JS: Every time you view a web page,         radically changing picture that we          way to push content to mobile devices,
you’ll see an advert appear at the top      now need to understand as well.             and it’s an approach that we’ve been
or the side, and that one appearance                                                    very successful with. We’ve had more
of the ad is what we call an ad             What are the consumption patterns           than 1.4 million users of our new web
impression. We usually sell those in        around mobile? How many pages are           app since we launched it in June 2011.
groups of 1,000 ad impressions.             people consuming? What type of content
                                            are they consuming? What content is         It’s a very fast-growing opportunity
Over a 12-month period, our total           more relevant to a chief executive versus   for us. We see both subscription and
user base, including our 250,000            a finance director versus somebody in       advertising revenue opportunities.
paying subscribers, generates about         Japan versus somebody in Dubai?             And with FT.com we try to balance
6 billion advertising impressions                                                       both of those, both subscription
across FT.com. That’s the currency          Mobile is a very substantial platform       revenue and advertising revenue.
that is bought and sold around              that we now must look at in much
advertising in the online world.            more detail and with much greater           PwC: You chose the web
                                            care than we ever did before.               app after having offered
In essence, my job is to look at those ad                                               a native app, correct?
impressions and work out which one of       PwC: Yes, and regarding the                 JS: That’s right, yes.
those ad impressions is worth the most      mobile picture, have you seen
for any one particular client. And we       any successes in terms of trying            PwC: Could you compare and
have about 2,000 advertising campaigns      to address that channel in a                contrast the two and what
a year that run across FT.com.              new and different way?                      the pros and cons are?
                                            JS: Well, just with the FT, we have         JS: If we want to change how we
Impressions generated have different        what we call the web app with FT.com.       display content in the web app, it’s a
values to different advertisers. So         We’re not available through the iTunes      lot easier for us not to need to go to a
we need to separate all the strands         Store anymore. We use the technology        new version of the app and push that
out of those 6 billion ad impressions       called HTML5, which essentially allows      through into the native app via an
and get as close a picture as we            us to have the same kind of touch           approval process with a third party.
possibly can to generate the most           screen interaction as an app would,         We can just make any changes at our
revenue from those ad impressions.          but we serve it through a web page.         end straight away. And as users go
                                                                                        to the web app, those implemented
PwC: It sounds like you have a              So a user points the browser on their       changes are there for them.
lot of complexity on both the               iPad or other device to FT.com, and it
supply and the demand side. Is              takes you straight through to the app.      On the back end, it gives us a lot
the supply side changing a lot?             There’s no downloading of the app;          more agility to develop advertising
JS: Sure. Mobile is changing things         there’s no content update required. We      opportunities. We can move faster to
pretty dramatically, actually. About        can update the infrastructure of the        take advantage of a growing market,
20 percent of our page views on digital     app very, very easily. We don’t need        plus provide far better web-standard
channels are now generated by a             to push it out through any third party      analytics around campaigns—something
mobile device or by someone who’s           such as Apple. We can retain a direct       that native app providers struggle with.
using a mobile device, which is up          relationship with our customer.


                                            	                               Reshaping the workforce with the new analytics	        25
6B
                                                Big data in online advertising
                                                “Every year, our total user base, including
                                                our 250,000 paying subscribers,
                                                generates about 6 billion advertising
                                                impressions across FT.com.”


One other benefit we’ve seen is that a          With the readers and users of FT.com,         but to our content development
far greater number of people use the            particularly in the last three years as       and our site development, too.
web app than ever used the native app.          the economic crisis has driven like a
So an advertiser is starting to get a bit       whirlwind around the globe, we’ve             If we know, for example, that people
more scale from the process, I guess. But       seen what we call a flight to quality.        type A-1-7 tend to read companies’
it’s just a quicker way to make changes         Users are aware—as are advertisers—           pages between 8 a.m. and 10 a.m.
to the application with the web app.            that they could go to a thousand              and they go on to personal finance
                                                different places to get their news, but       at lunchtime, then we can start to
PwC: How about the demand                       they don’t really have the time to do         examine those groups and drive the
side? How are things changing?                  that. They’re going to fewer places and       right type of content toward them more
You mentioned 6 billion annual                  spending more time within them, and           specifically. It’s an ongoing piece of the
impressions—or opportunities,                   that’s certainly the experience that          content and advertising optimization.
we might phrase it.                             we’ve had with the Financial Times.
JS: Advertising online falls into two                                                         PwC: Is this a test to tune and
distinct areas. There is the scatter graph      PwC: To make a more targeted                  adjust the kind of environment
type of advertising where size matters.         environment for advertising,                  that you’ve been able to create?
There are networks that can give you            you need to really learn more                 JS: Absolutely, both in terms of how
billions and billions of ad impressions,        about the users themselves, yes?              our advertising campaigns display and
and as an advertiser, you throw as many         JS: Yes. Most of the opt-in really            also the type of content that we display.
messages into that mix as you possibly          occurs at the point of registration and       If you and I both looked at FT.com right
can. And then you try and work out              subscription. This is when the user           now, we’d probably see the home page,
over time which ones stuck the best,            declares demographic information:             and 90 percent of what you would see
and then you try and optimize to that.          this is who I am, this is the industry        would be the same as what I would see.
That is how a lot of mainstream or              that I work for, and here’s the ZIP           But about 10 percent of it would not be.
major networks run their businesses.            code that I work from. Users who
                                                subscribe provide a little bit more.          PwC: How does Metamarkets fit
On the other side, there are very,                                                            into this big picture? Could you
very targeted websites that provide             Most of the work that we do around            shine some light on what you’re
advertisers with real efficiency to reach       understanding our users better occurs         doing with them and what the
only the type of demographic that               at the back end. We examine user              initial successes have been?
they’re interested in reaching, and that’s      actions, and we note that people who          JS: Sure. We’ve been working with
very much the side that we fit into.            demonstrate this type of behavior             Metamarkets in earnest for more
                                                tend to go on and do this type of thing       than a year. The real challenge
Over the last two years, there’s been           later in the month or the week or the         that Metamarkets relieves for us
a shift to the extreme on both sides.           session or whatever it might be.              is to understand those 6 billion ad
We’ve seen advertisers go much more                                                           impressions—who’s generating
toward a very scattered environment,            Our back-end analytics allows us to           them, how many I’m likely to have
and equally other advertisers head much         extract certain groups who exhibit            tomorrow of any given sort, and how
more toward investing more of their             those behaviors. That’s probably              much I should charge for them.
money into a very niche environment.            most of the work that we’re focused
And then some advertisers seem to               on at the moment. And that applies            It gives me that single view in a single
try and play a little bit in the middle.        not just to the advertising picture           place in near real time what my exact


26	      PwC Technology Forecast 2012 Issue 1
supply and my exact demand are.             PwC: In general, it seems like
And that is really critical information.    Metamarkets is doing a whole
I increasingly feel a little bit like I’m   piece of your workflow rather
on a flight deck with the number of         than you doing it. Is that a
screens around me to understand.            fair characterization?
When I got into advertising straight        JS: Yes. I’ll give you an example. I was
after my landscape gardening days,          talking to our sales manager in Paris the
I didn’t even have a screen. I didn’t       other day. I said to him, “If you wanted
have a computer when I started.             to know how many adverts of a certain
                                            size that you have available to you in
Previously, the way that data was           Paris next Tuesday that will be created
held—the demographics data, the             by chief executives in France, how would
behavior data, the pricing, the available   you go about getting that answer?”
inventory—was across lots of different
databases and spreadsheets. We needed       Before, the sales team would send an
an almost witchcraft-like algorithm         e-mail to ad operations in London for an
to provide answers to “How many             inventory forecast, and it could take the
impressions do I have?” and “How            ad operations team up to eight working
much should I charge?” It was an            hours to get back to them. It could even
extremely labor-intensive process.          take as long as two business days to get
                                            an answer in times of high volume. Now,
And that approach just didn’t really fit    we’ve reduced that turnaround to about
the need for the industry in which we       eight seconds of self-service, allowing
work. Media advertising is purchased in     our ad operations team time to focus on
real time now. The impression appears,      more strategic output. That’s the sort of
and this process goes between three         magnitude of workflow change that this
or four interested parties—one bid          creates for us—a two-day turnaround
wins out, and the advert is served in       down to about eight seconds.
the time it takes to open a web page.

Now if advertising has been
purchased in real time, we really               “Before, the sales team would send an
need to understand what we have                  e-mail to ad operations in London for an
on our supermarket shelves in real
time, too. That’s what Metamarkets               inventory forecast, and it could take the
does for us—help us visualize in one             ad operations team up to eight working
place our supply and demand.
                                                 hours to get back to them. Now, we’ve
                                                 reduced that turnaround to about eight
                                                 seconds of self-service.”


                                            	                               Reshaping the workforce with the new analytics	   27
PwC: When you were looking                      thousands and thousands of ways,            in New York if I’m there. And there’s
to resolve this problem, were                   and you can’t always predict how a          a lot of back and forth. What seems
there a lot of different services               client or a customer or a colleague is      to happen is that every time we give
that did this sort of thing?                    going to want to split up that data.        it to one of the ultimate end users—
JS: Not that we came across. I have                                                         one of the sales managers around the
to say our conversations with the               So rather than just say, “The only way      world—you can see the lights on in
Metamarkets team actually started               you can do it is this way, and here’s the   their head about the potential for it.
about something not entirely                    off-the-shelf solution,” we really wanted
different, but certainly not the                something that put the power in the         And without fail they’ll say, “That’s
product that we’ve come up with                 hands of the user. And that seems to be     brilliant, but how about this and this?”
now. Originally we had a slightly               what we’ve created here. The credit is      Or, “Could we use it for this?” Or, “How
different concept under discussion              entirely with Metamarkets, I have to say.   about this for an intervention?” It’s
that didn’t look at this part at all.           We just said, “Help, we have a problem,”    great. It’s really encouraging to see
                                                and they said, “OK, here’s a good           a product being taken up by internal
As a company, Metamarkets was                   answer.” So the credit for all the clever   customers with the enthusiasm that it is.
really prepared to say, “We don’t have          stuff behind this should go with them.
something on the shelves. We have                                                           We very much see this as an iterative
some great minds and some really good           PwC: So there continues to be a             project. We don’t see it as necessarily
technology, so why don’t we try to figure       lot of back and forth between FT            having a specific end in sight. We
out with you what your problem is, and          and Metamarkets as your needs               think there’s always more that we
then we’ll come up with an answer.”             change and the demand changes?              can add into this. It’s pretty close
                                                JS: Yes. We have at least a weekly call.    to a partnership really, a straight
To be honest, we looked around a little         The Metamarkets team visits us in           vendor and supplier relationship. It
bit at what else is out there, but I don’t      London about once a month, or we meet       is a genuine partnership, I think.
want to buy anything off the shelf.

I want to work with a company that can
understand what I’m after, go away,
and come back with the answer to that
plus, plus, plus. And that seems to be            “So rather than just say, ‘The only way
the way Metamarkets has developed.                you can do it is this way, and here’s the
Other vendors clearly do something                 off-the-shelf solution,’ we really wanted
similar or close, but most of what I’ve            something that put the power in the
seen comes off the shelf. And we are—
we’re quite annoying to work with, I               hands of the user.”
would say. We’re not really a cookie-
cutter business. You can slice and
dice those 6 billion ad impressions in


28	      PwC Technology Forecast 2012 Issue 1
Supply accuracy in online advertising
“Accuracy of supply is upward of 15 percent better
 than what we’ve seen before.”                                 15%


PwC: How is this actually                    Now that piece is still pretty much            do the legal diligence, and of course
translated into the bottom line—             embryonic, but we’re certainly making          we do the contractual diligence, and of
yield and advertising dollars?               the right moves in that direction. We’ve       course we look around to see what else is
JS: It would be probably a little hard for   found that putting a price up is accepted.     available. But if you have a good instinct
me to share with you any percentages         Essentially what an increase in yield          about working with somebody, then
or specifics, but I can say that it is       implies is that you put your price up.         we’re the size of organization where that
driving up the yields we achieve. It                                                        instinct can still count for something.
is double-digit growth on yield as a         It’s been accepted because we’ve been
result of being able to understand           able to offer a much tighter specific          And I think that was the case with
our supply and demand better.                segmentation of that audience. Whereas,        Metamarkets. We felt that we were
                                             when people are buying on a spray basis        talking on the same page here.
The degree of accuracy of supply             across large networks, deservedly there        We almost could put words in one
that it provides for us is upward of         is significant price pressure on that.         another’s mouths and the sentence
15 percent better than what we’ve                                                           would still kind of form. So it felt
seen before. I can’t quantify the            Equally, if we understand our supply           very good from the beginning.
difference that it’s made to workflows,      and demand picture in a much more
but it’s significant. To go to a two-        granular sense, we know when it’s a            If we look at what’s happening in the
day turnaround on a simple request           good time to walk away from a deal             digital publishing world, some of the
to eight seconds is significant.             or whether we’re being too bullish in          most exciting things are happening
                                             the deal. That pricing piece is critical,      with very small startup businesses
PwC: Given our research focus,               and we’re looking to get to a real-            and all of the big web powers now
we have lots of friends in the               time dynamic pricing model in 2012.            were startups 8 or 10 years ago,
publishing business, and many                And Metamarkets is certainly along             such as Facebook and Amazon.
of them talked to us about the               the right lines to help us with that.
decline in return from impression                                                           We believe in that mentality. We
advertising. It’s interesting.               PwC: A lot of our clients are very             believe in a personality in business.
Your story seems to be pushing               conservative organizations,                    Metamarkets represented that to us
in the different direction.                  and they might be reluctant                    very well. And yes, there’s a little bit of a
JS: Yes. I’ve noticed that entirely.         to subscribe to a cloud service                risk, but it has paid off. So we’re happy.
Whenever I talk to a buying customer,        like Metamarkets, offered by
they always say, “Everybody else             a company that has not been
is getting cheaper, so how come              around for a long time. I’m
you’re getting more expensive?”              assuming that the FT had
                                             to make the decision to go
I completely hear that. What I would say     on this different route and
is we are getting better at understanding    that there was quite a bit of
the attribution model. Ultimately,           consideration of these factors.
what these impressions create for a          JS: Endless legal diligence would be
client or a customer is not just how         one way to put it—back and forth a lot.
many visits will readers make to your        We have 2,000 employees worldwide,
website, but how much money will             so we still have a fairly entrepreneurial
they spend when they get there.              attitude toward suppliers. Of course we


                                             	                                  Reshaping the workforce with the new analytics	        29
30	   PwC Technology Forecast 2012 Issue 1
The art and science
of new analytics
technology
Left-brain analysis connects with
right-brain creativity.
By Alan Morrison


The new analytics is the art and science      •	 In-memory technology—Reducing
of turning the invisible into the visible.       response time and expanding
It’s about finding “unknown unknowns,”           the reach of business intelligence
as former US Secretary of Defense                (BI) by extending the use of main
Donald Rumsfeld famously called them,            (random access) memory
and learning at least something about
them. It’s about detecting opportunities      •	 Interactive visualization—Merging
and threats you hadn’t anticipated, or           the user interface and the presentation
finding people you didn’t know existed           of results into one responsive
who could be your next customers. It’s           visual analytics environment
about learning what’s really important,
rather than what you thought was              •	 Statistical rigor—Bringing more of
important. It’s about identifying,               the scientific method and evidence
committing, and following through on             into corporate decision making
what your enterprise must change most.
                                              •	 Associative search—Navigating to
Achieving that kind of visibility                specific names and terms by browsing
requires a mix of techniques. Some               the nearby context (see the sidebar,
of these are new, while others aren’t.           “Associative search,” on page 41)
Some are clearly in the realm of data
science because they make possible            A companion piece to this article,
more iterative and precise analysis           “Natural language processing and
of large, mixed data sets. Others, like       social media intelligence,” on page 44,
visualization and more contextual             reviews the methods that vendors use
search, are as much art as science.           for the needle-in-a-haystack challenge
                                              of finding the most relevant social
This article explores some of the newer       media conversations about particular
technologies that make feasible the case      products and services. Because social
studies and the evolving cultures of          media is such a major data source for
inquiry described in “The third wave of       exploratory analytics and because
customer analytics” on page 06. These         natural language processing (NLP)
technologies include the following:           techniques are so varied, this topic
                                              demands its own separate treatment.


	                                 Reshaping the workforce with the new analytics	       31
Figure 1: Addressable analytics footprint for in-memory technology	
In-memory technology augmented traditional business intelligence (BI) and predictive analytics to begin with, but its footprint
will expand over the forecast period to become the base for corporate apps, where it will blur the boundary between
transactional systems and data warehousing. Longer term, more of a 360-degree view of the customer can emerge.

           2011                                   2012                                              2013                               2014


                  BI

                                                          +                                                                         Cross-
                                                          ERP and                                                                   functional,
                                                          mobile                              +                                     cross-source
                                                                                              Other corporate                       analytics
                                                                                              apps


                                                In-memory technology                                          users were limited to BI suites such
                                                Enterprises exploring the latest                              as BusinessObjects to push the
                                                in-memory technology soon come                                information to mobile devices,” says
                                                to realize that the technology’s                              Murali Chilakapati, a manager in PwC’s
                                                fundamental advantage—expanding the                           Information Management practice and
                                                capacity of main memory (solid-state                          a HANA implementer. “Now they’re
                                                memory that’s directly accessible) and                        going beyond BI. I think in-memory
                                                reducing reliance on disk drive storage                       is one of the best technologies that
                                                to reduce latency—can be applied in                           will help us to work toward a better
                                                many different ways. Some of those                            overall mobile analytics experience.”
                                                applications offer the advantage of being
                                                more feasible over the short term. For                        The full vision includes more cross-
                                                example, accelerating conventional BI                         functional, cross-source analytics, but
                                                is a short-term goal, one that’s been                         this will require extensive organizational
                                                feasible for several years through earlier                    and technological change. The
                                                products that use in-memory capability                        fundamental technological change is
                                                from some BI providers, including                             already happening, and in time richer
                                                MicroStrategy, QlikTech QlikView,                             applications based on these changes will
                                                TIBCO Spotfire, and Tableau Software.                         emerge and gain adoption. (See Figure
                                                                                                              1.) “Users can already create a mashup
                                                Longer term, the ability of platforms                         of various data sets and technology
                                                such as Oracle Exalytics, SAP HANA,                           to determine if there is a correlation,
                                                and the forthcoming SAS in-memory                             a trend,” says Kurt J. Bilafer, regional
                                                Hadoop-based platform1 to query                               vice president of analytics at SAP.
                                                across a wide range of disparate data
                                                sources will improve. “Previously,                            To understand how in-memory advances
                                                                                                              will improve analytics, it will help to
                                                                                                              consider the technological advantages
                                                1	 See Doug Henschen, “SAS Prepares Hadoop-
                                                   Powered In-Memory BI Platform,” InformationWeek,           of hardware and software, and how
                                                   February 14, 2012, http://www.informationweek.com/         they can be leveraged in new ways.
                                                   news/hardware/grid_cluster/232600767, accessed
                                                   February 15, 2012. SAS, which also claims interactive
                                                   visualization capabilities in this appliance, expects to
                                                   make this appliance available by the end of June 2012.


32	      PwC Technology Forecast 2012 Issue 1
What in-memory technology does                 Memory swapping
                                             Figure 2: Memory swapping
For decades, business analytics has
been plagued by slow response                Swapping data from RAM to disk
times (also known as latency), a             introduces latency that in-memory
                                             systems designs can now avoid.
problem that in-memory technology
helps to overcome. Latency is due
to input/output bottlenecks in                                 RAM
a computer system’s data path.
These bottlenecks can be alleviated              Block out               Block in
by using six approaches:

•	 Move the traffic through more
   paths (parallelization)
                                                             Steps that
                                                         introduce latency
•	 Increase the speed of any
   single path (transmission)

•	 Reduce the time it takes to
   switch paths (switching)

•	 Reduce the time it takes to
   store bits (writing)

•	 Reduce the time it takes to
   retrieve bits (reading)

•	 Reduce computation
   time (processing)

To process and store data properly           access memory (RAM) rather than
and cost-effectively, computer               frequently reading it from and writing
systems swap data from one kind of           it to disk—makes it possible to bypass
memory to another a lot. Each time           many input/output bottlenecks.
they do, they encounter latency in
transmitting, switching, writing,            Systems have needed to do a lot of
or reading bits. (See Figure 2.)             swapping, in part, because faster
                                             storage media were expensive. That’s
Contrast this swapping requirement with      why organizations have relied heavily
processing alone. Processing is much         on high-capacity, cheaper disks for
faster because so much of it is on-chip or   storage. As transistor density per square
directly interconnected. The processing      millimeter of chip area has risen, the
function always outpaces multitiered         cost per bit to use semiconductor (or
memory handling. If these systems            solid-state) memory has dropped and
can keep more data “in memory”               the ability to pack more bits in a given
or directly accessible to the central        chip’s footprint has increased. It is now
processing units (CPUs), they can avoid      more feasible to use semiconductor
swapping and increase efficiency by          memory in more places where it
accelerating inputs and outputs.             can help most, and thereby reduce
                                             reliance on high-latency disks.
Less swapping reduces the need for
duplicative reading, writing, and            Of course, the solid-state memory used
moving data. The ability to load and         in direct access applications, dynamic
work on whole data sets in main              random access memory (DRAM), is
memory—that is, all in random                volatile. To avoid the higher risk of


                                             	                                Reshaping the workforce with the new analytics	   33
Write-behind caching

                                             Figure 3: Write-behind caching
                                                                                          management practice, notes: “Having
                                                                                          a big data set in one location gives you
                                             Write-behind caching makes writes to         more flexibility.” T-Mobile, one of SAP’s
                                             disk independent of other write functions.   customers for HANA, claims that reports
                                                                                          that previously took hours to generate
                                                     CPU                                  now take seconds. HANA did require
                                                           Reader    Writer               extensive tuning for this purpose.2

                                                                                          Appliances with this level of main
                                                         RAM
                                                                                          memory capacity started to appear
                                                                                          in late 2010, when SAP first offered
                                                                                          HANA to select customers. Oracle soon
                                                                                          followed by announcing its Exalytics
                                                                                          In-Memory Machine at OpenWorld
                                                                     Write                in October 2011. Other vendors well
                                                                     behind               known in BI, data warehousing, and
                                                                                          database technology are not far behind.
                                                                                          Taking full advantage of in-memory
                                                                                          technology depends on hardware and
                                                                                          software, which requires extensive
                                                                                          supplier/provider partnerships even
                                                                                          before any thoughts of implementation.
                                             Source: Gigaspaces and PwC, 2010 and 2012
T-Mobile, one of SAP’s                                                                    Rapid expansion of in-memory
customers for HANA,                                                                       hardware. Increases in memory bit
                                             data loss from expanding the use of          density (number of bits stored in a
claims that reports                          DRAM, in-memory database systems             square millimeter) aren’t qualitatively
that previously took                         incorporate a persistence layer with         new; the difference now is quantitative.
                                             backup, restore, and transaction             What seems to be a step-change in
hours to generate now                        logging capability. Distributed caching      in-memory technology has actually
take seconds.                                systems or in-memory data grids              been a gradual change in solid-
                                             such as Gigaspaces XAP data grid,            state memory over many years.
                                             memcached, and Oracle Coherence—
                                             which cache (or keep in a handy place)       Beginning in 2011, vendors could install
                                             lots of data in DRAM to accelerate           at least a terabyte of main memory,
                                             website performance—refer to this            usually DRAM, in a single appliance.
                                             same technique as write-behind caching.      Besides adding DRAM, vendors are
                                             These systems update databases on            also incorporating large numbers of
                                             disk asynchronously from the writes          multicore processors in each appliance.
                                             to DRAM, so the rest of the system           The Exalytics appliance, for example,
                                             doesn’t need to wait for the disk write      includes four 10-core processors.3
                                             process to complete before performing
                                             another write. (See Figure 3.)               The networking capabilities of the
                                                                                          new appliances are also improved.
                                             How the technology benefits
                                             the analytics function
                                                                                          2	 Chris Kanaracus, “SAP’s HANA in-memory database
                                             The additional speed of improved                will run ERP this year,” IDG News Service, via InfoWorld,
                                             in-memory technology makes possible             January 25, 2012, http://www.infoworld.com/d/
                                                                                             applications/saps-hana-in-memory-database-will-run-
                                             more analytics iterations within a              erp-year-185040, accessed February 5, 2012.
                                             given time. When an entire BI suite          3	 Oracle Exalytics In-Memory Machine: A Brief
                                             is contained in main memory, there              Introduction, Oracle white paper, October 2011, http://
                                                                                             www.oracle.com/us/solutions/ent-performance-bi/
                                             are many more opportunities to query            business-intelligence/exalytics-bi-machine/overview/
                                             the data. Ken Campbell, a director in           exalytics-introduction-1372418.pdf, accessed
                                                                                             February 1, 2012.
                                             PwC’s information and enterprise data


34	   PwC Technology Forecast 2012 Issue 1
Use case examples


Exalytics has two 40Gbps InfiniBand                            Business process advantages
connections for low-latency database
server connections and two 10 Gigabit                          of in-memory technology
Ethernet connections, in addition to
lower-speed Ethernet connections.                              In-memory technology makes                   in-memory technology. Analysts could
Effective data transfer rates are                              it possible to run queries that              identify new patterns of fraud in tax
somewhat lower than the stated raw                             previously ran for hours in minutes,         return data in ways they hadn’t been able
speeds. InfiniBand connections became                          which has numerous implications.             to before, making it feasible to provide
more popular for high-speed data                               Running queries faster implies the           investigators more helpful leads, which
center applications in the late 2000s.                         ability to accelerate data-intensive         in turn could make them more effective
With each succeeding generation,                               business processes substantially.            in finding and tracking down the most
InfiniBand’s effective data transfer                                                                        potentially harmful perpetrators before
rate has come closer to the raw rate.                          Take the case of supply chain                their methods become widespread.
Fourteen data rate or FDR InfiniBand,                          optimization in the electronics
which has a raw data lane rate of more                         industry. Sometimes it can take 30           Competitive advantage in these cases
than 14Gbps, became available in 2011.4                        hours or more to run a query from a          hinges on blending effective strategy,
                                                               business process to identify and fill        means, and execution together, not
                                                               gaps in TV replenishment at a retailer,      just buying the new technology and
Improvements in in-memory
                                                               for example. A TV maker using an             installing it. In these examples, the
databases. In-memory databases are
                                                               in-memory appliance component in             challenge becomes not one of simply
quite fast because they are designed to
                                                               this process could reduce the query          using a new technology, but using it
run entirely in main memory. In 2005,
                                                               time to under an hour, allowing the          effectively. How might the TV maker
Oracle bought TimesTen, a high-speed,                          maker to reduce considerably the time        anticipate shortfalls in supply more
in-memory database provider serving                            it takes to respond to supply shortfalls.    readily? What algorithms might be most
the telecom and trading industries.                                                                         effective in detecting new patterns of
With the help of memory technology                             Or consider the new ability to               tax return fraud? At its best, in-memory
improvements, by 2011, Oracle claimed                          incorporate into a process more              technology could trigger many creative
that entire BI system implementations,                         predictive analytics with the help of        ideas for process improvement.
such as Oracle BI server, could be held
in main memory. Federated databases—
multiple autonomous databases that
can be run as one—are also possible.
“I can federate data from five physical                    with SAP porting its enterprise resource
databases in one machine,” says PwC                        planning (ERP) module to HANA
Applied Analytics Principal Oliver Halter.                 beginning in the fourth quarter of
                                                           2012, followed by other modules.5
In 2005, SAP bought P*Time, a
highly parallelized online transaction                     Better compression. In-memory
processing (OLTP) database, and                            appliances use columnar compression,
has blended its in-memory database                         which stores similar data together to
capabilities with those of TREX and                        improve compression efficiency. Oracle
MaxDB to create the HANA in-memory                         claims a columnar compression capability
database appliance. HANA includes                          of 5x, so physical capacity of 1TB is
stores for both row (optimal for                           equivalent to having 5TB available.
transactional data with many fields)                       Other columnar database management
and column (optimal for analytical data                    system (DBMS) providers such as
with fewer fields), with capabilities                      EMC/Greenplum, IBM/Netezza, and
for both structured and less structured                    HP/Vertica have refined their own
data. HANA will become the base for                        columnar compression capabilities
the full range of SAP’s applications,                      over the years and will be able to apply
                                                           these to their in-memory appliances.
4	 See “What is FDR InfiniBand?” at the InfiniBand Trade
   Association site (http://members.infinibandta.org/
   kwspub/home/7423_FDR_FactSheet.pdf, accessed            5	 Chris Kanaracus, op. cit.
   February 10, 2012) for more information on InfiniBand
   availability.


                                                           	                                    Reshaping the workforce with the new analytics	        35
More adaptive and efficient caching         data such as fact tables (for example, a
                                             algorithms. Because main memory             list of countries) that the system needs
                                             is still limited physically, appliances     at hand. The algorithms haven’t been
                                             continue to make extensive use of           smart enough to recognize less used
                                             advanced caching techniques that            but clearly essential fact tables that
                                             increase the effective amount of            could be easily cached in main memory
                                             main memory. The newest caching             because they are often small anyway.
                                             algorithms—lists of computational
                                             procedures that specify which data          Generally speaking, progress has
                                             to retain in memory—solve an old            been made on many fronts to improve
                                             problem: tables that get dumped             in-memory technology. Perhaps most
                                             from memory when they should be             importantly, system designers have
                                             maintained in the cache. “The caching       been able to overcome some of the
                                             strategy for the last 20 years relies       hardware obstacles preventing the
                                             on least frequently used algorithms,”       direct connections the data requires
                                             Halter says. “These algorithms aren’t       so it can be processed. That’s a
                                             always the best approaches.” The term       fundamental first step of a multi-
                                             least frequently used refers to how these   step process. Although the hardware,
                                             algorithms discard the data that hasn’t     caching techniques, and some software
                                             been used a lot, at least not lately.       exist, the software refinement and
                                                                                         expansion that’s closer to the bigger
                                             The method is good in theory, but in        vision will take years to accomplish.
                                             practice these algorithms can discard


                “The caching strategy for the
                 last 20 years relies on least
                 frequently used algorithms.
                 These algorithms aren’t
                 always the best approaches.”
                —Oliver Halter, PwC


36	   PwC Technology Forecast 2012 Issue 1
Figure 4: Data blending
In self-service BI software, the end user can act as an analyst.


   Sales database                                        Territory spreadsheet       A   B    C


   Customer name       Container                         State
   Last n days         Product category                  State abbreviated
   Order date          Profit                            Population, 2009
   Order ID            State                             Territory
   Order priority      ZIP code                                              Tableau recognizes
                                                                             identical fields in
                                                                             different data sets.

             Simple drag and drop replaces days of programming.


     Database

                                                                             You can combine,
                                                                             filter, and even
                                                                             perform calculations
                                                                             among different
     Spreadsheet
                                                                             data sources right in
                                                                             the Tableau window.


Source: Tableau Software, 2011
Derived from a video at http://www.tableausoftware.com/videos/data-integration


Self-service BI and                                  In the most visually capable BI tools,
interactive visualization                            the presentation of data becomes just
One of BI’s big challenges is to make it             another feature of the user interface.
easier for a variety of end users to ask             Figure 4 illustrates how Tableau,
questions of the data and to do so in an             for instance, unifies data blending,
iterative way. Self-service BI tools put             analysis, and dashboard sharing within
a larger number of functions within                  one person’s interactive workflow.
reach of everyday users. These tools
can also simplify a larger number of                 How interactive visualization works
tasks in an analytics workflow. Many                 One important element that’s been
tools—QlikView, Tableau, and TIBCO                   missing from BI and analytics platforms
Spotfire, to name a few—take some                    is a way to bridge human language in the
advantage of the new in-memory                       user interface to machine language more
technology to reduce latency. But                    effectively. User interfaces have included
equally important to BI innovation                   features such as drag and drop for
are interfaces that meld visual ways                 decades, but drag and drop historically
of blending and manipulating the                     has been linked to only a single
data with how it’s displayed and                     application function—moving a file
how the results are shared.                          from one folder to another, for example.


                                                     	                                       Reshaping the workforce with the new analytics	   37
Figure 5: Bridging human, visual, and machine language

1. To the user, results come from a simple             2. Behind the scenes, complex algebra actually makes the motor run. Hiding all the
      drag and drop, which encourages                     complexities of the VizQL computations saves time and frees the user to focus on the
      experimentation and further inquiry.                results of the query, rather than the construction of the query.


                                                             552                                                                  1104                                      556
                                                                                  550                612                                                                                    614
      Database
                                                                                   Specification                 Compute           x: { (c1, a1)…(ck, bj ) }               Construct
                                                                                   x: C*(A+B)                normalized set       y: { (c1), …(d l ), (e1), …(em ) }      table and
                                                                General
                                                                                   y: D+E                     form of each        z: { (f1), …(fn ) }                      sorting
                                                                queries
                                                                                   Z: F                     table expression                                               network
      Spreadsheet                                                                  Iod: G
                                                                                   …


                                                                                                           z x, y
                                                                                                                                                                                   720
                                                                                     Query results
                                                                                                            Partition into relations
                                                                                                            corresponding to panes
                                                                                                           616
                                                            Data interpreter                                                                                           Visual interpreter


                                                                                            Per pane aggregation
                                                                                            and sorting of tuples        Each tuple is rendered as a mark;
                                                                                                                         data is encoded in color, size, etc.


Source: Chris Stolte, Diane Tang, and Pat Hanrahan, “Computer systems and methods for the query and visualization of multidimensional databases,”
United States Patent 7089266, Stanford University, 2006, http://www.freepatentsonline.com/7089266.html, accessed February 12, 2012.


                                                     To query the data, users have resorted                              Jock Mackinlay, director of visual
                                                     to typing statements in languages                                   analysis at Tableau Software, puts it
                                                     such as SQL that take time to learn.                                this way: “The algebra is a crisp way to
                                                                                                                         give the hardware a way to interpret
                                                     What a tool such as Tableau does                                    the data views. That leads to a really
                                                     differently is to make manipulating                                 simple user interface.” (See Figure 5.)
                                                     the data through familiar techniques
                                                     (like drag and drop) part of an ongoing                             The benefits of interactive visualization
                                                     dialogue with the database extracts                                 Psychologists who study how humans
                                                     that are in active memory. By doing so,                             learn have identified two types: left-
                                                     the visual user interface offers a more                             brain thinkers, who are more analytical,
                                                     seamless way to query the data layer.                               logical, and linear in their thinking, and
                                                                                                                         right-brain thinkers, who take a more
                                                     Tableau uses what it calls Visual Query                             synthetic parts-to-wholes approach
                                                     Language (VizQL) to create that                                     that can be more visual and focused on
                                                     dialogue. What the user sees on the                                 relationships among elements. Visually
                                                     screen, VizQL encodes into algebraic                                oriented learners make up a substantial
                                                     expressions that machines interpret and                             portion of the population, and adopting
                                                     execute in the data. VizQL uses table                               tools more friendly to them can be the
                                                     algebra developed for this approach                                 difference between creating a culture
                                                     that maps rows and columns to the                                   of inquiry, in which different thinking
                                                     x- and y-axes and layers to the z-axis.6                            styles are applied to problems, and
                                                                                                                         making do with an isolated group of
                                                     6	 See Chris Stolte, Diane Tang, and Pat Hanrahan,
                                                        “Polaris: A System for Query, Analysis, and Visualization
                                                        of Multidimensional Databases,” Communications of
                                                        the ACM, November 2008, 75–76, http://
                                                        mkt.tableausoftware.com/files/Tableau-CACM-Nov-
                                                        2008-Polaris-Article-by-Stolte-Tang-Hanrahan.pdf,
                                                        accessed February 10, 2012, for more information on
                                                        the table algebra Tableau uses.


38	          PwC Technology Forecast 2012 Issue 1
Good visualizations without
statisticians. (See the article, “How
CIOs can build the foundation for a data                         normalized data
science culture,” on page 58.)
The new class of visually interactive,                           Business analytics software generally               the data is already set up for the
self-service BI tools can engage parts of                        assumes that the underlying data is                 analytical processing that machines
the workforce—including right-brain                              reasonably well designed, providing                 can undertake, the Freemix designers
thinkers—who may not have been                                   powerful tools for visualization and the            concluded that the machine needs help
previously engaged with analytics.                               exploration of scenarios. Unfortunately,            from the user to establish context, and
                                                                 well-designed, structured information               made generating that context feasible
At Seattle Children’s Hospital, the                              is a rarity in some domains.                        for even an unsophisticated user.
director of knowledge management,                                Interactive tools can help refine a
Ted Corbett, initially brought Tableau                           user’s questions and combine data,                  Freemix walks the user through
into the organization. Since then,                               but often demand a reasonably                       the process of adding context to
according to Elissa Fink, chief marketing                        normalized schematic framework.                     the data by using annotations and
officer of Tableau Software, its use has                                                                             augmentation. It then provides plug-
spread to include these functions:                               Zepheira’s Freemix product, the                     ins to normalize fields, and it enhances
                                                                 foundation of the Viewshare.org project             data with new, derived fields (from
                                                                 from the US Library of Congress,                    geolocation or entity extraction, for
•	 Facilities optimization—
                                                                 works with less-structured data, even               example). These capabilities help the
   Making the best use of scarce
                                                                 comma-separated values (CSV) files                  user display and analyze data quickly,
   operating room resources
                                                                 with no headers. Rather than assuming               even when given only ragged inputs.

•	 Inventory optimization—
   Reducing the tendency for nurses
   to hoard or stockpile supplies by
   providing visibility into what’s
   available hospital-wide
                                                             The QlikTech QlikView 11 also integrates
•	 Test order reporting—Ensuring tests                       with Microsoft SharePoint and is based on
   ordered in one part of the hospital                       an HTML5 web application architecture
   aren’t duplicated in another part                         suitable for tablets and other handhelds.8

•	 Financial aid identification                              Bringing more statistical
   and matching—Expediting a                                 rigor to business decisions
   match between needy parents                               Sports continue to provide examples
   whose children are sick and                               of the broadening use of statistics. In
   a financial aid source                                    the United States several years ago,
                                                             Billy Beane and the Oakland Athletics
The proliferation of iPad devices, other                     baseball team, as documented in
tablets, and social networking inside the                    Moneyball by Michael Lewis, hired
enterprise could further encourage the                       statisticians to help with recruiting
adoption of this class of tools. TIBCO                       and line-up decisions, using previously
Spotfire for iPad 4.0, for example,                          little-noticed player metrics. Beane
integrates with Microsoft SharePoint                         had enough success with his method
and tibbr, TIBCO’s social tool.7                             that it is now copied by most teams.


7	 Chris Kanaracus, “Tibco ties Spotfire business            8	 Erica Driver, “QlikView Supports Multiple
   intelligence to SharePoint, Tibbr social network,”           Approaches to Social BI,” QlikCommunity, June
   InfoWorld, November 14, 2011, http://                        24, 2011, http://community.qlikview.com/blogs/
   www.infoworld.com/d/business-intelligence/tibco-ties-        theqlikviewblog/2011/06/24/with-qlikview-you-can-
   spotfire-business-intelligence-sharepoint-tibbr-social-      take-various-approaches-to-social-bi, and Chris
   network-178907, accessed February 10, 2012.                  Mabardy, “QlikView 11—What’s New On Mobile,”
                                                                QlikCommunity, October 19, 2011, http://
                                                                community.qlikview.com/blogs/theqlikviewblog
                                                                /2011/10/19, accessed February 10, 2012.


                                                             	                                           Reshaping the workforce with the new analytics	        39
In 2012, there’s a debate over whether               theme park and can reduce the longest
                                             US football teams should more seriously              wait times for rides, that is a clear way
                                             consider the analyses of academics such              to improve customer satisfaction, and it
                                             as Tobias Moskowitz, an economics                    may pay off more and be less expensive
                                             professor at the University of Chicago,              than reducing the average wait time.
                                             who co-authored a book called
                                             Scorecasting. He analyzed 7,000 fourth-              Much of the utility of statistics is to
                                             down decisions and outcomes, including               confront old thinking habits with valid
                                             field positions after punts and various              findings that may seem counterintuitive
                                             other factors. His conclusion? Teams                 to those who aren’t accustomed to
                                             should punt far less than they do.                   working with statistics or acting on the
“There are certain                                                                                basis of their findings. Clearly there
                                             This conclusion contradicts the common               is utility in counterintuitive but valid
 statistical principles                      wisdom among football coaches: even                  findings that have ties to practical
 and concepts that lie                       with a 75 percent chance of making a                 business metrics. They get people’s
                                             first down when there’s just two yards to            attention. To counter old thinking habits,
 underneath all the                          go, coaches typically choose to punt on              businesses need to raise the profiles of
 sophisticated methods.                      fourth down. Contrarians, such as Kevin              statisticians, scientists, and engineers
                                             Kelley of Pulaski Academy in Little Rock,            who are versed in statistical methods,
 You can get a lot out                       Arkansas, have proven Moskowitz right.               and make their work more visible. That
 of or you can go far                        Since 2003, Kelley went for it on fourth             in turn may help to raise the visibility
                                             down (in various yardage situations)                 of statistical analysis by embedding
 without having to do                        500 times and has a 49 percent success               statistical software in the day-to-day
 complicated math.”                          rate. Pulaski Academy has won the                    business software environment.
                                             state championship three times
 —Kaiser Fung,                               since Kelley became head coach.9                     R: Statistical software’s
                                                                                                  open source evolution
 New York University                         Addressing the human factor                          Until recently, statistical software
                                             As in the sports examples, statistical               packages were in a group by themselves.
                                             analysis applied to business can                     College students who took statistics
                                             surface findings that contradict long-               classes used a particular package, and
                                             held assumptions. But the basic                      the language it used was quite different
                                             principles aren’t complicated. “There                from programming languages such as
                                             are certain statistical principles                   Java. Those students had to learn not
                                             and concepts that lie underneath                     only a statistical language, but also other
                                             all the sophisticated methods. You                   programming languages. Those who
                                             can get a lot out of or you can go far               didn’t have this breadth of knowledge
                                             without having to do complicated                     of languages faced limitations in what
                                             math,” says Kaiser Fung, an adjunct                  they could do. Others who were versed
                                             professor at New York University.                    in Python or Java but not a statistical
                                                                                                  package were similarly limited.
                                             Simply looking at variability is an
                                             example. Fung considers variability                  What’s happened since then is the
                                             a neglected factor in comparison to                  proliferation of R, an open source
                                             averages, for example. If you run a                  statistical programming language
                                                                                                  that lends itself to more uses in
                                             9	 Seth Borenstein, “Unlike Patriots, NFL slow to
                                                embrace ‘Moneyball’,” Seattle Times, February
                                                3, 2012, http://seattletimes.nwsource.com/html/
                                                sports/2017409917_apfbnsuperbowlanalytics.html,
                                                accessed February 10, 2012.


40	   PwC Technology Forecast 2012 Issue 1
Associative search
business environments. R has become
popular in universities and now has
                                                                 Particularly for the kinds of enterprise                 At any time, users can see not only what
thousands of ancillary open source
                                                                 databases used in business intelligence,                 data is associated—but what data is
applications in its ecosystem. In its latest                     simple keyword search goes only so                       not related. The data related to their
incarnations, it has become part of the                          far. Keyword searches often come                         selections is highlighted in white while
fabric of big data and more visually                             up empty for semantic reasons—the                        unrelated data is highlighted in gray.
oriented analytics environments.                                 users doing the searching can’t guess
                                                                 the term in a database that comes                        In the case of QlikView’s associative
R in open source big data                                        closest to what they’re looking for.                     search, users type relevant words or
environments. Statisticians have                                                                                          phrases in any order and get quick,
typically worked with small data                                 To address this problem, self-service BI                 associative results. They can search
sets on their laptops, but now they                              tools such as QlikView offer associative                 across the entire data set, and with
can work with R directly on top of                               search. Associative search allows                        search boxes on individual lists, users
Hadoop, an open source cluster                                   users to select two or more fields and                   can confine the search to just that
computing environment.10 Revolution                              search occurrences in both to find                       field. Users can conduct both direct
Analytics, which offers a commercial                             references to a third concept or name.                   and indirect searches. For example,
R distribution, created a Hadoop                                                                                          if a user wanted to identify a sales
interface for R in 2011, so R users will                         With the help of this technique, users                   rep but couldn’t remember the sales
not be required to use MapReduce or                              can gain unexpected insights and                         rep’s name—just details about the
Java.11 The result is a big data analytics                       make discoveries by clearly seeing                       person, such as that he sells fish to
capability for R statisticians and                               how data is associated—sometimes                         customers in the Nordic region—
programmers that didn’t exist before,                            for the very first time. They ask a                      the user could search on the sales
                                                                 stream of questions by making a series                   rep list box for “Nordic” and “fish”
one that requires no additional skills.
                                                                 of selections, and they instantly see                    to narrow the search results to just
                                                                 all the fields in the application filter                 sellers who meet those criteria.
R convertible to SQL and part of
                                                                 themselves based on their selections.
the Oracle big data environment.
In January 2012, Oracle announced
Oracle R Enterprise, its own
distribution of R, which is bundled
with a Hadoop distribution in its big                        interactive visualization.13 R is best
data appliance. With that distribution,                      known for its statistical analysis
R users can run their analyses in the                        capabilities, not its interface. However,
Oracle 11G database. Oracle claims                           interactive visualization tools such
performance advantages when                                  as Omniscope are beginning to
running in its own database.12                               offer integration with R, improving
                                                             the interface significantly.
Integrating interactive visualization
with R. One of the newest capabilities                       The resulting integration makes it
involving R is its integration with                          possible to preview data from various
                                                             sources, drag and drop from those
                                                             sources and individual R statistical
10	 See “Making sense of Big Data,” Technology Forecast
    2010, Issue 3, http://www.pwc.com/us/en/technology-      operations, and drag and connect
    forecast/2010/issue3/index.jhtml, and Architecting the   to combine and display results.
    data layer for analytic applications, PwC white paper,
    Spring 2011, http://www.pwc.com/us/en/increasing-        Users can view results in either a
    it-effectiveness/assets/pwc-data-architecture.pdf,       data manager view or a graph view
    accessed April 5, 2012, to learn more about Hadoop
    and other NoSQL databases.                               and refine the visualization within
11	 Timothy Prickett Morgan, “Revolution speeds stats on
                                                             either or both of those views.
    Hadoop clusters,” The Register, September 27, 2011,
    http://www.theregister.co.uk/2011/09/27/revolution_r_
    hadoop_integration/, accessed February 10, 2012.
                                                             13	 See Steve Miller, “Omniscope and R,” Information
12	 Doug Henschen, “Oracle Analytics Package Expands             Management, February 7, 2012, http://
    In-Database Processing Options,” InformationWeek,            www.information-management.com/blogs/data-
    February 8, 2012, http://informationweek.com/news/           science-agile-BI-visualization-Visokio-10021894-1.html
    software/bi/232600448, accessed February 10, 2012.           and the R Statistics/Omniscope 2.7 video,
                                                                 http://www.visokio.com/featured-videos, accessed
                                                                 February 8, 2012.


                                                             	                                             Reshaping the workforce with the new analytics	           41
R has benefitted greatly from its status    There is clear promise in harnessing
                                             in the open source community, and           the power of a larger proportion of the
                                             this has brought it into a mainstream       whole workforce with one aspect or
                                             data analysis environment. There            another of the new analytics. But that’s
                                             is potential now for more direct            not the only promise. There’s also the
                                             collaboration between the analysts and      promise of more data and more insight
                                             the statisticians. Better visualization     about the data for staff already fully
                                             and tablet interfaces imply an              engaged in BI, because of processes
                                             ability to convey statistically based       that are instrumented closer to the
                                             information more powerfully and             action; the parsing and interpretation
                                             directly to an executive audience.          of prose, not just numbers; the speed
                                                                                         that questions about the data can be
                                             Conclusion: No lack of vision,              asked and answered; the ability to
                                             resources, or technology                    establish whether a difference is random
                                             The new analytics certainly doesn’t lack    error or real and repeatable; and the
                                             for ambition, vision, or technological      active engagement with analytics that
                                             innovation. SAP intends to base             interactive visualization makes possible.
                                             its new applications architecture           These changes can enable a company to
                                             on the HANA in-memory database              be highly responsive to its environment,
                                             appliance. Oracle envisions running         guided by a far more accurate
                                             whole application suites in memory,         understanding of that environment.
                                             starting with BI. Others that offer BI
                                             or columnar database products have          There are so many different ways now to
                                             similar visions. Tableau Software and       optimize pieces of business processes, to
                                             others in interactive visualization         reach out to new customers, to debunk
                                             continue to refine and expand a visual      old myths, and to establish realities
                                             language that allows even casual users      that haven’t been previously visible. Of
                                             to extract, analyze, and display in a few   course, the first steps are essential—
                                             drag-and-drop steps. More enterprises       putting the right technologies in place
                                             are keeping their customer data             can set organizations in motion toward
                                             longer, so they can mine the historical     a culture of inquiry and engage those
                                             record more effectively. Sensors            who haven’t been fully engaged.
                                             are embedded in new places daily,
                                             generating ever more data to analyze.


42	   PwC Technology Forecast 2012 Issue 1
There are so many different ways
        now to optimize pieces of business
        processes, to reach out to new
        customers, to debunk old myths, and
        to establish realities that haven’t
        been previously visible. Of course,
        the first steps are essential—putting
        the right technologies in place
        can set organizations in motion
        toward a culture of inquiry.


The new analytics
certainly doesn’t lack
for ambition, vision, or
technological innovation.


                      	                 Reshaping the workforce with the new analytics	   43
44	   PwC Technology Forecast 2012 Issue 1
Natural language
processing and social
media intelligence
Mining insights from social media data requires
more than sorting and counting words.
By Alan Morrison and Steve Hamby


Most enterprises are more than eager                     Auker cites the example of a media
to further develop their capabilities in                 company’s use of SocialRep,2 a tool
social media intelligence (SMI)—the                      that uses a mix of natural language
ability to mine the public social media                  processing (NLP) techniques to scan
cloud to glean business insights and act                 social media. Preliminary scanning for
on them. They understand the essential                   the company, which was looking for a
value of finding customers who discuss                   gentler approach to countering piracy,
products and services candidly in public                 led to insights about how motivations
forums. The impact SMI can have goes                     for movie piracy differ by geography. “In
beyond basic market research and test                    India, it’s the grinding poverty. In Eastern
marketing. In the best cases, companies                  Europe, it’s the underlying socialist
can uncover clues to help them revisit                   culture there, which is, ‘my stuff is your
product and marketing strategies.                        stuff.’ There, somebody would buy a
                                                         film and freely copy it for their friends.
“Ideally, social media can function                      In either place, though, intellectual
as a really big focus group,” says Jeff                  property rights didn’t hold the same
Auker, a director in PwC’s Customer                      moral sway that they did in some
Impact practice. Enterprises, which                      other parts of the world,” Auker says.
spend billions on focus groups, spent
nearly $1.6 billion in 2011 on social                    This article explores the primary
media marketing, according to Forrester                  characteristics of NLP, which is the
Research. That number is expected to                     key to SMI, and how NLP is applied
grow to nearly $5 billion by 2016.1                      to social media analytics. The article
                                                         considers what’s in the realm of the
                                                         possible when mining social media
1	 Shar VanBoskirk, US Interactive Marketing Forecast,
   2011 To 2016, Forrester Research report, August 24,   text, and how informed human
   2011, http://www.forrester.com/rb/Research/us_        analysis becomes essential when
   interactive_marketing_forecast%2C_2011_to_2016/q/
   id/59379/t/2, accessed February 12, 2012.             interpreting the conversations that
                                                         machines are attempting to evaluate.


                                                         2	 PwC has joint business relationships with SocialRep,
                                                            ListenLogic, and some of the other vendors mentioned
                                                            in this publication.


	                                           Reshaping the workforce with the new analytics	                   45
Natural language processing:                 Types of NLP
                                             Its components and social                    NLP consists of several subareas of
                                             media applications                           computer-assisted language analysis,
                                             NLP technologies for SMI are just            ways to help scale the extraction of
                                             emerging. When used well, they serve         meaning from text or speech. NLP
                                             as a more targeted, semantically based       software has been used for several
                                             complement to pure statistical analysis,     years to mine data from unstructured
                                             which is more scalable and able to           data sources, and the software had its
                                             tackle much larger data sets. While          origins in the intelligence community.
                                             statistical analysis looks at the relative   During the past few years, the locus
                                             frequencies of word occurrences and          has shifted to social media intelligence
“It takes very rare                          the relationships between words,             and marketing, with literally
                                             NLP tries to achieve deeper insights         hundreds of vendors springing up.
  skill sets in the NLP                      into the meanings of conversations.
  community to figure                                                                     NLP techniques span a wide range,
                                             The best NLP tools can provide a level       from analysis of individual words and
  this stuff out. It’s                       of competitive advantage, but it’s a         entities, to relationships and events, to
  incredibly processing                      challenging area for both users and          phrases and sentences, to document-
                                             vendors. “It takes very rare skill sets      level analysis. (See Figure 1.) The
  and storage intensive,                     in the NLP community to figure this          primary techniques include these:
  and it takes awhile.                       stuff out,” Auker says. “It’s incredibly
                                             processing and storage intensive,            Word or entity (individual
  If you used pure NLP                       and it takes awhile. If you used pure        element) analysis
  to tell me everything                      NLP to tell me everything that’s
                                             going on, by the time you indexed all        •	 Word sense disambiguation—
  that’s going on, by the                    the conversations, it might be days             Identifies the most likely meaning of
  time you indexed all                       or weeks later. By then, the whole              ambiguous words based on context
                                             universe isn’t what it used to be.”             and related words in the text. For
  the conversations, it                                                                      example, it will determine if the word
  might be days or weeks                     First-generation social media monitoring        “bank” refers to a financial institution,
                                             tools provided some direct business             the edge of a body of water, the act of
  later. By then, the whole                  value, but they also left users with more       relying on something, or one of the
  universe isn’t what it                     questions than answers. And context was         word’s many other possible meanings.
                                             a key missing ingredient. Rick Whitney,
  used to be.”                               a director in PwC’s Customer Impact          •	 Named entity recognition
                                             practice, makes the following distinction       (NER)—Identifies proper nouns.
 —Jeff Auker, PwC                            between the first- and second-                  Capitalization analysis can help with
                                             generation SMI tools: “Without good             NER in English, for instance, but
                                             NLP, the first-generation tools don’t           capitalization varies by language
                                             give you that same context,” he says.           and is entirely absent in some.

                                             What constitutes good NLP is open            •	 Entity classification—Assigns
                                             to debate, but it’s clear that some             categories to recognized entities.
                                             of the more useful methods blend                For example, “John Smith” might
                                             different detailed levels of analysis           be classified as a person, whereas
                                             and sophisticated filtering, while              “John Smith Agency” might be
                                             others stay attuned to the full context         classified as an organization, or more
                                             of the conversations to ensure that             specifically “insurance company.”
                                             novel and interesting findings that
                                             inadvertently could be screened
                                             out make it through the filters.


46	   PwC Technology Forecast 2012 Issue 1
Figure 1: The varied paths to meaning in text analytics
Machines need to review many different kinds of clues to be able to deliver
meaningful results to users.


                                    Documents

                                                     Metadata      Words
      Lexical          Sentences
      graphs

                                                                       Social
                                                                       graphs


                                    Meaning


•	 Part of speech (POS) tagging—                about its competitors—even though
   Assigns a part of speech (such as            a single verb “blogged” initiated the
   noun, verb, or adjective) to every           two events. Event analysis can also
   word to form a foundation for                define relationships between entities
   phrase- or sentence-level analysis.          in a sentence or phrase; the phrase
                                                “Sally shot John” might establish
Relationship and event analysis                 a relationship between John and
                                                Sally of murder, where John is also
•	 Relationship analysis—Determines             categorized as the murder victim.
   relationships within and across
   sentences. For example, “John’s         •	 Co-reference resolution—Identifies
   wife Sally …” implies a symmetric          words that refer to the same entity.
   relationship of spouse.                    For example, in these two sentences—
                                              “John bought a gun. He fired the
•	 Event analysis—Determines the              gun when he went to the shooting
   type of activity based on the verb         range.”—the “He” in the second
   and entities that have been assigned       sentence refers to “John” in the first
   to a classification. For example,          sentence; therefore, the events in the
   an event “BlogPost” may have two           second sentence are about John.
   types associated with it—a blog post
   about a company versus a blog post


                                           	                                    Reshaping the workforce with the new analytics	   47
Syntactic (phrase and sentence               NLP applications require the use of
                                             construction) analysis                       several of these techniques together.
                                                                                          Some of the most compelling NLP
                                             •	 Syntactic parsing—Generates a parse       applications for social media analytics
                                                tree, or the structure of sentences and   include enhanced extraction, filtered
                                                phrases within a document, which          keyword search, social graph analysis,
                                                can lead to helpful distinctions at the   and predictive and sentiment analysis.
                                                document level. Syntactic parsing
                                                often involves the concept of sentence    Enhanced extraction
                                                segmentation, which builds on             NLP tools are being used to mine both
                                                tokenization, or word segmentation,       the text and the metadata in social
                                                in which words are discovered within      media. For example, the inTTENSITY
                                                a string of characters. In English and    Social Media Command Center (SMCC)
                                                other languages, words are separated      integrates Attensity Analyze with
                                                by spaces, but this is not true in some   Inxight ThingFinder—both established
                                                languages (for instance, Chinese).        tools—to provide a parser for social
                                                                                          media sources that include metadata
                                             •	 Language services—Range                   and text. The inTTENSITY solution
                                                from translation to parsing and           uses Attensity Analyze for predicate
                                                extracting in native languages.           analysis to provide relationship
                                                For global organizations, these           and event analysis, and it uses
                                                services are a major differentiator       ThingFinder for noun identification.
                                                because of the different techniques
                                                required for different languages.         Filtered keyword search
                                                                                          Many keyword search methods exist.
                                             Document analysis                            Most require lists of keywords to be
                                                                                          defined and generated. Documents
                                             •	 Summarization and topic                   containing those words are matched.
                                                identification—Summarizes (in the         WordStream is one of the prominent
                                                case of topic identification) in a few    tools in keyword search for SMI. It
                                                words the topic of an entire document     provides several ways for enterprises
                                                or subsection. Summarization, by          to filter keyword searches.
                                                contrast, provides a longer summary
                                                of a document or subsection.              Social graph analysis
                                                                                          Social graphs assist in the study
                                             •	 Sentiment analysis—Recognizes             of a subject of interest, such as a
                                                subjective information in a               customer, employee, or brand.
                                                document that can be used to              These graphs can be used to:
                                                identify “polarity” or distinguish
                                                between entirely opposite entities        •	 Determine key influencers in
                                                and topics. This analysis is often           each major node section
                                                used to determine trends in public
                                                opinion, but it also has other uses,      •	 Discover if one aspect of the brand
                                                such as determining confidence               needs more attention than others
                                                in facts extracted using NLP.
                                                                                          •	 Identify threats and opportunities
                                             •	 Metadata analysis—Identifies and             based on competitors and industry
                                                analyzes the document source, users,
                                                dates, and times created or modified.     •	 Provide a model for
                                                                                             collaborative brainstorming


48	   PwC Technology Forecast 2012 Issue 1
Many NLP-based social graph tools
extract and classify entities and
relationships in accordance with a
                                                              What constitutes good NLP is
defined ontology or graph. But some                           open to debate, but it’s clear
social media graph analytics vendors,
such as Nexalogy Environics, rely on
                                                              that some of the more useful
more flexible approaches outside                              methods blend different
standard NLP. “NLP rests upon what
we call static ontologies—for example,
                                                              detailed levels of analysis and
the English language represented in                           sophisticated filtering, while
a network of tags on about 30,000
concepts could be considered a static
                                                              others stay attuned to the full
ontology,” Claude Théoret, president                          context of the conversations.
of Nexalogy Environics, explains.
“The problem is that the moment
you hit something that’s not in the
ontology, then there’s no way of
figuring out what the tags are.”

In contrast, Nexalogy Environics
generates an ontology for each data
set, which makes it possible to capture
meaning missed by techniques that
are looking just for previously defined
terms. “That’s why our stuff is not                       change public attitudes about its
quite real time,” he says, “because                       products. “We had data on what products
the amount of number crunching                            people had from the competitors and
you have to do is huge and there’s no                     what people had products from this
human intervention whatsoever.” (For                      particular firm. And we also had some
an example of Nexalogy’s approach,                        survey data about attitudes that people
see the article, “The third wave of                       had toward the product. We were able
customer analytics,” on page 06.)                         to say something about what type of
                                                          people, according to demographic
Predictive analysis and early warning                     characteristics, had different attitudes.”
Predictive analysis can take many forms,
and NLP can be involved, or it might not                  Paich’s agent-based modeling
be. Predictive modeling and statistical                   effort matched attitudes with the
analysis can be used effectively without                  manufacturer’s product types. “We
the help of NLP to analyze a social                       calibrated the model on the basis of
network and find and target influencers                   some fairly detailed geographic data
in specific areas. Before he came to                      to get a sense as to whose purchases
PwC, Mark Paich, a director in the                        influenced whose purchases,” Paich
firm’s advisory service, did some agent-                  says. “We didn’t have direct data that
based modeling3 for a Los Angeles–                        said, ‘I influence you.’ We made some
based manufacturer that hoped to                          assumptions about what the network
                                                          would look like, based on studies of
                                                          who talks to whom. Birds of a feather
3	 Agent-based modeling is a means of understanding       flock together, so people in the same age
   the behavior of a system by simulating the behavior
   of individual actors, or agents, within that system.   groups who have other things in common
   For more on agent-based modeling, see the article
   “Embracing unpredictability” and the interview with
   Mark Paich, “Using simulation tools for strategic
   decision making,” in Technology Forecast 2010, Issue
   1, http://www.pwc.com/us/en/technology-forecast/
   winter2010/index.jhtml, accessed February 14, 2012.


                                                          	                               Reshaping the workforce with the new analytics	   49
tend to talk to each other. We got a                           Many companies mine social media to
                                             decent approximation of what a network                         determine who the key influencers are
                                             might look like, and then we were                              for a particular product. But mining
                                             able to do some statistical analysis.”                         the context of the conversations via
                                                                                                            interest graph analysis is important.
                                             That statistical analysis helped with                          “As Clay Shirky pointed out in 2003,
                                             the influencer targeting. According                            influence is only influential within
                                             to Paich, “It said that if you want to                         a context,” Théoret says.
                                             sell more of this product, here are the
                                             key neighborhoods. We identified                               Nearly all SMI products provide
                                             the key neighborhood census tracts                             some form of timeline analysis of
“Our models are built                        you want to target to best exploit                             social media traffic with historical
                                             the social network effect.”                                    analysis and trending predictions.
  on seeds from analysts
  with years of experience                   Predictive modeling is helpful when                            Sentiment analysis
                                             the level of specificity needed is high                        Even when overall social media traffic
  in each industry. We                       (as in the Los Angeles manufacturer’s                          is within expected norms or predicted
  can put in the word                        example), and it’s essential when                              trends, the difference between positive,
                                             the cost of a wrong decision is high.4                         neutral, and negative sentiment can
 ‘Escort’ or ‘Suburban,’                     But in other cases, less formal social                         stand out. Sentiment analysis can
  and then behind that                       media intelligence collection and                              suggest whether a brand, customer
                                             analysis are often sufficient. When it                         support, or a service is better or
  put a car brand such                       comes to brand awareness, NLP can                              worse than normal. Correlating
  as ‘Ford’ or ‘Chevy.’ The                  help provide context surrounding                               sentiment to recent changes in
                                             a spike in social media traffic about                          product assembly, for example,
  models combined could                      a brand or a competitor’s brand.                               could provide essential feedback.
  be strings of 250 filters
                                             That spike could be a key data point                           Most customer sentiment analysis
  of various types.”                         to initiate further action or research                         today is conducted only with statistical
                                             to remediate a problem before it gets                          analysis. Government intelligence
 —Vince Schiavone,                           worse or to take advantage of a market                         agencies have led with more advanced
 ListenLogic                                 opportunity before a competitor does.                          methods that include semantic analysis.
                                             (See the article, “The third wave of                           In the US intelligence community,
                                             customer analytics,” on page 06.)                              media intelligence generally provides
                                             Because social media is typically faster                       early indications of events important
                                             than other data sources in delivering                          to US interests, such as assessing
                                             early indications, it’s becoming a                             the impact of terrorist activities on
                                             preferred means of identifying trends.                         voting in countries the Unites States
                                                                                                            is aiding, or mining social media for
                                                                                                            early indications of a disease outbreak.
                                             4	 For more information on best practices for the use of       In these examples, social media
                                                predictive analytics, see Putting predictive analytics to   prove to be one of the fastest, most
                                                work, PwC white paper, January 2012, http://
                                                www.pwc.com/us/en/increasing-it-effectiveness/              accurate sources for this analysis.
                                                publications/predictive-analytics-to-work.jhtml,
                                                accessed February 14, 2012.


50	   PwC Technology Forecast 2012 Issue 1
Table 1: A few NLP best practices


 Strategy                  Description                                 Benefits

 Mine the                  Many tools monitor individual accounts.     Scalability and efficiency of the mining effort are essential.
 aggregated data.          Clearly enterprises need more than
                           individual account monitoring.

 Segment the               Regional segmentation, for instance,        Orkut is larger than Facebook in Brazil, for instance, and
 interest graph in         is important because of differences in      Qzone is larger in China. Global companies need global
 a meaningful way.         social media adoption by country.           social graph data.

 Conduct deep              Deep parsing takes advantage of a           Multiple extractors that use the best approaches in individual
 parsing.                  range of NLP extraction techniques          areas—such as verb analysis, sentiment analysis, named
                           rather than just one.                       entity recognition, language services, and so forth—provide
                                                                       better results than the all-in-one approach.

 Align internal models     After mining the data for social graph      With aligned customer models, enterprises can correlate
 to the social model.      clues, the implicit model that results      social media insights with logistics problems and shipment
                           should be aligned to the models used        delays, for example. Social media serves in this way as an
                           for other data sources.                     early warning or feedback mechanism.

 Take advantage of         Approaches outside the mainstream           Tools that take a bottom-up approach and surface more
 alternatives to           can augment mainstream tools.               flexible ontologies, for example, can reveal insights
 mainstream NLP.                                                       other tools miss.


NLP-related best practices                    •	 Direct concept filtering—Filtering
After considering the breadth of NLP,            based on the language of social media
one key takeaway is to make effective
use of a blend of methods. Too simple         •	 Ontological—Models describing
an approach can’t eliminate noise                specific clients and their product lines
sufficiently or help users get to answers
that are available. Too complicated an        •	 Action—Activity associated
approach can filter out information              with buyers of those products
that companies really need to have.
                                              •	 Persona—Classes of social
Some tools classify many different               media users who are posting
relevant contexts. ListenLogic, for
example, combines lexical, semantic,          •	 Topic—Discovery algorithms for
and statistical analysis, as well as models      new topics and topic focusing
the company has developed to establish
specific industry context. “Our models        Other tools, including those from
are built on seeds from analysts with         Nexalogy Environics, take a bottom-up
years of experience in each industry.         approach, using a data set as it comes
We can put in the word ‘Escort’ or            and, with the help of several proprie-
‘Suburban,’ and then behind that put          tary universally applicable algorithms,
a car brand such as ‘Ford’ or ‘Chevy,’”       processing it with an eye toward catego-
says Vince Schiavone, co-founder and          rization on the fly. Equally important,
executive chairman of ListenLogic.            Nexalogy’s analysts provide interpreta-
“The models combined could be strings         tions of the data that might not be evident
of 250 filters of various types.” The         to customers using the same tool. Both
models fall into five categories:             kinds of tools have strengths and weak-
                                              nesses. Table 1 summarizes some of the
                                              key best practices when collecting SMI.


                                              	                                  Reshaping the workforce with the new analytics	        51
Conclusion: A machine-assisted               statistical analysis to new levels, making
                                             and iterative process, rather                it possible to pair a commonly used
                                             than just processing alone                   phrase in one language with a phrase
                                             Good analysis requires consideration         in another based on some observation
                                             of a number of different clues and           of how frequently those phrases are
                                             quite a bit of back-and-forth. It’s not      used. So statistically based processing
                                             a linear process. Some of that process       is clearly useful. But it’s equally clear
                                             can be automated, and certainly it’s in      from seeing so many opaque social
                                             a company’s interest to push the level of    media analyses that it’s insufficient.
                                             automation. But it’s also essential not to
                                             put too much faith in a tool or assume       Structuring textual data, as with
                                             that some kind of automated service          numerical data, is important. Enterprises
                                             will lead to insights that are truly game    cannot get to the web of data if the data
                                             changing. It’s much more likely that the     is not in an analysis-friendly form—a
                                             tool provides a way into some far more       database of sorts. But even when
                                             extensive investigation, which could         something materializes resembling a
                                             lead to some helpful insights, which         better described and structured web,
                                             then must be acted upon effectively.         not everything in the text of a social
                                                                                          media conversation will be clear.
                                             One of the most promising aspects of         The hope is to glean useful clues and
                                             NLP adoption is the acknowledgment           starting points from which individuals
                                             that structuring the data is necessary to    can begin their own explorations.
                                             help machines interpret it. Developers
                                             have gone to great lengths to see how        Perhaps one of the more telling
                                             much knowledge they can extract with         trends in social media is the rise of
                                             the help of statistical analysis methods,    online word-of-mouth marketing
                                             and it still has legs. Search engine         and other similar approaches that
                                             companies, for example, have taken pure      borrow from anthropology. So-called
                                                                                          social ethnographers are monitoring
                                                                                          how online business users behave,
                                                                                          and these ethnographers are using
                                                                                          NLP-based tools to land them in a
  The tool provides a way into                                                            neighborhood of interest and help them
  some far more extensive                                                                 zoom in once there. The challenge is
                                                                                          how to create a new social science of
  investigation, which could                                                              online media, one in which the tools
  lead to some helpful insights,                                                          are integrated with the science.

  which then must be acted
  upon effectively.

                                       “As Clay Shirky pointed out
                                        in 2003, influence is only
                                        influential within a context.”
                                       —Claude Théoret, Nexalogy
                                          Environics


52	   PwC Technology Forecast 2012 Issue 1
An in-memory appliance
    to explore graph data
    YarcData’s uRiKA analytics appliance,1
    announced at O’Reilly’s Strata data
    science conference in March 2012, is
    designed to analyze the relationships
    between nodes in large graph data sets.
    To accomplish this feat, the system
    can take advantage of as much as
    512TB of DRAM and 8,192 processors
    with over a million active threads.

    In-memory appliances like these allow
    very large data sets to be stored and                  But mining graph data, as YarcData
    analyzed in active or main memory,                     (a unit of Cray) explains, demands
    avoiding memory swapping to disk                       a system that can process graphs
    that introduces lots of latency. It’s                  without relying on caching, because
    possible to load full business intelligence            mining graphs requires exploring
    (BI) suites, for example, into RAM to                  many alternative paths individually
    speed up the response time as much                     with the help of millions of threads—
    as 100 times. (See “What in-memory                     a very memory- and processor-
    technology does” on page 33 for more                   intensive task. Putting the full graph
    information on in-memory appliances.)                  in a single random access memory
    With compression, it’s apparent that                   space makes it possible to query it and
    analysts can query true big data (data                 retrieve results in a timely fashion.
    sets of greater than 1PB) directly in main
    memory with appliances of this size.                   The first customers for uRiKA are
                                                           government agencies and medical
    Besides the sheer size of the system,                  research institutes like the Mayo Clinic,
    uRiKA differs from other appliances                    but it’s evident that social media
    because it’s designed to analyze graph                 analytics developers and users would
    data (edges and nodes) that take the                   also benefit from this kind of appliance.
    form of subject-verb-object triples.                   Mining the social graph and the larger
    This kind of graph data can describe                   interest graph (the relationships
    relationships between people, places,                  between people, places, and things)
    and things scalably. Flexible and richly               is just beginning.3 Claude Théoret
    described data relationships constitute                of Nexalogy Environics has pointed
    an additional data dimension users can                 out that crunching the relationships
    mine, so it’s now possible, for example,               between nodes at web scale hasn’t
    to query for patterns evident in the                   previously been possible. Analyzing
    graphs that aren’t evident otherwise,                  the nodes themselves only goes so far.
    whether unknown or purposely hidden.2


1	 The YarcData uRiKA Graph Appliance: Big Data            3	 See “The collaboration paradox,” Technology Forecast
   Relationship Analytics, Cray white paper, http://www.      2011, Issue 3, http://www.pwc.com/us/en/technology-
   yarcdata.com/productbrief.html, March 2012, accessed       forecast/2011/issue3/features/feature-social-
   April 3, 2012.                                             information-paradox.jhtml#, for more information on the
                                                              interest graph.
2	 Michael Feldman, “Cray Parlays Supercomputing
   Technology Into Big Data Appliance,” Datanami,
   March 2, 2012, http://www.datanami.com/
   datanami/2012-03-02/cray_parlays_supercomputing_
   technology_into_big_data_appliance.html, accessed
   April 3, 2012.


	                                           Reshaping the workforce with the new analytics	                      53
PwC: When did you come


The payoff from
                                                                                          to Tableau Software?
                                                                                          JM: I came to Tableau in 2004 out of
                                                                                          the research world. I spent a long time

interactive
                                                                                          at Xerox Palo Alto Research Center
                                                                                          working with some excellent people—
                                                                                          Stuart Card and George Robertson, who

visualization                                                                             are both recently retired. We worked
                                                                                          in the area of data visualization for a
                                                                                          long time. Before that, I was at Stanford
Jock Mackinlay of Tableau Software                                                        University and did a PhD in the same
discusses how more of the workforce                                                       area—data visualization. I received
                                                                                          a Technical Achievement Award for
has begun to use analytics tools.                                                         that entire body of work from the
                                                                                          IEEE organization in 2009. I’m one
Interview conducted by Alan Morrison                                                      of the lucky few people who had the
                                                                                          opportunity to take his research out into
                                                                                          the world into a successful company.

                                               Jock Mackinlay                             PwC: Our readers might
                                               Jock Mackinlay is the director of visual   appreciate some context on
                                               analysis at Tableau Software.              the whole area of interactive
                                                                                          visualization. Is the innovation
                                                                                          in this case task automation?
                                                                                          JM: There’s a significant limit to
                                                                                          how we can automate. It’s extremely
                                                                                          difficult to understand what a person’s
                                                                                          task is and what’s going on in their
                                                                                          head. When I finished my dissertation,
                                                                                          I chose a mixture of automated
                                                                                          techniques plus giving humans a lot
                                                                                          of power over thinking with data.

                                                                                          And that’s the Tableau philosophy
                                                                                          too. We want to provide people with
                                                                                          good defaulting as best we can but
                                                                                          also make it easy for people to make
                                                                                          adjustments as their tasks change.
                                                                                          When users are in the middle of looking
                                                                                          at some data, they might change their
                                                                                          minds about what questions they’re
                                                                                          asking. They need to head toward
                                                                                          that new question on the fly. No
                                                                                          automated system is going to keep up
                                                                                          with the stream of human thought.


54	     PwC Technology Forecast 2012 Issue 1
“No amount of pre-computation or work
                                          by an IT department is going to be able to
                                          anticipate all the possible ways people might
                                          want to work with data. So you need to have
                                          a flexible, human-centered approach.”


PwC: Humans often don’t know             you see the fields on the side. You can      PwC: Are there categories of
themselves what question they’re         drag out the fields and drop them            more structured data that would
ultimately interested in.                on row, column, color, size, and so          lend themselves to this sort of
JM: Yes, it’s an iterative exploration   forth. And then the tool generates           approach? Most of this data
process. You cannot know up front        the graphical views, so users can            presumably has been processed
what question a person may want to ask   see the data visualization. They’re          to the point where it could be
today. No amount of pre-computation      probably familiar with their data.           fed into Tableau relatively
or work by an IT department is           Most people are if they’re working           easily and then worked with
going to be able to anticipate all the   with data that they care about.              once it’s in the visual form.
possible ways people might want to                                                    JM: At a high level, that’s accurate.
work with data. So you need to have      The graphical view by default codifies       One of the other key innovations of the
a flexible, human-centered approach      the best practices for putting data in the   dissertation out of Stanford by Chris
to give people a maximal ability to      view. For example, if the user dragged       Stolte and Pat Hanrahan was that they
take advantage of data in their jobs.    out a profit and date measure, because       built a system that could compile those
                                         it’s a date field, we would automatically    algebraic expressions into queries on
PwC: What did your research              generate a line mark and give that user      databases. So Tableau is good with any
uncover that helps?                      a trend line view because that’s best        information that you would find in a
JM: Part of the innovation of the        practice for profit varying over time.       database, both SQL databases and MDX
dissertation at Stanford was that the                                                 databases. Or, in other words, both
algebra enables a simple drag-and-       If instead they dragged out product and      relational databases and cube databases.
drop interface that anyone can use.      profit, we would give them a bar graph
They drag fields and place them in       view because that’s an appropriate           But there is other data that doesn’t
rows and columns or whatnot. Their       way to show that information. If they        necessarily fall into that form. It is just
actions actually specify an algebraic    selected a geographic field, they’ll         data that’s sitting around in text files or
expression that gets compiled into       get a map view because that’s an             in spreadsheets and hasn’t quite got into
a query database. But they don’t         appropriate way to show geography.           a database. Tableau can access that data
need to know all that. They just need                                                 pretty well if it has a basic table structure
to know that they suddenly get to        We work hard to make it a rapid              to it. A couple of releases ago, we
see their data in a visual form.         exploration process, because not only        introduced what we call data blending.
                                         are tables and numbers difficult for
PwC: One of the issues we run            humans to process, but also because          A lot of people have lots of data in
into is that user interfaces are         a slow user experience will interrupt        lots of databases or tables. They
often rather cryptic. Users must         cognition and users can’t answer the         might be text files. They might be
be well versed in the tool from the      questions. Instead, they’re spending         Microsoft Access files. They might
designer’s perspective. What have        the time trying to make the tool work.       be in SQL or Hyperion Essbase. But
you done to make it less cryptic,                                                     whatever it is, their questions often
to make what’s happening more            The whole idea is to make the tool           span across those tables of data.
explicit, so that users don’t            an extension of your hand. You don’t
present results that they think          think about the hammer. You just think
are answering their questions            about the job of building a house.
in some way but they’re not?
JM: The user experience in Tableau
is that you connect to your data and


                                         	                                Reshaping the workforce with the new analytics	       55
Normally, the way to address that is to         other, which we call grouping. At a                          data about the lenders, their location,
create a federated database that joins          fundamental level, it’s a way you can                        the amount, and the borrower right
the tables together, which is a six-month       build up a hierarchical structure out of a                   down to their photographs. And we
or greater IT effort. It’s difficult to query   flat dimension easily by grouping fields                     built a graphical view in Tableau. We
across multiple data tables from multiple       together. We also have some lightweight                      sliced and diced it first and then built
databases. Data blending is a way—in            support for supporting those hierarchies.                    some graphical views for the demo.
a lightweight drag-and-drop way—to
bring in data from multiple sources.            We’ve also connected Tableau to                              The key problem about it from a human
                                                Hadoop. Do you know about it?                                performance point of view is that there’s
Imagine you have a spreadsheet that                                                                          high latency. It takes a long time for
you’re using to keep track of some              PwC: We wrote about Hadoop                                   the programs to run and process the
information about your products,                in 2010. We did a full issue                                 data. We’re interested in helping people
and you have your company-wide                  on it as a matter of fact.1                                  answer their questions at the speed of
data mart that has a lot of additional          JM: We’re using a connector to                               their thought. And so latency is a killer.
information about those products.               Hadoop that Cloudera built that
And you want to combine them. You               allows us to write SQL and then access                       We used the connection to process the
can direct connect Tableau to the data          data via the Hadoop architecture.                            XML file and build a Tableau extract
mart and build a graphical view.                                                                             file. That file runs on top of our data
                                                In particular, whenever we do demos                          engine, which is a high-performance
Then you can connect to your                    on stage, we like to look for real data                      columnar database system. Once we had
spreadsheet, and maybe you build                sets. We found one from Kiva, the                            the data in the Tableau extract format,
a view about products. Or maybe                 online micro-lending organization.                           it was drag and drop at human speed.
you have your budget in your                    Kiva published the huge XML file
spreadsheet and you would like                  describing all of the organization’s                         We’re heading down this vector, but
compare the actuals to the budget               lenders and all of the recipients                            this is where we are right now in terms
you’re keeping in your spreadsheet.             of the loans. This is an XML file,                           of being able to process less-structured
It’s a simple drag-and-drop operation           so it’s not your normal structured                           information into a form that you could
or a simple calculation to do that.             data set. It’s also big, with multiple                       then use Tableau on effectively.
                                                years and lots of details for each.
So, you asked me this big question                                                                           PwC: Interesting stuff. What
about structured to unstructured data.          We processed that XML file in Hadoop                         about in-memory databases
                                                and used our connector, which has                            and how large they’re getting?
PwC: That’s right.                              string functions. We used those string                       JM: Anytime there’s a technology that
JM: We have functionality that allows           functions to reach inside the XML and                        can process data at fast rates, whether
you to generate additional structure            pull out what would be all the structured                    it’s in-memory technology, columnar
for data that you might have brought                                                                         databases, or what have you, we’re
in. One of the features gives you the                                                                        excited. From its inception, Tableau
                                                1	 See “Making sense of Big Data,” Technology Forecast
ability—in a lightweight way—to                    2010, Issue 3, http://www.pwc.com/us/en/technology-
combine fields that are related to each            forecast/2010/issue3/index.jhtml, for more information.


56	      PwC Technology Forecast 2012 Issue 1
involved direct connecting to databases    easier to use. I love that I have authentic
and making it easy for anybody to be       users all over the company and I can
able to work with it. We’re not just       ask them, “Would this feature help?”
about self-analytics; we’re also about
data storytelling. That can have as        So yes, I think the focus on the workforce
much impact on the executive team          is essential. The trend here is that data
as directly being able themselves          is being collected by our computers
to answer their own questions.             almost unmanned, no supervision
                                           necessary. It’s the process of utilizing
PwC: Is more of the workforce              that data that is the game changer. And
doing the analysis now?                    the only way you’re going to do that
JM: I just spent a week at the             is to put the data in the hands of the
Tableau Customer Conference,               individuals inside your organization.
and the people that I meet are
extremely diverse. They’re not just
the hardcore analysts who know
about SPSS and R. They come from
all different sizes of companies               “A lot of people have lots of data in
and nonprofits and on and on.
                                                lots of databases or tables. They
And the people at the customer                  might be text files. They might be
conferences are pretty passionate.
I think part of the passion is the              Microsoft Access files. They might
realization that you can actually work          be in SQL or Hyperion Essbase. But
with data. It doesn’t have to be this
horribly arduous process. You can               whatever it is, their questions often
rapidly have a conversation with your           span across those tables of data.”
data and answer your questions.

Inside Tableau, we use Tableau
everywhere—from the receptionist
who’s tracking utilization of all the
conference rooms to the sales team
that’s monitoring their pipeline. My
major job at Tableau is on the team that
does forward product direction. Part
of that work is to make the product


                                           	                                 Reshaping the workforce with the new analytics	   57
Palm tree nursery. Palm oil is being tested to be
used in aviation fuel


     58	      PwC Technology Forecast 2012 Issue 1
How CIOs can build
the foundation for a
data science culture
Helping to establish a new culture of
inquiry can be a way for these executives to
reclaim a leadership role in information.
By Bud Mathaisel and Galen Gruman


The new analytics requires that CIOs        Whatever the reasons, CIOs must rise
and IT organizations find new ways to       above them and find ways to provide
engage with their business partners.        important capabilities for new analytics
For all the strategic opportunities new     while enjoying the thrill of analytics
analytics offers the enterprise, it also    discovery, if only vicariously. The IT
threatens the relevance of the CIO. The     organization can become the go-to
threat comes from the fact that the CIO’s   group, and the CIO can become the
business partners are being sold data       true information leader. Although it is
analytics services and software outside     a challenge, the new analytics is also
normal IT procurement channels,             an opportunity because it is something
which cuts out of the process the very      within the CIO’s scope of responsibility
experts who can add real value.             more than nearly any other development
                                            in information technology.
Perhaps the vendors’ user-centric view
is based on the premise that only users     The new analytics needs to be treated
in functional areas can understand          as a long-term collaboration between
which data and conclusions from its         IT and business partners—similar to
analysis are meaningful. Perhaps the        the relationship PwC has advocated1
CIO and IT have not demonstrated            for the general consumerization-of-IT
the value they can offer, or they have      phenomenon invoked by mobility,
dwelled too much on controlling             social media, and cloud services. This
security or costs to the detriment of       tight collaboration can be a win for
showing the value IT can add. Or            the business and for the CIO. The
perhaps only the user groups have the       new analytics is a chance for the CIO
funding to explore new analytics.           to shine, reclaim the “I” leadership
                                            in CIO, and provide a solid footing
                                            for a new culture of inquiry.


                                            1	 The consumerization of IT: The next-generation CIO,
                                               PwC white paper, November 2011, http://
                                               www.pwc.com/us/en/technology-innovation-center/
                                               consumerization-information-technology-transforming-
                                               cio-role.jhtml, accessed February 1, 2012.


	                               Reshaping the workforce with the new analytics	                 59
The many ways for CIOs to                   E. & J. Gallo Winery takes this
                                             be new analytics leaders                    approach. Its senior management
                                             In businesses that provide information      understood the need for detailed
                                             products or services—such as                customer analytics. “IT has partnered
                                             healthcare, finance, and some utilities—    successfully with Gallo’s marketing,
                                             there is a clear added value from having    sales, R&D, and distribution to
                                             the CIO directly contribute to the use      leverage the capabilities of information
                                             of new analytics. Consider Edwards          from multiple sources. IT is not the
                                             Lifesciences, where hemodynamic             focus of the analytics; the business
                                             (blood circulation) modeling has            is,” says Kent Kushar, Gallo’s CIO.
                                             benefited from the convergence of           “After working together with the
                                             new data with new tools to which            business partners for years, Gallo’s
                                             the CIO contributes. New digitally          IT recently reinvested heavily in
                                             enabled medical devices, which are          updated infrastructure and began
                                             capable of generating a continuous          to coalesce unstructured data with
                                             flow of data, provide the opportunity       the traditional structured consumer
                                             to measure, analyze, establish pattern      data.” (See “How the E. & J. Gallo
                                             boundaries, and suggest diagnoses.          Winery matches outbound shipments
                                                                                         to retail customers” on page 11.)
                                             “In addition, a personal opportunity
                                             arises because I get to present our         Regardless of the CIO’s relationship
                                             newest product, the EV1000, directly to     with the business, many technical
                                             our customers alongside our business        investments IT makes are the
“IT has partnered                            team,” says Ashwin Rangan, CIO of           foundation for new analytics. A CIO
 successfully with Gallo’s                   Edwards Lifesciences. Rangan leverages      can often leverage this traditional
                                             his understanding of the underlying         role to lead new analytics from
 marketing, sales, R&D,                      technologies, and, as CIO, he helps         behind the scenes. But doing even
 and distribution to                         provision the necessary information         that—rather than leading from the
                                             infrastructure. As CIO, he also has         front as an advocate for business-
 leverage the capabilities                   credibility with customers when he          valuable analytics—demands new
 of information from                         talks to them about the information         skills, new data architectures,
                                             capabilities of Edwards’ products.          and new tools from IT.
 multiple sources. IT
 is not the focus of the                     For CIOs whose businesses are not in        At Ingram Micro, a technology
                                             information products or services, there’s   distributor, CIO Mario Leone views
 analytics; the business is.”                still a reason to engage in the new         a well-integrated IT architecture as
                                             analytics beyond the traditional areas      a critical service to business partners
 —Kent Kushar,                               of enablement and of governance, risk,      to support the company’s diverse and
  E. & J. Gallo Winery                       and compliance (GRC). That reason           dynamic sales model and what Ingram
                                             is to establish long-term relationships     Micro calls the “frontier” analysis
                                             with the business partners. In this         of distribution logistics. “IT designs
                                             partnership, the business users decide      the modular and scalable backplane
                                             which analytics are meaningful,             architecture to deliver real-time and
                                             and the IT professionals consult            relevant analytics,” he says. On one
                                             with them on the methods involved,          side of the backplane are multiple
                                             including provisioning the data and         data sources, primarily delivered
                                             tools. These CIOs may be less visible       through partner interactions; on the
                                             outside the enterprise, but they            flip side of the backplane are analytics
                                             have a crucial role to play internally      tools and capabilities, including such
                                             to jointly explore opportunities for
                                             analytics that yield useful results.


60	   PwC Technology Forecast 2012 Issue 1
Figure 1: A CIO’s situationally specific roles


                  CIO #1
                  Focuses on inputs when
                  production innovation, for
                  example, is at a premium.


                                   I                       O       Marketing
                                   N                       U
                                   P                       T         Sales
       Multiple                                            P
          data                     U     Backplane
                                   T                       U
       sources                     S                       T         Distribution
                                                           S
                                                                   Research and
                                                                   development


                                                   CIO #2
                                                   Focuses on outputs when sales
                                                   or marketing, for example, is
                                                   the major concern.


new features as pattern recognition,           Enable the data scientist
optimization, and visualization. Taken         One course of action is to strategically
together, the flow of multiple data            plan and provision the data and
streams from different points and              infrastructure for the new sources
advanced tools for business users              of data and new tools (discussed
can permit more sophisticated and              in the next section). However, the
iterative analyses that give greater           bigger challenge is to invoke the
insight to product mix offerings,              productive capability of the users. This
changing customer buying patterns,             challenge poses several questions:
and electronic channel delivery
preferences. The backplane is a                •	 How can CIOs do this without
convergence point of those data into a            knowing in advance which users
coherent repository. (See Figure 1.)              will harvest the capabilities?

Given these multiple ways for CIOs             •	 Analytics capabilities have been
to engage in the new analytics—                   pursued for a long time, but several
and the self-interest for doing so—               hurdles have hindered the attainment
the next issue is how to do it. After             of the goal (such as difficult-to-use
interviewing leading CIOs and                     tools, limited data, and too much
other industry experts, PwC offers                dependence on IT professionals).
the following recommendations.                    CIOs must ask: which of these
                                                  impediments are eased by the new
                                                  capabilities and which remain?


                                               	                                    Reshaping the workforce with the new analytics	   61
•	 As analytics moves more broadly          Gallo has tasked statisticians in IT, R&D,
                                                through the organization, there may      sales, and supply chain to determine
                                                be too few people trained to analyze     what information to analyze, the
                                                and present data-driven conclusions.     questions to ask, the hypotheses to test,
                                                Who will be fastest up the learning      and where to go after that, Kushar says.
                                                curve of what to analyze, of how
                                                to obtain and process data, and of       The CIO has the opportunity to help
                                                how to discover useful insights?         identify the skills needed and then
                                                                                         help train and support data scientists,
                                             What the enterprise needs is the data       who may not reside in IT. CIOs should
                                             scientist—actually, several of them.        work with the leaders of each business
                                             A data scientist follows a scientific       function to answer the questions:
                                             method of iterative and recursive           Where would information insights pay
                                             analysis, with a practical result in        the highest dividends? Who are the
                                             mind. Examples are easy to identify:        likely candidates in their functions to
                                             an outcome that improves revenue,           be given access to these capabilities,
                                             profitability, operations or supply chain   as well as the training and support?
                                             efficiency, R&D, financing, business
                                             strategy, the use of human capital,         Many can gain or sharpen analytic skills.
                                             and so forth. There is no sure way of       The CIO is in the best position to ensure
                                             knowing in advance where or when            that the skills are developed and honed.
                                             this insight will arrive, so it cannot
                                             be tackled in assembly line fashion         The CIO must first provision the
Josée Latendresse of                         with predetermined outcomes.                tools and data, but the data analytics
Latendresse Groupe                                                                       requires the CIO and IT team to
                                             The analytic approach involves trial and    assume more responsibility for the
Conseil says one of her                      error and accepts that there will be dead   effectiveness of the resources than in
clients, an apparel                          ends, although a data scientist can even    the past. Kushar says Gallo has a team
                                             draw a useful conclusion—“this doesn’t      within IT dedicated to managing and
manufacturer based in                        work”—from a dead end. Even without         proliferating business intelligence
Quebec, has been hiring                      formal training, some business users        tools, training, and processes.
                                             have the suitable skills, experience,
PhDs to serve in the data                    and mind-set. Others need to be             When major systems were deployed
science function.                            trained and encouraged to think like a      in the past, CIOs did their best to train
                                             scientist but behave like a—choose the      users and support them, but CIOs
                                             function—financial analyst, marketer,       only indirectly took responsibility
                                             sales analyst, operations quality           for the users’ effectiveness. In data
                                             analyst, or whatever. When it comes         analytics, the responsibility is more
                                             to repurposing parts of the workforce,      directly correlated: the investments
                                             it’s important to anticipate obstacles or   are not worth making unless IT steps
                                             frequent objections and consider ways       up to enhance the users’ performance.
                                             to overcome them. (See Table 1.)            Training should be comprehensive
                                                                                         and go beyond teaching the tools to
                                             Josée Latendresse of Latendresse            helping users establish an hypothesis,
                                             Groupe Conseil says one of her clients,     iteratively discover and look for insights
                                             an apparel manufacturer based in            from results that don’t match the
                                             Quebec, has been hiring PhDs to serve       hypothesis, understand the limitations
                                             in this function. “They were able to        of the data, and share the results with
                                             know the factors and get very, very fine    others (crowdsourcing, for example)
                                             analysis of the information,” she says.     who may see things the user does not.


62	   PwC Technology Forecast 2012 Issue 1
Table 1: Barriers to adoption of analytics and ways to address them


 Barrier                                          Solution

 Too difficult to use                             Ensure the tool and data are user friendly; use published application programming
                                                  interfaces (APIs) against data warehouses; seed user groups with analytics-trained
                                                  staff; offer frequent training broadly; establish an analytics help desk.

 Refusal to accept facts and resulting            Require a 360-degree perspective and pay attention to dissenters; establish a culture
 analysis, thereby discounting analytics          of fact finding, inquiry, and learning.

 Lack of analytics incentives and                 Make contributions to insights from analytics an explicit part of performance reviews;
 performance review criteria                      recognize and reward those who creatively use analytics.


Training should encompass multiple            insights that would translate to
tools, since part of what enables             improved marketing, increased sales,
discovery is the proper pairing of tool,      improved customer relationships, and
person, and problem; these pairings           more effective business operations.
vary from problem to problem and
person to person. You want a toolset to       Because most enterprises have been
handle a range of analytics, not a single     frustrated by the lack of clear payoffs
tool that works only in limited domains       from large investments in data analysis,
and for specific modes of thinking.           they may be tempted to treat the
                                              new analytics as not really new. This
The CIO could also establish and              would be a mistake. As with most
reinforce a culture of information            developments in IT, there is something
inquiry by getting involved in data           old, something new, something
analysis trials. This involvement lends       borrowed, and possibly something blue
direct and moral support to some              in the new analytics. Not everything is
of the most important people in the           new, but that doesn’t justify treating
organization. For CIOs, the bottom line       the new analytics as more of the
is to care for the infrastructure but focus   same. In fact, doing so indicates that
more on the actual use of information         your adoption of the new analytics is
services. Advanced analytics is adding        merely applying new tools and perhaps
insight and power to those services.          personnel to your existing activities.
                                              It’s not the tool per se that solves
Renew the IT infrastructure                   problems or finds insights—it’s the
for the new analytics                         people who are able to explore openly
As with all IT investments, CIOs              and freely and to think outside the box,
are accountable for the payback               aided by various tools. So don’t just
from analytics. For decades, much             re-create or refurbish the existing box.
time and money has been spent on
data architectures; identification of         Even if the CIO is skeptical and believes
“interesting” data; collecting, filtering,    analytics is in a major hype cycle,
storing, archiving, securing, processing,     there is still reason to engage. At the
and reporting data; training users;           very least, the new analytics extends
and the associated software and               IT’s prior initiatives; for example,
hardware in pursuit of the unique             the new analytics makes possible


                                              	                                    Reshaping the workforce with the new analytics	         63
the kind of analytics your company          Develop the new analytics
                                             has needed for decades to enhance           strategic plan
                                             business decisions, such as complex,        As always, the CIO should start with
                                             real-time events management, or it          a strategic plan. Gallo’s Kushar refers
                                             makes possible new, disruptive business     to the data analytics specific plan as
                                             opportunities, such as the on-location      a strategic plan for the “enterprise
                                             promotion of sales to mobile shoppers.      information fabric,” a reference to all
                                                                                         the crossover threads that form an
                                             Given limited resources, a portfolio        identifiable pattern. An important
                                             approach is warranted. The portfolio        component of this fabric is the
                                             should encompass many groups in the         identification of the uses and users that
                                             enterprise and the many functions they      have the highest potential for payback.
                                             perform. It also should encompass the       Places to look for such payback include
                                             convergence of multiple data sources        areas where the company has struggled,
                                             and multiple tools. If you follow           where traditional or nontraditional
                                             Ingram Micro’s backplane approach,          competition is making inroads, and
                                             you get the data convergence side of        where the data has not been available
                                             the backplane from the combination          or granular enough until now.
                                             of traditional information sources
                                             with new data sources. Traditional          The strategic plan must include the
                                             information sources include structured      data scientist talent required and the
                                             transaction data from enterprise            technologies in which investments
                                             resource planning (ERP) and customer        need to be made, such as hardware and
                                             relationship management (CRM)               software, user tools, structured and
                                             systems; new data sources include           unstructured data sources, reporting
                                             textual information from social media,      and visualization capabilities, and
                                             clickstream transactions, web logs,         higher-capacity networks for moving
                                             radio frequency identification (RFID)       larger volumes of data. The strategic
                                             sensors, and other forms of unstructured    planning process brings several benefits:
                                             and/or disparate information.               it updates IT’s knowledge of emerging
                                                                                         capabilities as well as traditional
                                             The analytics tools side of the backplane   and new vendors, and it indirectly
                                             arises from the broad availability of       informs prospective vendors that the
                                             new tools and infrastructure, such as       CIO and IT are not to be bypassed.
                                             mobile devices; improved in-memory          Once the vendor channels are known
                                             systems; better user interfaces             to be open, the vendors will come.
                                             for search; significantly improved
                                             visualization technologies; improved        Criteria for selecting tools may vary
                                             pattern recognition, optimization, and      by organization, but the fundamentals
                                             analytics software; and the use of the      are the same. Tools must efficiently
                                             cloud for storing and processing. (See      handle larger volumes within acceptable
                                             the article, “The art and science of new    response times, be friendly to users and IT
                                             analytics technology,” on page 30.)         support teams, be sound technically, meet
                                                                                         security standards, and be affordable.
                                             Understanding what remains the
                                             same and what is new is a key to            The new appliances and tools could
                                             profiting from the new analytics.           each cost several millions of dollars, and
                                             Even for what remains the same,             millions more to support. The good news
                                             additional investments are required.        is some of the tools and infrastructure
                                                                                         can be rented through the cloud, and
                                                                                         then tested until the concepts and


64	   PwC Technology Forecast 2012 Issue 1
You want a toolset to handle a
                                                                           range of analytics, not a single
                                                                           tool that works only in limited
                                                                           domains and for specific
                                                                           modes of thinking.


super-users have demonstrated their          business partners are changing
potential. (See the interview with Mike      or extending the following:
Driscoll on page 20.) “All of this doesn’t
have to be done in-house with expensive      •	 Data sources to include the traditional
computing platforms,” says Edwards’             enterprise structured information
Rangan. “You can throw it in the cloud          in core systems such as ERP, CRM,
… without investing in tremendous               manufacturing execution systems,
capital-intensive equipment.”                   and supply chain, plus newer sources
                                                such as syndicated data (point of sale,
With an approved strategy, CIOs                 Nielsen, and so on) and unstructured
can begin to update the IT internal             data from social media and other
capabilities. At a minimum, IT must             sources—all without compromising
first provision the new data, tools, and        the integrity of the production
infrastructure, and then ensure the IT          systems or their data and while
team is up to speed on the new tools            managing data archives efficiently.
and capabilities. Gallo’s IT organization,
for example, recently reinvested             •	 Appliances to include faster
heavily in new appliances; system               processing and better in-memory
architecture; extract, transform, and           caching. In-memory caching
load (ETL) tools; and ways in which             improves cycle time significantly,
SQL calls were written, and then began          enabling information insights to
to coalesce unstructured data with the          follow human thought patterns
traditional structured consumer data.           closer to their native speeds.

Provision data, tools,                       •	 Software to include newer
and infrastructure                              data management, analysis,
The talent, toolset, and infrastructure         reporting, and visualization
are prerequisites for data analytics.           tools—likely multiple tools, each
In the new analytics, CIOs and their            tuned to a specific capability.


                                             	                                Reshaping the workforce with the new analytics	   65
•	 Data architectures and flexible            to meet the increased demands for
                                                metadata to accommodate multiple           technical support. IT will need new
                                                streams of multiple types of data          skills and capabilities that include:
                                                stored in multiple databases. In
                                                this environment, a single database        •	 Broader access to all relevant
                                                architecture is unworkable.                   types of data, including data from
                                                                                              transaction systems and new sources
                                             •	 A cloud computing strategy that
                                                factors in the requirements of newly       •	 Broader use of nontraditional
                                                expanded analytics capability and how         resources, such as big data
                                                best to tap external as well as internal      analytics services
                                                resources. Service-level expectations
                                                should be established for customers        •	 Possible creation of specialized
                                                to ensure that these expanded                 databases and data warehouses
                                                sources of relevant data are always
                                                online and available in real time.         •	 Competence in new tools and
                                                                                              techniques, such as database
                                             The adoption of new analytics is                 appliances, column and row
                                             an opportunity for IT to augment                 databases, compression techniques,
                                             or update the business’s current                 and NoSQL frameworks
                                             capabilities. According to Kushar,
                                             Gallo IT’s latest investments are             •	 Support in the use of tools for
                                             extensions of what Gallo wanted to               reporting and visualization
                                             do 25 years ago but could not due to
                                             limited availability of data and tools.       •	 Updated approaches for mobile
                                                                                              access to data and analytic results
                                             Of course, each change requires a new
                                             response from IT, and each raises the         •	 New rules and approaches
                                             perpetual dilemma of how to be selective         to data security
                                             with investments (to conserve funds)
                                             while being as broad and heterogeneous        •	 Expanded help desk services
                                             as possible so a larger population
                                             can create analytic insights, which           Without a parallel investment in
                                             could come from almost anywhere.              IT skills, investments in tools and
                                                                                           infrastructure could lie fallow, causing
                                             Update IT capabilities:                       frustrated users to seek outside help.
                                             Leverage the cloud’s capacity                 For example, without advanced
                                             With a strategic plan in place and the        compression and processing techniques,
                                             tools provisioned, the next prerequisite      performance becomes a significant
                                             is to ensure that the IT organization is      problem as databases grow larger and
                                             ready to perform its new or extended          more varied. That’s an IT challenge
                                             job. One part of this preparation             that users would not anticipate, but
                                             is the research on tools the team             it could result in a poor experience
                                             needs to undertake with vendors,              that leads them to third parties that
                                             consultancies, and researchers.               have solved the issue (even if the users
                                                                                           never knew what the issue was).
                                             The CIO should consider some
                                             organizational investments to add
                                             to the core human resources in IT,
                                             because once the business users
                                             get traction, IT must be prepared


66	   PwC Technology Forecast 2012 Issue 1
Most of the IT staff will welcome              Enabling the productive use of
the opportunities to learn new tools           information tools is not a new obligation
and help support new capabilities,             for the CIO, but the new analytics
even if the first reaction might be            extends that obligation—in some
to fret over any extra work. CIOs              cases, hyperextends it. Fulfilling that
must lead this evolution by being              obligation requires the CIO to partner
a source for innovation and trends             with human resources, sales, and
in analytics, encouraging adoption,            other functional groups to establish
having the courage to make the                 the analytics credentials for knowledge
investments, demonstrating trust in            workers and to take responsibility
IT teams and users, and ensuring that          for their success. The CIO becomes
execution matches the strategy.                a teacher and role model for the
                                               increasing number of data engineers,
Conclusion                                     both the formal and informal ones.
Data analytics is no longer an obscure
science for specialists in the ivory tower.    Certainly, IT must do its part to plan
Increasingly more analytics power is           and provision the raw enabling
available for more people. Thanks to           capabilities and handle GRC, but
these new analytics, business users have       more than ever, data analytics is the
been unchained from prior restrictions,        opportunity for the CIO to move out
and finding answers is easier, faster,         of the data center and into the front
and less costly. Developing insightful,        office. It is the chance for the CIO to
actionable analytics is a necessary skill      demonstrate information leadership.
for every knowledge worker, researcher,
consumer, teacher, and student. It is
driven by a world in which faster insight
is treasured, and it often needs to be real
time to be most effective. Real-time data
that changes quickly invokes a quest                                 Developing insightful, actionable
for real-time analytic insights and is not
tolerant of insights from last quarter, last
                                                                     analytics is a necessary skill for
month, last week, or even yesterday.                                 every knowledge worker, researcher,
                                                                     consumer, teacher, and student.


                    The adoption of new analytics is an
                    opportunity for IT to augment or update
                    the business’s current capabilities.
                    According to CIO Kent Kushar, Gallo IT’s
                    latest investments are extensions of what
                    Gallo wanted to do 25 years ago but
                    could not due to limited availability of
                    data and tools.


                                               	                                 Reshaping the workforce with the new analytics	   67
PwC: What are Edwards


How visualization
                                                                                         Lifesciences’ main business
                                                                                         intelligence concerns given its role
                                                                                         as a medical device company?

and clinical decision
                                                                                         AR: There’s the traditional application
                                                                                         of BI [business intelligence], and
                                                                                         then there’s the instrumentation

support can improve                                                                      part of our business that serves many
                                                                                         different clinicians in the OR and
                                                                                         ICU. We make a hemodynamic [blood

patient care                                                                             circulation and cardiac function]
                                                                                         monitoring platform that is able to
                                                                                         communicate valuable information
Ashwin Rangan details what’s different about                                             and hemodynamic parameters
hemodynamic monitoring methods these days.                                               to the clinician using a variety of
                                                                                         visualization tools and a rich graphical
                                                                                         user interface. The clinician can use
Interview conducted by Bud Mathaisel and Alan Morrison
                                                                                         this information to make treatment
                                                                                         decisions for his or her patients.

                                                                                         PwC: You’ve said that the form
                                                                                         in which the device provides
                                               Ashwin Rangan
                                                                                         information adds value for the
                                                                                         clinician or guides the clinician.
                                               Ashwin Rangan is the CIO of Edwards       What does the monitoring
                                               Lifesciences, a medical device company.
                                                                                         equipment do in this case?
                                                                                         AR: The EV1000 Clinical Platform
                                                                                         provides information in a more
                                                                                         meaningful way, intended to better
                                                                                         inform the treating clinician and lead to
                                                                                         earlier and better diagnosis and care. In
                                                                                         the critical care setting, the earlier the
                                                                                         clinician can identify an issue, the more
                                                                                         choices the clinician has when treating
                                                                                         the patient. The instrument’s intuitive
                                                                                         screens and physiologic displays are also
                                                                                         ideal for teaching, presenting the various
                                                                                         hemodynamic parameters in the context
                                                                                         of each other. Ultimately, the screens are
                                                                                         intended to offer a more comprehensive
                                                                                         view of the patient’s status in a very
                                                                                         intuitive, user-friendly format.


68	     PwC Technology Forecast 2012 Issue 1
PwC: How does this approach                PwC: Why is visualization                      Figure 1: Edwards Lifesciences
compare with the way the                   important to this process?                     EV1000 wireless monitor
monitoring was done before?                AR: Before, we tended to want to tell
                                                                                          Patton Design helped develop
AR: Traditional monitoring historically    doctors and nurses to think like engineers
                                                                                          this monitor, which displays a range of
presented physiologic information, in      when we constructed these monitors.
                                                                                          blood-circulation parameters
this case hemodynamic parameters, in       Now, we’ve taken inspiration from the          very simply.
the form of a number and in some cases     glass display in Minority Report [a 2002
a trend line. When a parameter would       science-fiction movie] and influenced
fall out of the defined target zones,      the design of the EV1000 clinical
the clinician would be alerted with an     platform screens. The EV1000 clinical
alarm and would be left to determine       platform is unlike any other monitoring
the best course of action based upon       tool because you have the ability to
the displayed number or a line.            customize display screens to present
                                           parameters, color codes, time frames
Comparatively, the EV1000 clinical         and more according to specific patient
platform has the ability to show           needs and/or clinician preferences, truly
physiologic animations and physiologic     offering the clinician what they need,
decision trees to better inform            when they need it and how they need it.
and guide the treating clinician,
whether it is a physician or nurse.        We are no longer asking clinicians to
                                                                                           Source: Patton Design, 2012
                                           translate the next step in their heads. The
PwC: How did the physician                 goal now is to have the engineer reflect
view the information before?               the data and articulate it in a contextual
AR: It has been traditional in movies,     and intuitive language for the clinician.
for example, to see a patient surrounded   The clinician is already under pressure,       depending on the kind of statistics that
by devices that displayed parameters,      caring for critically ill patients; our goal   people are looking to understand.
all of which looked like numbers           is to alleviate unnecessary pressure
and jagged lines on a timescale. In        and provide not just information but           I think we need to look at this
our view and where we’re currently         also guidance, enabling the clinician          more broadly and not just print
at with the development of our             to more immediately navigate to                bar graphs or pie graphs. What is
technology, this is considered more        the best therapy decisions.                    the visualization that can really be
basic hemodynamic monitoring.                                                             contextually applicable with different
                                           PwC: Looking toward the                        applications? How do you make it
In our experience, the “new-school”        next couple of years and some                  easier? And more quickly understood?
hemodynamic monitoring is a device         of the emerging technical
that presents the dynamics of the          capability, what do you
circulatory system, the dampness of        think is most promising?
the lungs and the cardiac output real-     AR: Visualization technologies. The
time in an intuitive display. The only     human ability to discern patterns is not
lag time between what’s happening in       changing. That gap can only be bridged
the patient and what’s being reflected     by rendering technologies that are visual
on the monitor is the time between the     in nature. And the visualization varies
analog body and the digital rendering.


                                           	                                 Reshaping the workforce with the new analytics	       69
To have a deeper conversation about
this subject, please contact:


Tom DeGarmo                              Bill Abbott
US Technology Consulting Leader          Principal, Applied Analytics
+1 (267) 330 2658                        +1 (312) 298 6889
thomas.p.degarmo@us.pwc.com              william.abbott@us.pwc.com

Bo Parker                                Oliver Halter
Managing Director                        Principal, Applied Analytics
Center for Technology & Innovation       +1 (312) 298 6886
+1 (408) 817 5733                        oliver.halter@us.pwc.com
bo.parker@us.pwc.com

Robert Scott
Global Consulting Technology Leader
+1 (416) 815 5221
robert.w.scott@ca.pwc.com


Comments or requests?
Please visit www.pwc.com/techforecast or send
e-mail to techforecasteditors@us.pwc.com
This publication is printed on McCoy Silk. It is a Forest Stewardship Council™ (FSC®) certified stock
containing 10% postconsumer waste (PCW) fiber and manufactured with 100% certified renewable energy.

By using postconsumer recycled fiber in lieu of virgin fiber:

         6 trees were preserved for the future

         16 lbs of waterborne waste were not created

         2,426 gallons of wastewater flow were saved

         268 lbs of solid waste were not generated

         529 lbs net of greenhouse gases were prevented

         4,046,000 BTUs of energy were not consumed


Photography
Catherine Hall: Cover, pages 06, 20
Gettyimages: pages 30, 44, 58


PwC (www.pwc.com) provides industry-focused assurance, tax and advisory services to build public trust and
enhance value for its clients and their stakeholders. More than 155,000 people in 153 countries across our
network share their thinking, experience and solutions to develop fresh perspectives and practical advice.


© 2012 PricewaterhouseCoopers LLP, a Delaware limited liability partnership. All rights reserved. PwC refers
to the US member firm, and may sometimes refer to the PwC network. Each member firm is a separate legal
entity. Please see www.pwc.com/structure for further details. This content is for general information purposes
only, and should not be used as a substitute for consultation with professional advisors. NY-12-0340
www.pwc.com/techforecast


Subtext
Culture of inquiry   A business environment focused on asking better
                     questions, getting better answers to those questions,
                     and using the results to inform continual improvement.
                     A culture of inquiry infuses the skills and capabilities
                     of data scientists into business units and compels a
                     collaborative effort to find answers to critical business
                     questions. It also engages the workforce at large—
                     whether or not the workforce is formally versed in data
                     analysis methods—in enterprise discovery efforts.


In-memory            A method of running entire databases in random
                     access memory (RAM) without direct reliance on disk
                     storage. In this scheme, large amounts of dynamic
                     random access memory (DRAM) constitute the
                     operational memory, and an indirect backup method
                     called write-behind caching is the only disk function.
                     Running databases or entire suites in memory speeds
                     up queries by eliminating the need to perform disk
                     writes and reads for immediate database operations.


Interactive          The blending of a graphical user interface for
visualization        data analysis with the presentation of the results,
                     which makes possible more iterative analysis
                     and broader use of the analytics tool.


Natural language     M
                      ethods of modeling and enabling machines to extract
processing (NLP)     meaning and context from human speech or writing,
                     with the goal of improving overall text analytics results.
                     The linguistics focus of NLP complements purely
                     statistical methods of text analytics that can range from
                     the very simple (such as pattern matching in word
                     counting functions) to the more sophisticated (pattern
                     recognition or “fuzzy” matching of various kinds).

Technology Forecast: Reshaping the workforce with the new analytics

  • 1.
    A quarterly journal 06 30 44 58 2012 The third wave of The art and science Natural language Building the foundation Issue 1 customer analytics of new analytics processing and social for a data science culture technology media intelligence Reshaping the workforce with the new analytics Mike Driscoll CEO, Metamarkets
  • 2.
    Acknowledgments Advisory Center for Technology Principal & Technology Leader & Innovation Tom DeGarmo Managing Editor Bo Parker US Thought Leadership Partner-in-Charge Editors Tom Craren Vinod Baya Alan Morrison Strategic Marketing Natalie Kontra Contributors Jordana Marx Galen Gruman Steve Hamby and Orbis Technologies Bud Mathaisel Uche Ogbuji Bill Roberts Brian Suda Editorial Advisors Larry Marion Copy Editor Lea Anne Bantsari Transcriber Dawn Regan 02 PwC Technology Forecast 2012 Issue 1
  • 3.
    US studio Industry perspectives Jonathan Newman Design Lead During the preparation of this Senior Director, Enterprise Web & EMEA Tatiana Pechenik publication, we benefited greatly eSolutions from interviews and conversations Ingram Micro Designer with the following executives: Peggy Fresenburg Ashwin Rangan Kurt J. Bilafer Chief Information Officer Illustrators Regional Vice President, Analytics, Edwards Lifesciences Don Bernhardt Asia Pacific Japan James Millefolie SAP Seth Redmore Vice President, Marketing and Product Jonathan Chihorek Management Production Vice President, Global Supply Chain Lexalytics Jeff Ginsburg Systems Ingram Micro Vince Schiavone Online Co-founder and Executive Chairman Managing Director Online Marketing Zach Devereaux ListenLogic Jack Teuber Chief Analyst Nexalogy Environics Jon Slade Designer and Producer Global Online and Strategic Advertising Scott Schmidt Mike Driscoll Sales Director Chief Executive Officer Financial Times Animator Metamarkets Roger Sano Claude Théoret Elissa Fink President Reviewers Chief Marketing Officer Nexalogy Environics Jeff Auker Tableau Software Ken Campbell Saul Zambrano Murali Chilakapati Kaiser Fung Senior Director, Oliver Halter Adjunct Professor Customer Energy Solutions Matt Moore New York University Pacific Gas & Electric Rick Whitney Kent Kushar Special thanks Chief Information Officer Cate Corcoran E. & J. Gallo Winery WIT Strategy Josée Latendresse Nisha Pathak Owner Metamarkets Latendresse Groupe Conseil Lisa Sheeran Mario Leone Sheeran/Jager Communication Chief Information Officer Ingram Micro Jock Mackinlay Director, Visual Analysis Tableau Software Reshaping the workforce with the new analytics 03
  • 4.
    The right data+ the right resolution = a new culture of inquiry Message from the editor disease sit at the other end of the size James Balog1 may have more influence spectrum. Scientists’ understanding on the global warming debate than of the role of amyloid particles in any scientist or politician. By using Alzheimer’s has relied heavily on time-lapse photographic essays of technologies such as scanning tunneling shrinking glaciers, he brings art and microscopes.2 These devices generate science together to produce striking visual data at sufficient resolution visualizations of real changes to so that scientists can fully explore the planet. In 60 seconds, Balog the physical geometry of amyloid shows changes to glaciers that take particles in relation to the brain’s place over a period of many years— neurons. Once again, data at the right introducing forehead-slapping resolution together with the ability to insight to a topic that can be as visually understand a phenomenon difficult to see as carbon dioxide. are moving science forward. Part of his success can be credited to creating the right perspective. If the Science has long focused on data-driven photographs had been taken too close understanding of phenomenon. It’s Tom DeGarmo to or too far away from the glaciers, called the scientific method. Enterprises US Technology Consulting Leader the insight would have been lost. Data also use data for the purposes of thomas.p.degarmo@us.pwc.com at the right resolution is the key. understanding their business outcomes and, more recently, the effectiveness and Glaciers are immense, at times more efficiency of their business processes. than a mile deep. Amyloid particles But because running a business is not the that are the likely cause of Alzheimer’s same as running a science experiment, 1 http://www.jamesbalog.com/. 2 Davide Brambilla, et al., “Nanotechnologies for Alzheimer’s disease: diagnosis, therapy, and safety issues,” Nanomedicine: Nanotechnology, Biology and Medicine 7, no. 5 (2011): 521–540. 04 PwC Technology Forecast 2012 Issue 1
  • 5.
    there has longbeen a divergence with big data techniques (including This issue also includes interviews between analytics as applied to science NoSQL and in-memory databases), with executives who are using new and the methods and processes that through advanced statistical packages analytics technologies and with subject define analytics in the enterprise. (from the traditional SPSS and SAS matter experts who have been at the to open source offerings such as R), forefront of development in this area: This difference partly has been a to analytic visualization tools that put question of scale and instrumentation. interactive graphics in the control of • Mike Driscoll of Metamarkets Even a large science experiment (setting business unit specialists. This arc is considers how NoSQL and other aside the Large Hadron Collider) will positioning the enterprise to establish analytics methods are improving introduce sufficient control around the a new culture of inquiry, where query speed and providing inquiry of interest to limit the amount of decisions are driven by analytical greater freedom to explore. data collected and analyzed. Any large precision that rivals scientific insight. enterprise comprises tens of thousands • Jon Slade of the Financial Times of moving parts, from individual The first article, “The third wave of (FT.com) discusses the benefits employees to customers to suppliers to customer analytics,” on page 06 reviews of cloud analytics for online products and services. Measuring and the impact of basic computing trends ad placement and pricing. retaining the data on all aspects of an on emerging analytics technologies. enterprise over all relevant periods of Enterprises have an unprecedented • Jock Mackinlay of Tableau Software time are still extremely challenging, opportunity to reshape how business describes the techniques behind even with today’s IT capacities. gets done, especially when it comes interactive visualization and to customers. The second article, how more of the workforce can But targeting the most important “The art and science of new analytics become engaged in analytics. determinants of success in an enterprise technology,” on page 30 explores the context for greater instrumentation— mix of different techniques involved • Ashwin Rangan of Edwards often customer information—can be and in making the insights gained from Lifesciences highlights new is being done today. And with Moore’s analytics more useful, relevant, and ways that medical devices can Law continuing to pay dividends, this visible. Some of these techniques are be instrumented and how new instrumentation will expand in the clearly in the data science realm, while business models can evolve. future. In the process, and with careful others are more art than science. The attention to the appropriate resolution article, “Natural language processing Please visit pwc.com/techforecast of the data being collected, enterprises and social media intelligence,” on to find these articles and other issues that have relied entirely on the art of page 44 reviews many different of the Technology Forecast online. management will increasingly blend in language analytics techniques in use If you would like to receive future the science of advanced analytics. Not for social media and considers how issues of this quarterly publication as surprisingly, the new role emerging in combinations of these can be most a PDF attachment, you can sign up at the enterprise to support these efforts effective.“How CIOs can build the pwc.com/techforecast/subscribe. is often called a “data scientist.” foundation for a data science culture” on page 58 considers new analytics as As always, we welcome your feedback This issue of the Technology Forecast an unusually promising opportunity and your ideas for future research examines advanced analytics through for CIOs. In the best case scenario, and analysis topics to cover. this lens of increasing instrumentation. the IT organization can become the PwC’s view is that the flow of data go-to group, and the CIO can become at this new, more complete level of the true information leader again. resolution travels in an arc beginning Reshaping the workforce with the new analytics 05
  • 6.
    Bahrain World TradeCenter gets approximately 15% of its power from these wind turbines 06 PwC Technology Forecast 2012 Issue 1
  • 7.
    The third waveof customer analytics These days, there’s only one way to scale the analysis of customer-related information to increase sales and profits—by tapping the data and human resources of the extended enterprise. By Alan Morrison and Bo Parker As director of global online and strategic issues. The parallel processing, strategic advertising sales for FT.com, in-memory technology, the interface, the online face of the Financial Times, and many other enhancements led to Jon Slade says he “looks at the 6 billion better business results, including double- ad impressions [that FT.com offers] digit growth in ad yields and 15 to 20 each year and works out which one percent accuracy improvement in the is worth the most for any particular metrics for its ad impression supply. client who might buy.” This activity previously required labor-intensive The technology trends behind extraction methods from a multitude FT.com’s improvements in advertising of databases and spreadsheets. Slade operations—more accessible data; made the process much faster and faster, less-expensive computing; new vastly more effective after working software tools; and improved user with Metamarkets, a company that interfaces—are driving a new era in offers a cloud-based, in-memory analytics use at large companies around analytics service called Druid. the world, in which enterprises make decisions with a precision comparable “Before, the sales team would send to scientific insight. The new analytics an e-mail to ad operations for an uses a rigorous scientific method, inventory forecast, and it could take including hypothesis formation and a minimum of eight working hours testing, with science-oriented statistical and as long as two business days to packages and visualization tools. It is get an answer,” Slade says. Now, with spawning business unit “data scientists” a direct interface to the data, it takes who are replacing the centralized a mere eight seconds, freeing up the analytics units of the past. These trends ad operations team to focus on more will accelerate, and business leaders Reshaping the workforce with the new analytics 07
  • 8.
    Figure 1: Howbetter customer analytics capabilities are affecting enterprises Processing power and memory keep increasing, the More computing speed, ability to leverage massive parallelization continues to storage, and ability to scale expand in the cloud, and the cost per processed bit keeps falling. Leads to Data scientists are seeking larger data sets and iterating More time and better tools more to refine their questions and find better answers. Visualization capabilities and more intuitive user interfaces are making it possible for most people in the workforce to do at least basic exploration. Social media data is the most prominent example of the More data sources many large data clouds emerging that can help enterprises understand their customers better. These clouds augment data that business units have direct access to internally now, which is also growing. A core single metric can be a way to rally the entire More focus on key metrics organization’s workforce, especially when that core metric is informed by other metrics generated with the help of effective modeling. Whether an enterprise is a gaming or an e-commerce Better access to results company that can instrument its own digital environ- ment, or a smart grid utility that generates, slices, dices, and shares energy consumption analytics for its customers and partners, better analytics are going Leads to direct to the customer as well as other stakeholders. And they’re being embedded where users can more easily find them. Visualization and user interface improvements have A broader culture of inquiry made it possible to spread ad hoc analytics capabilities across the workplace to every user role. At the same time, data scientists—people who combine a creative ability to generate useful hypotheses with the savvy to Leads to simulate and model a business as it’s changing—have never been in more demand than now. The benefits of a broader culture of inquiry include new Less guesswork opportunities, a workforce that shares a better under- standing of customer needs to be able to capitalize on Less bias the opportunities, and reduced risk. Enterprises that More awareness understand the trends described here and capitalize Better decisions on them will be able to change company culture and improve how they attract and retain customers. who embrace the new analytics will be in this issue focus on the technologies able to create cultures of inquiry that behind these capabilities (see the lead to better decisions throughout article, “The art and science of new their enterprises. (See Figure 1.) analytics technology,” on page 30) and identify the main elements of a This issue of the Technology Forecast CIO strategic framework for effectively explores the impact of the new taking advantage of the full range of analytics and this culture of inquiry. analytics capabilities (see the article, This first article examines the essential “How CIOs can build the foundation for ingredients of the new analytics, using a data science culture,” on page 58). several examples. The other articles 08 PwC Technology Forecast 2012 Issue 1
  • 9.
    More computing speed, decision-making capabilities. “Because storage, and ability to scale our technology is optimized for the Basic computing trends are providing cloud, we can harness the processing the momentum for a third wave power of tens, hundreds, or thousands in analytics that PwC calls the new of servers depending on our customers’ analytics. Processing power and data and their specific needs,” states memory keep increasing, the ability Mike Driscoll, CEO of Metamarkets. to leverage massive parallelization “We can ask questions over billions continues to expand in the cloud, and of rows of data in milliseconds. That the cost per processed bit keeps falling. kind of speed combined with data science and visualization helps business FT.com benefited from all of these users understand and consume trends. Slade needs multiple computer information on top of big data sets.” screens on his desk just to keep up. His job requires a deep understanding of Decades ago, in the first wave of the readership and which advertising analytics, small groups of specialists suits them best. Ad impressions— managed computer systems, and even appearances of ads on web pages— smaller groups of specialists looked for are the currency of high-volume media answers in the data. Businesspeople industry websites. The impressions typically needed to ask the specialists need to be priced based on the reader to query and analyze the data. As segments most likely to see them and enterprise data grew, collected from click through. Chief executives in enterprise resource planning (ERP) France, for example, would be a reader systems and other sources, IT stored the segment FT.com would value highly. more structured data in warehouses so analysts could assess it in an integrated “The trail of data that users create form. When business units began to when they look at content on a website ask for reports from collections of data like ours is huge,” Slade says. “The relevant to them, data marts were born, real challenge has been trying to but IT still controlled all the sources. understand what information is useful to us and what we do about it.” The second wave of analytics saw variations of centralized top-down data FT.com’s analytics capabilities were collection, reporting, and analysis. In a challenge, too. “The way that data the 1980s, grassroots decentralization was held—the demographics data, the began to counter that trend as the PC behavior data, the pricing, the available era ushered in spreadsheets and other inventory—was across lots of different methods that quickly gained widespread databases and spreadsheets,” Slade use—and often a reputation for misuse. says. “We needed an almost witchcraft- Data warehouses and marts continue like algorithm to provide answers to to store a wealth of helpful data. ‘How many impressions do I have?’ and ‘How much should I charge?’ It was an In both waves, the challenge for extremely labor-intensive process.” centralized analytics was to respond to business needs when the business units FT.com saw a possible solution when themselves weren’t sure what findings it first talked to Metamarkets about they wanted or clues they were seeking. an initial concept, which evolved as they collaborated. Using Metamarkets’ The third wave does that by giving analytics platform, FT.com could access and tools to those who act quickly iterate and investigate on the findings. New analytics taps numerous questions to improve its the expertise of the broad business Reshaping the workforce with the new analytics 09
  • 10.
    Figure 2: Thethree waves of analytics and the impact of decentralization Cloud computing accelerates decentralization of the analytics function. Cloud co-creation Self-service Data in the Trend toward decentralization cloud Central IT generated C B A 1 2 3 4 The trend toward 5 decentralization continues as 6 7 business units, customers, and other stakeholders collaborate to diagnose and work on PCs and then the web and an problems of mutual interest in increasingly interconnected the cloud. business ecosystem have provided Analytics functions in enterprises more responsive alternatives. were all centralized in the beginning, but not always responsive to business needs. ecosystem to address the lack of More time and better tools responsiveness from central analytics Big data techniques—including NoSQL1 units. (See Figure 2.) Speed, storage, and in-memory databases, advanced and scale improvements, with the statistical packages (from SPSS and help of cloud co-creation, have SAS to open source offerings such as R), made this decentralized analytics visualization tools that put interactive possible. The decentralized analytics graphics in the control of business innovation has evolved faster than unit specialists, and more intuitive the centralized variety, and PwC user interfaces—are crucial to the new expects this trend to continue. analytics. They make it possible for many people in the workforce to do “In the middle of looking at some data, some basic exploration. They allow you can change your mind about what business unit data scientists to use larger question you’re asking. You need to be data sets and to iterate more as they test able to head toward that new question hypotheses, refine questions, and find on the fly,” says Jock Mackinlay, better answers to business problems. director of visual analysis at Tableau Software, one of the vendors of the new Data scientists are nonspecialists visualization front ends for analytics. who follow a scientific method of “No automated system is going to keep iterative and recursive analysis with a up with the stream of human thought.” practical result in mind. Even without formal training, some business users in finance, marketing, operations, human capital, or other departments 1 See “Making sense of Big Data,” Technology Forecast 2010, Issue 3, http://www.pwc.com/us/en/technology- forecast/2010/issue3/index.jhtml, for more information on Hadoop and other NoSQL databases. 10 PwC Technology Forecast 2012 Issue 1
  • 11.
    Case study How the E. & J. Gallo Winery matches outbound shipments to retail customers E. & J. Gallo Winery, one of the world’s Years ago, Gallo’s senior management largest producers and distributors of understood that customer analytics wines, recognizes the need to precisely would be increasingly important. The identify its customers for two reasons: company’s most recent investments are some local and state regulations mandate extensions of what it wanted to do 25 restrictions on alcohol distribution, years ago but was limited by availability and marketing brands to individuals of data and tools. Since 1998, Gallo requires knowing customer preferences. IT has been working on advanced data warehouses, analytics tools, and “The majority of all wine is consumed visualization. Gallo was an early adopter within four hours and five miles of visualization tools and created IT of being purchased, so this makes subgroups within brand marketing to it critical that we know which leverage the information gathered. products need to be marketed and distributed by specific destination,” The success of these early efforts has says Kent Kushar, Gallo’s CIO. spurred Gallo to invest even more in analytics. “We went from step Gallo knows exactly how its products function growth to logarithmic growth move through distributors, but of analytics; we recently reinvested tracking beyond them is less clear. heavily in new appliances, a new Some distributors are state liquor system architecture, new ETL [extract, control boards, which supply the transform, and load] tools, and new wine products to retail outlets and ways our SQL calls were written; and other end customers. Some sales are we began to coalesce unstructured through military post exchanges, and data with our traditional structured in some cases there are restrictions and consumer data,” says Kushar. regulations because they are offshore. “Recognizing the power of these Gallo has a large compliance capabilities has resulted in our taking a department to help it manage the 10-year horizon approach to analytics,” regulatory environment in which Gallo he adds. “Our successes with analytics products are sold, but Gallo wants to date have changed the way we to learn more about the customers think about and use analytics.” who eventually buy and consume those products, and to learn from The result is that Gallo no longer relies them information to help create on a single instance database, but has new products that localize tastes. created several large purpose-specific databases. “We have also created Gallo sometimes cannot obtain point of new service level agreements for our sales data from retailers to complete the internal customers that give them match of what goes out to what is sold. faster access and more timely analytics Syndicated data, from sources such as and reporting,” Kushar says. Internal Information Resources, Inc. (IRI), serves customers for Gallo IT include supply as the matching link between distribution chain, sales, finance, distribution, and actual consumption. This results and the web presence design team. in the accumulation of more than 1GB of data each day as source information for compliance and marketing. Reshaping the workforce with the new analytics 11
  • 12.
    already have theskills, experience, Analytics tools were once the province and mind-set to be data scientists. of experts. They weren’t intuitive, Others can be trained. The teaching of and they took a long time to learn. the discipline is an obvious new focus Those who were able to use them for the CIO. (See the article,”How tended to have deep backgrounds CIOs can build the foundation for a in mathematics, statistical analysis, data science culture” on page 58.) or some scientific discipline. Only companies with dedicated teams of Visualization tools have been especially specialists could make use of these useful for Ingram Micro, a technology tools. Over time, academia and the products distributor, which uses them business software community have to choose optimal warehouse locations collaborated to make analytics tools around the globe. Warehouse location is more user-friendly and more accessible a strategic decision, and Ingram Micro to people who aren’t steeped in the can run many what-if scenarios before it mathematical expressions needed to decides. One business result is shorter- query and get good answers from data. term warehouse leases that give Ingram Micro more flexibility as supply chain Products from QlikTech, Tableau requirements shift due to cost and time. Software, and others immerse users in fully graphical environments because “Ensuring we are at the efficient frontier most people gain understanding more for our distribution is essential in this quickly from visual displays of numbers fast-paced and tight-margin business,” rather than from tables. “We allow Over time, academia says Jonathan Chihorek, vice president users to get quickly to a graphical view and the business of global supply chain systems at Ingram of the data,” says Tableau Software’s Micro. “Because of the complexity, Mackinlay. “To begin with, they’re software community size, and cost consequences of these using drag and drop for the fields have collaborated warehouse location decisions, we run in the various blended data sources extensive models of where best to they’re working with. The software to make analytics locate our distribution centers at least interprets the drag and drop as algebraic tools more user- once a year, and often twice a year.” expressions, and that gets compiled into a query database. But users don’t friendly and more Modeling has become easier thanks need to know all that. They just need accessible to people to mixed integer, linear programming to know that they suddenly get to optimization tools that crunch large see their data in a visual form.” who aren’t steeped and diverse data sets encompassing in the mathematical many factors. “A major improvement Tableau Software itself is a prime came from the use of fast 64-bit example of how these tools are expressions needed to processors and solid-state drives that changing the enterprise. “Inside query and get good reduced scenario run times from Tableau we use Tableau everywhere, six to eight hours down to a fraction from the receptionist who’s keeping answers from data. of that,” Chihorek says. “Another track of conference room utilization breakthrough for us has been improved to the salespeople who are monitoring visualization tools, such as spider and their pipelines,” Mackinlay says. bathtub diagrams that help our analysts choose the efficient frontier curve These tools are also enabling from a complex array of data sets that more finance, marketing, and otherwise look like lists of numbers.” operational executives to become data scientists, because they help them navigate the data thickets. 12 PwC Technology Forecast 2012 Issue 1
  • 13.
    Figure 3: Improvingthe signal-to-noise ratio in social media monitoring Social media is a high-noise environment But there are ways to reduce the noise And focus on significant conversations work boots Illuminating and helpful dialogue leather heel heel boots color fashion color fashion construction safety style style rugged leather cool leather cool shoes toe shoes toe boots boots price safety price safety store value store value rugged rugged wear wear construction construction An initial set of relevant terms is used to cut With proper guidance, machines can do Visualization tools present “lexical maps” to back on the noise dramatically, a first step millions of correlations, clustering words by help the enterprise unearth instances of toward uncovering useful conversations. context and meaning. useful customer dialog. Source: Nexalogy Environics and PwC, 2012 More data sources of shoes and boots. The manufacturer The huge quantities of data in the was mining conventional business data cloud and the availability of enormous for insights about brand status, but low-cost processing power can help it had not conducted any significant enterprises analyze various business analysis of social media conversations problems—including efforts to about its products, according to Josée understand customers better, especially Latendresse, who runs Latendresse through social media. These external Groupe Conseil, which was advising clouds augment data that business units the company on its repositioning already have direct access to internally. effort. “We were neglecting the wealth of information that we could Ingram Micro uses large, diverse data find via social media,” she says. sets for warehouse location modeling, Chihorek says. Among them: size, To expand the analysis, Latendresse weight, and other physical attributes brought in technology and expertise of products; geographic patterns of from Nexalogy Environics, a company consumers and anticipated demand that analyzes the interest graph implied for product categories; inbound and in online conversations—that is, the outbound transportation hubs, lead connections between people, places, and times, and costs; warehouse lease and things. (See “Transforming collaboration operating costs, including utilities; with social tools,” Technology Forecast and labor costs—to name a few. 2011, Issue 3, for more on interest graphs.) Nexalogy Environics studied Social media can also augment millions of correlations in the interest internal data for enterprises willing to graph and selected fewer than 1,000 learn how to use it. Some companies relevant conversations from 90,000 that ignore social media because so much mentioned the products. In the process, of the conversation seems trivial, Nexalogy Environics substantially but they miss opportunities. increased the “signal” and reduced the “noise” in the social media about Consider a North American apparel the manufacturer. (See Figure 3.) maker that was repositioning a brand Reshaping the workforce with the new analytics 13
  • 14.
    Figure 4: Addingsocial media analysis techniques suggests other changes to the BI process Here’s one example of how the larger business intelligence (BI) process might Adding SMA techniques change with the addition of social media analysis. One apparel maker started with its conventional BI analysis cycle. Conventional BI techniques 1 1. Develop questions used by an apparel 2. Collect data company client ignored 5 2 3. Clean data social media and required lots of data cleansing. The 4. Analyze data results often lacked insight. 5. Present results 4 3 Then it added social media and targeted focus groups to the mix. The company’s revised approach 1. Develop questions 1 added several elements such as 2. Refine conventional BI social media analysis and 6 2 - Collect data expanded others, but kept the - Clean data focus group phase near the - Analyze data beginning of the cycle. The 3. Conduct focus groups company was able to mine new 5 3 (retailers and end users) insights from social media 4 4. Select conversations conversations about market segments that hadn’t occurred to 5. Analyze social media the company to target before. 6. Present results Then it tuned the process for maximum impact. The company’s current 1. Develop questions 1 approach places focus 2. Refine conventional BI groups near the end, where 7 2 - Collect data they can inform new - Clean data questions more directly. This - Analyze data approach also stresses how 6 3 3. Select conversations the results get presented to 4. Analyze social media executive leadership. 5 4 5. Present results 6. Tailor results to audience 7. Conduct focus groups New step added (retailers and end users) What Nexalogy Environics discovered generally. “The key step,” she says, suggested the next step for the brand “is to define the questions that you repositioning. “The company wasn’t want to have answered. You will marketing to people who were blogging definitely be surprised, because about its stuff,” says Claude Théoret, the system will reveal customer president of Nexalogy Environics. attitudes you didn’t anticipate.” The shoes and boots were designed for specific industrial purposes, but Following the social media analysis the blogging influencers noted their (SMA), Latendresse saw the retailer fashion appeal and their utility when and its user focus groups in a new riding off-road on all-terrain vehicles light. The analysis “had more complete and in other recreational settings. results than the focus groups did,” she “That’s a whole market segment says. “You could use the focus groups the company hadn’t discovered.” afterward to validate the information evident in the SMA.” The revised Latendresse used the analysis to intelligence development process help the company expand and now places focus groups closer to the refine its intelligence process more end of the cycle. (See Figure 4.) 14 PwC Technology Forecast 2012 Issue 1
  • 15.
    Figure 5: Thebenefits of big data analytics: A carrier example By analyzing billions of call records, carriers are able to obtain early warning of groups of subscribers likely to switch services. Here is how it works: 1 Carrier notes big peaks 2 Dataspora brought in to 3 The initial analysis debunks some Carrier’s in churn.* analyze all call records. myths and raises new questions prime hypothesis discussed with the carrier. disproved Dropped calls/poor service? Merged to family plan? 14 billion Preferred phone unavailable? Offer by competitor? call data records analyzed Financial trouble? Dropped dead? Incarcerated? Friend dropped recently! Pattern spotted: Those with a relationship to a dropped customer $ $ DON’T GO! (calls lasting longer than two minutes, We’ll miss you! more than twice in the previous $ $ month) are 500% more likely to drop. 6 Marketers begin 5 Data group deploys a call 4 Further analysis confirms that friends influence campaigns that target record monitoring system that other friends’ propensity to switch services. at-risk subscriber groups issues an alert that identifies with special offers. at-risk subscribers. * Churn: the proportion of contractual subscribers who leave during a given time period Source: Metamarkets and PwC, 2012 Third parties such as Nexalogy A telecom provider illustrates the Environics are among the first to point. The carrier was concerned take advantage of cloud analytics. about big peaks in churn—customers Enterprises like the apparel maker may moving to another carrier—but hadn’t have good data collection methods methodically mined the whole range of but have overlooked opportunities to its call detail records to understand the mine data in the cloud, especially social issue. Big data analysis methods made media. As cloud capabilities evolve, a large-scale, iterative analysis possible. enterprises are learning to conduct more The carrier partnered with Dataspora, a iteration, to question more assumptions, consulting firm run by Driscoll before he and to discover what else they can founded Metamarkets. (See Figure 5.)2 learn from data they already have. “We analyzed 14 billion call data More focus on key metrics records,” Driscoll recalls, “and built a One way to start with new analytics is high-frequency call graph of customers to rally the workforce around a single who were calling each other. We found core metric, especially when that core that if two subscribers who were friends metric is informed by other metrics spoke more than once for more than generated with the help of effective two minutes in a given month and the modeling. The core metric and the first subscriber cancelled their contract model that helps everyone understand in October, then the second subscriber it can steep the culture in the language, became 500 percent more likely to methods, and tools around the cancel their contract in November.” process of obtaining that goal. 2 For more best practices on methods to address churn, see Curing customer churn, PwC white paper, http:// www.pwc.com/us/en/increasing-it-effectiveness/ publications/curing-customer-churn.jhtml, accessed April 5, 2012. Reshaping the workforce with the new analytics 15
  • 16.
    Data mining onthat scale required that policymakers are encouraging distributed computing across hundreds more third-party access to the usage of servers and repeated hypothesis data from the meters. “One of the big testing. The carrier assumed that policy pushes at the regulatory level dropped calls might be one reason is to create platforms where third why clusters of subscribers were parties can—assuming all privacy cancelling contracts, but the Dataspora guidelines are met—access this data analysis disproved that notion, to build business models they can finding no correlation between drive into the marketplace,” says dropped calls and cancellation. Zambrano. “Grid management and energy management will be supplied “There were a few steps we took. One by both the utilities and third parties.” was to get access to all the data and next do some engineering to build a social Zambrano emphasizes the importance graph and other features that might of customer participation to the energy be meaningful, but we also disproved efficiency push. The issue he raises is some other hypotheses,” Driscoll says. the extent to which blended operational Watching what people actually did and customer data can benefit the confirmed that circles of friends were larger ecosystem, by involving millions cancelling in waves, which led to the of residential and business customers. peaks in churn. Intense focus on the key “Through the power of information metric illustrated to the carrier and its and presentation, you can start to show workforce the power of new analytics. customers different ways that they can “Through the power become stewards of energy,” he says. of information and Better access to results The more pervasive the online As a highly regulated business, the presentation, you can environment, the more common the utility industry has many obstacles to start to show customers sharing of information becomes. overcome to get to the point where Whether an enterprise is a gaming smart grids begin to reach their different ways that they or an e-commerce company that potential, but the vision is clear: can become stewards can instrument its own digital environment, or a smart grid utility • Show customers a few key of energy.” that generates, slices, dices, and metrics and seasonal trends in shares energy consumption analytics an easy-to-understand form. —Saul Zambrano, PG&E for its customers and partners, better analytics are going direct to the • Provide a means of improving those customer as well as other stakeholders. metrics with a deeper dive into where And they’re being embedded where they’re spending the most on energy. users can more easily find them. • Allow them an opportunity to For example, energy utilities preparing benchmark their spending by for the smart grid are starting to providing comparison data. invite the help of customers by putting better data and more broadly This new kind of data sharing could be a shared operational and customer chance to stimulate an energy efficiency analytics at the center of a co-created competition that’s never existed between energy efficiency collaboration. homeowners and between business property owners. It is also an example of Saul Zambrano, senior director of how broadening access to new analytics customer energy solutions at Pacific can help create a culture of inquiry Gas & Electric (PG&E), an early throughout the extended enterprise. installer of smart meters, points out 16 PwC Technology Forecast 2012 Issue 1
  • 17.
    Case study Smart shelving: How the E. & J. Gallo Winery analytics team helps its retail partners Some of the data in the E. & J. Gallo what the data reveal (for underlying Winery information architecture is for trends of specific brands by location), production and quality control, not just or to conduct R&D in a test market, customer analytics. More recently, Gallo or to listen to the web platforms. has adopted complex event processing methods on the source information, These insights inform a specific design so it can look at successes and failures for “smart shelving,” which is the early in its manufacturing execution placement of products by geography system, sales order management, and location within the store. Gallo and the accounting system that offers a virtual wine shelf design front ends the general ledger. schematic to retailers, which helps the retailer design the exact details Information and information flow are of how wine will be displayed—by the lifeblood of Gallo, but it is clearly brand, by type, and by price. Gallo’s a team effort to make the best use wine shelf design schematic will help of the information. In this team: the retailer optimize sales, not just for Gallo brands but for all wine offerings. • Supply chain looks at the flows. Before Gallo’s wine shelf design • ales determines what information is S schematic, wine sales were not a major needed to match supply and demand. source of retail profits for grocery stores, but now they are the first or second • &D undertakes the heavy-duty R highest profit generators in those stores. customer data integration, and it “Because of information models such as designs pilots for brand consumption. the wine shelf design schematic, Gallo has been the wine category captain for • T provides the data and consulting I some grocery stores for 11 years in a row on how to use the information. so far,” says Kent Kushar, CIO of Gallo. Mining the information for patterns and insights in specific situations requires the team. A key goal is what Gallo refers to as demand sensing—to determine the stimulus that creates demand by brand and by product. This is not just a computer task, but is heavily based on human intervention to determine Reshaping the workforce with the new analytics 17
  • 18.
    Conclusion: A broader have found. The return on investment culture of inquiry for finding a new market segment can This article has explored how be the difference between long-term enterprises are embracing the big data, viability and stagnation or worse. tools, and science of new analytics along a path that can lead them to a Tackling the new kinds of data being broader culture of inquiry, in which generated is not the only analytics task improved visualization and user ahead. Like the technology distributor, interfaces make it possible to spread ad enterprises in all industries have hoc analytics capabilities to every user concerns about scaling the analytics role. This culture of inquiry appears for data they’re accustomed to having likely to become the age of the data and now have more. Publishers can scientists—workers who combine serve readers better and optimize ad a creative ability to generate useful sales revenue by tuning their engines hypotheses with the savvy to simulate for timing, pricing, and pinpointing and model a business as it’s changing. ad campaigns. Telecom carriers can mine all customer data more effectively It’s logical that utilities are to be able to reduce the expense instrumenting their environments as of churn and improve margins. a step toward smart grids. The data they’re generating can be overwhelming, What all of these examples suggest is a but that data will also enable the greater need to immerse the extended analytics needed to reduce energy workforce—employees, partners, and consumption to meet efficiency and customers—in the data and analytical environmental goals. It’s also logical methods they need. Without a view that enterprises are starting to hunt into everyday customer behavior, for more effective ways to filter social there’s no leverage for employees to media conversations, as apparel makers influence company direction when One way to raise awareness about the power of new analytics comes from articulating the results in a visual form that everyone can understand. Another is to enable the broader workforce to work with the data themselves and to ask them to develop and share the results of their own analyses. 18 PwC Technology Forecast 2012 Issue 1
  • 19.
    Table 1: Keyelements of a culture of inquiry Element How it is manifested within an organization Value to the organization Executive support Senior executives asking for data to support any Set the tone for the rest of the organization with opinion or proposed action and using interactive examples visualization tools themselves Data availability Cloud architecture (whether private or public) and Find good ideas from any source semantically rich data integration methods Analytics tools Higher-profile data scientists embedded in the Identify hidden opportunities business units Interactive visualization Visual user interfaces and the right tool for the right Encourage a culture of inquiry person Training Power users in individual departments Spread the word and highlight the most effective and user-friendly techniques Sharing Internal portals or other collaborative environments Prove that the culture of inquiry is real to publish and discuss inquiries and results markets shift and there are no insights would be to designate, train, and into improving customer satisfaction. compensate the more enthusiastic users Computing speed, storage, and scale in all units—finance, product groups, make those insights possible, and it is supply chain, human resources, and up to management to take advantage so forth—as data scientists. Table 1 of what is becoming a co-creative presents examples of approaches to work environment in all industries— fostering a culture of inquiry. to create a culture of inquiry. The arc of all the trends explored Of course, managing culture change is in this article is leading enterprises a much bigger challenge than simply toward establishing these cultures rolling out more powerful analytics of inquiry, in which decisions can be software. It is best to have several informed by an analytical precision starting points and to continue to find comparable to scientific insight. New ways to emphasize the value of analytics market opportunities, an energized in new scenarios. One way to raise workforce with a stake in helping to awareness about the power of new achieve a better understanding of analytics comes from articulating the customer needs, and reduced risk are results in a visual form that everyone just some of the benefits of a culture of can understand. Another is to enable inquiry. Enterprises that understand the broader workforce to work with the trends described here and capitalize the data themselves and to ask them to on them will be able to improve how develop and share the results of their they attract and retain customers. own analyses. Still another approach Reshaping the workforce with the new analytics 19
  • 20.
    PwC: What’s yourbackground, The nature of cloud- and how did you end up running a data science startup? MD: I came to Silicon Valley after based data science studying computer science and biology for five years, and trying to reverse engineer the genome network for Mike Driscoll of Metamarkets talks about uranium-breathing bacteria. That was my thesis work in grad school. the analytics challenges and opportunities There was lots of modeling and causal that businesses moving to the cloud face. inference. If you were to knock this gene out, could you increase the uptake of the reduction of uranium from a soluble to Interview conducted by Alan Morrison and Bo Parker an insoluble state? I was trying all these simulations and testing with the bugs to see whether you could achieve that. PwC: You wanted to clean up radiation leaks at nuclear plants? Mike Driscoll MD: Yes. The Department of Mike Driscoll is CEO of Metamarkets, Energy funded the research work a cloud-based analytics company he I did. Then I came out here and I co-founded in San Francisco in 2010. gave up on the idea of building a biotech company, because I didn’t think there was enough commercial viability there from what I’d seen. I did think I could take this toolkit I’d developed and apply it to all these other businesses that have data. That was the genesis of the consultancy Dataspora. As we started working with companies at Dataspora, we found this huge gap between what was possible and what companies were actually doing. Right now the real shift is that companies are moving from this very high-latency-course era of reporting into one where they start to have lower latency, finer granularity, and better 20 PwC Technology Forecast 2012 Issue 1
  • 21.
    Some companies don’thave all the capabilities Critical business they need to create data science value. questions Companies need these three capabilities to excel in creating data science value. Value and change Good Data data science visibility into their operations. They expensive relational database. There PwC: How are companies that do realize the problem with being walking needs to be different temperatures have data science groups meeting amnesiacs, knowing what happened of data, and companies need to the challenge? Take the example to their customers in the last 30 days put different values on the data— of an orphan drug that is proven and then forgetting every 30 days. whether it’s hot or cold, whether it’s to be safe but isn’t particularly active. Most companies have only one effective for the application it Most businesses are just now temperature: they either keep it hot in was designed for. Data scientists figuring out that they have this a database, or they don’t keep it at all. won’t know enough about a broad wealth of information about their range of potential biological customers and how their customers PwC: So they could just systems for which that drug might interact with their products. keep it in the cloud? be applicable, but the people MD: Absolutely. We’re starting to who do have that knowledge PwC: On its own, the new see the emergence of cloud-based don’t know the first thing about availability of data creates databases where you say, “I don’t data science. How do you bring demand for analytics. need to maintain my own database those two groups together? MD: Yes. The absolute number-one on the premises. I can just rent some MD: My data science Venn diagram thing driving the current focus in boxes in the cloud and they can helps illustrate how you bring those analytics is the increase in data. What’s persist our customer data that way.” groups together. The diagram has three different now from what happened 30 circles. [See above.] The first circle is years ago is that analytics is the province Metamarkets is trying to deliver data science. Data scientists are good of people who have data to crunch. DaaS—data science as a service. If a at this. They can take data strings, company doesn’t have analytics as a perform processing, and transform What’s causing the data growth? I’ve core competency, it can use a service them into data structures. They have called it the attack of the exponentials— like ours instead. There’s no reason for great modeling skills, so they can use the exponential decline in the cost of companies to be doing a lot of tasks something like R or SAS and start to compute, storage, and bandwidth, that they are doing in-house. You need build a hypothesis that, for example, and the exponential increase in the to pick and choose your battles. if a metric is three standard deviations number of nodes on the Internet. above or below the specific threshold Suddenly the economics of computing We will see a lot of IT functions then someone may be more likely to over data has shifted so that almost all being delivered as cloud-based cancel their membership. And data the data that businesses generate is services. And now inside of those scientists are great at visualization. worth keeping around for its analysis. cloud-based services, you often will find an open source stack. But companies that have the tools and PwC: And yet, companies are expertise may not be focused on a still throwing data away. Here at Metamarkets, we’ve drawn critical business question. A company MD: So many businesses keep only heavily on open source. We have is trying to build what it calls the 60 days’ worth of data. The storage Hadoop on the bottom of our stack, technology genome. If you give them cost is so minimal! Why would you and then at the next layer we have our a list of parts in the iPhone, they can throw it away? This is the shift at the own in-memory distributed database. look and see how all those different big data layer; when these companies We’re running on Amazon Web Services parts are related to other parts in store data, they store it in a very and have hundreds of nodes there. camcorders and laptops. They built this amazingly intricate graph of the Reshaping the workforce with the new analytics 21
  • 22.
    “[Companies] realize theproblem with being walking amnesiacs, knowing what happened to their customers in the last 30 days and then forgetting every 30 days.” actual makeup. They’ve collected large shopping carts?” Well, the company PwC: In many cases, the data amounts of data. They have PhDs from has 600 million shopping cart flows is going to be fresh enough, Caltech; they have Rhodes scholars; that it has collected in the last six because the nature of the business they have really brilliant people. years. So the company says, “All right, doesn’t change that fast. But they don’t have any real critical data science group, build a sequential MD: Real time actually means two business questions, like “How is this model that shows what we need to things. The first thing has to do with going to make me more money?” do to intervene with people who have the freshness of data. The second abandoned their shopping carts and has to do with the query speed. The second circle in the diagram is get them to complete the purchase.” critical business questions. Some By query speed, I mean that if you have companies have only the critical business PwC: The questioning nature of a question, how long it takes to answer questions, and many enterprises fall business—the culture of inquiry— a question such as, “What were your top in this category. For instance, the CEO seems important here. Some products in Malaysia around Ramadan?” says, “We just released a new product who lack the critical business and no one is buying it. Why?” questions don’t ask enough PwC: There’s a third one also, questions to begin with. which is the speed to knowledge. The third circle is good data. A beverage MD: It’s interesting—a lot of businesses The data could be staring you company or a retailer has lots of POS have this focus on real-time data, in the face, and you could have [point of sale] data, but it may not have and yet it’s not helping them get incredibly insightful things in the tools or expertise to dig in and figure answers to critical business questions. the data, but you’re sitting there out fast enough where a drink was Some companies have invested a with your eyes saying, “I don’t selling and what demographics it was lot in getting real-time monitoring know what the message is here.” selling to, so that the company can react. of their systems, and it’s expensive. MD: That’s right. This is about how fast It’s harder to do and more fragile. can you pull the data and how fast can On the other hand, sometimes some you actually develop an insight from it. web companies or small companies A friend of mine worked on the data have critical business questions and team at a web company. That company For learning about things quickly they have the tools and expertise. developed, with a real effort, a real-time enough after they happen, query speed But because they have no customers, log monitoring framework where they is really important. This becomes they don’t have any data. can see how many people are logging a challenge at scale. One of the in every second with 15-second latency problems in the big data space is that PwC: Without the data, they across the ecosystem. It was hard to keep databases used to be fast. You used need to do a simulation. up and it was fragile. It broke down and to be able to ask a question of your MD: Right. The intersection in the Venn they kept bringing it up, and then they inventory and you’d get an answer diagram is where value is created. When realized that they take very few business in seconds. SQL was quick when the you think of an e-commerce company actions in real time. So why devote scale wasn’t large; you could have an that says, “How do we upsell people all this effort to a real-time system? interactive dialogue with your data. and reduce the number of abandoned 22 PwC Technology Forecast 2012 Issue 1
  • 23.
    But now, becausewe’re collecting appliance. We solve the performance millions and millions of events a problem in the cloud. Our mantra is day, data platforms have seen real visibility and performance at scale. performance degradation. Lagging performance has led to degradation Data in the cloud liberates companies of insights. Companies literally from some of these physical box are drowning in their data. confines and constraints. That means that your data can be used as inputs to In the 1970s, when the intelligence other types of services. Being a cloud agencies first got reconnaissance service really reduces friction. The satellites, there was this proliferation coefficient of friction around data has in the amount of photographic data for a long time been high, and I think they had, and they realized that it we’re seeing that start to drop. Not paralyzed their decision making. So to just the scale or amount of data being this point of speed, I think there are a collected, but the ease with which data number of dimensions here. Typically can interoperate with different services, when things get big, they get slow. both inside your company and out. PwC: Isn’t that the problem I believe that’s where tremendous the new in-memory database value lies. appliances are intended to solve? MD: Yes. Our Druid engine on the back end is directly competitive with those proprietary appliances. The biggest difference between those appliances and what we provide is that we’re cloud “Being a cloud service really based and are available on Amazon. reduces friction. The coefficient If your data and operations are in of friction around data has for a the cloud, it does not make sense long time been high, and I think to have your analytics on some we’re seeing that start to drop.” Reshaping the workforce with the new analytics 23
  • 24.
    PwC: What isyour role at the Online advertising FT [Financial Times], and how did you get into it? JS: I’m the global advertising sales analytics in the cloud director for all our digital products. I’ve been in advertising sales and in publishing for about 15 years and at Jon Slade of the Financial Times describes the FT for about 7 years. And about three and a half years ago I took this the 123-year-old business publication’s role—after a quick diversion into advanced approach to its online ad sales. landscape gardening, which really gave me the idea that digging holes for a living was not what I wanted to do. Interview conducted by Alan Morrison, Bo Parker, and Bud Mathaisel PwC: The media business has changed during that period of time. How has the business model at FT.com evolved over the years? JS: From the user’s perspective, FT.com Jon Slade is like a funnel, really, where you have Jon Slade is global online and strategic free access at the outer edge of the advertising sales director at FT.com, the funnel, free access for registration in digital arm of the Financial Times. the middle, and then the subscriber at the innermost part. The funnel is based on the volume of consumption. From an ad sales perspective, targeting the most relevant person is essential. So the types of clients that we’re talking about—companies like PwC, Rolex, or Audi—are not interested in a scatter graph approach to advertising. The advertising business thrives on targeting advertising very, very specifically. On the one hand, we have an ad model that requires very precise, targeted information. And on the other hand, we have a metered model of access, which means we have lots of opportunity to collect information about our users. 24 PwC Technology Forecast 2012 Issue 1
  • 25.
    “We have whatwe call the web app with FT.com. We’re not available through the iTunes Store anymore. We use the technology called HTML5, which essentially allows us to have the same kind of touch screen interaction as an app would, but we serve it through a web page.” PwC: How does a company like the from maybe 1 percent or 2 percent One or two other publishers are starting FT sell digital advertising space? just three years ago. So that’s a to understand that this is a pretty good JS: Every time you view a web page, radically changing picture that we way to push content to mobile devices, you’ll see an advert appear at the top now need to understand as well. and it’s an approach that we’ve been or the side, and that one appearance very successful with. We’ve had more of the ad is what we call an ad What are the consumption patterns than 1.4 million users of our new web impression. We usually sell those in around mobile? How many pages are app since we launched it in June 2011. groups of 1,000 ad impressions. people consuming? What type of content are they consuming? What content is It’s a very fast-growing opportunity Over a 12-month period, our total more relevant to a chief executive versus for us. We see both subscription and user base, including our 250,000 a finance director versus somebody in advertising revenue opportunities. paying subscribers, generates about Japan versus somebody in Dubai? And with FT.com we try to balance 6 billion advertising impressions both of those, both subscription across FT.com. That’s the currency Mobile is a very substantial platform revenue and advertising revenue. that is bought and sold around that we now must look at in much advertising in the online world. more detail and with much greater PwC: You chose the web care than we ever did before. app after having offered In essence, my job is to look at those ad a native app, correct? impressions and work out which one of PwC: Yes, and regarding the JS: That’s right, yes. those ad impressions is worth the most mobile picture, have you seen for any one particular client. And we any successes in terms of trying PwC: Could you compare and have about 2,000 advertising campaigns to address that channel in a contrast the two and what a year that run across FT.com. new and different way? the pros and cons are? JS: Well, just with the FT, we have JS: If we want to change how we Impressions generated have different what we call the web app with FT.com. display content in the web app, it’s a values to different advertisers. So We’re not available through the iTunes lot easier for us not to need to go to a we need to separate all the strands Store anymore. We use the technology new version of the app and push that out of those 6 billion ad impressions called HTML5, which essentially allows through into the native app via an and get as close a picture as we us to have the same kind of touch approval process with a third party. possibly can to generate the most screen interaction as an app would, We can just make any changes at our revenue from those ad impressions. but we serve it through a web page. end straight away. And as users go to the web app, those implemented PwC: It sounds like you have a So a user points the browser on their changes are there for them. lot of complexity on both the iPad or other device to FT.com, and it supply and the demand side. Is takes you straight through to the app. On the back end, it gives us a lot the supply side changing a lot? There’s no downloading of the app; more agility to develop advertising JS: Sure. Mobile is changing things there’s no content update required. We opportunities. We can move faster to pretty dramatically, actually. About can update the infrastructure of the take advantage of a growing market, 20 percent of our page views on digital app very, very easily. We don’t need plus provide far better web-standard channels are now generated by a to push it out through any third party analytics around campaigns—something mobile device or by someone who’s such as Apple. We can retain a direct that native app providers struggle with. using a mobile device, which is up relationship with our customer. Reshaping the workforce with the new analytics 25
  • 26.
    6B Big data in online advertising “Every year, our total user base, including our 250,000 paying subscribers, generates about 6 billion advertising impressions across FT.com.” One other benefit we’ve seen is that a With the readers and users of FT.com, but to our content development far greater number of people use the particularly in the last three years as and our site development, too. web app than ever used the native app. the economic crisis has driven like a So an advertiser is starting to get a bit whirlwind around the globe, we’ve If we know, for example, that people more scale from the process, I guess. But seen what we call a flight to quality. type A-1-7 tend to read companies’ it’s just a quicker way to make changes Users are aware—as are advertisers— pages between 8 a.m. and 10 a.m. to the application with the web app. that they could go to a thousand and they go on to personal finance different places to get their news, but at lunchtime, then we can start to PwC: How about the demand they don’t really have the time to do examine those groups and drive the side? How are things changing? that. They’re going to fewer places and right type of content toward them more You mentioned 6 billion annual spending more time within them, and specifically. It’s an ongoing piece of the impressions—or opportunities, that’s certainly the experience that content and advertising optimization. we might phrase it. we’ve had with the Financial Times. JS: Advertising online falls into two PwC: Is this a test to tune and distinct areas. There is the scatter graph PwC: To make a more targeted adjust the kind of environment type of advertising where size matters. environment for advertising, that you’ve been able to create? There are networks that can give you you need to really learn more JS: Absolutely, both in terms of how billions and billions of ad impressions, about the users themselves, yes? our advertising campaigns display and and as an advertiser, you throw as many JS: Yes. Most of the opt-in really also the type of content that we display. messages into that mix as you possibly occurs at the point of registration and If you and I both looked at FT.com right can. And then you try and work out subscription. This is when the user now, we’d probably see the home page, over time which ones stuck the best, declares demographic information: and 90 percent of what you would see and then you try and optimize to that. this is who I am, this is the industry would be the same as what I would see. That is how a lot of mainstream or that I work for, and here’s the ZIP But about 10 percent of it would not be. major networks run their businesses. code that I work from. Users who subscribe provide a little bit more. PwC: How does Metamarkets fit On the other side, there are very, into this big picture? Could you very targeted websites that provide Most of the work that we do around shine some light on what you’re advertisers with real efficiency to reach understanding our users better occurs doing with them and what the only the type of demographic that at the back end. We examine user initial successes have been? they’re interested in reaching, and that’s actions, and we note that people who JS: Sure. We’ve been working with very much the side that we fit into. demonstrate this type of behavior Metamarkets in earnest for more tend to go on and do this type of thing than a year. The real challenge Over the last two years, there’s been later in the month or the week or the that Metamarkets relieves for us a shift to the extreme on both sides. session or whatever it might be. is to understand those 6 billion ad We’ve seen advertisers go much more impressions—who’s generating toward a very scattered environment, Our back-end analytics allows us to them, how many I’m likely to have and equally other advertisers head much extract certain groups who exhibit tomorrow of any given sort, and how more toward investing more of their those behaviors. That’s probably much I should charge for them. money into a very niche environment. most of the work that we’re focused And then some advertisers seem to on at the moment. And that applies It gives me that single view in a single try and play a little bit in the middle. not just to the advertising picture place in near real time what my exact 26 PwC Technology Forecast 2012 Issue 1
  • 27.
    supply and myexact demand are. PwC: In general, it seems like And that is really critical information. Metamarkets is doing a whole I increasingly feel a little bit like I’m piece of your workflow rather on a flight deck with the number of than you doing it. Is that a screens around me to understand. fair characterization? When I got into advertising straight JS: Yes. I’ll give you an example. I was after my landscape gardening days, talking to our sales manager in Paris the I didn’t even have a screen. I didn’t other day. I said to him, “If you wanted have a computer when I started. to know how many adverts of a certain size that you have available to you in Previously, the way that data was Paris next Tuesday that will be created held—the demographics data, the by chief executives in France, how would behavior data, the pricing, the available you go about getting that answer?” inventory—was across lots of different databases and spreadsheets. We needed Before, the sales team would send an an almost witchcraft-like algorithm e-mail to ad operations in London for an to provide answers to “How many inventory forecast, and it could take the impressions do I have?” and “How ad operations team up to eight working much should I charge?” It was an hours to get back to them. It could even extremely labor-intensive process. take as long as two business days to get an answer in times of high volume. Now, And that approach just didn’t really fit we’ve reduced that turnaround to about the need for the industry in which we eight seconds of self-service, allowing work. Media advertising is purchased in our ad operations team time to focus on real time now. The impression appears, more strategic output. That’s the sort of and this process goes between three magnitude of workflow change that this or four interested parties—one bid creates for us—a two-day turnaround wins out, and the advert is served in down to about eight seconds. the time it takes to open a web page. Now if advertising has been purchased in real time, we really “Before, the sales team would send an need to understand what we have e-mail to ad operations in London for an on our supermarket shelves in real time, too. That’s what Metamarkets inventory forecast, and it could take the does for us—help us visualize in one ad operations team up to eight working place our supply and demand. hours to get back to them. Now, we’ve reduced that turnaround to about eight seconds of self-service.” Reshaping the workforce with the new analytics 27
  • 28.
    PwC: When youwere looking thousands and thousands of ways, in New York if I’m there. And there’s to resolve this problem, were and you can’t always predict how a a lot of back and forth. What seems there a lot of different services client or a customer or a colleague is to happen is that every time we give that did this sort of thing? going to want to split up that data. it to one of the ultimate end users— JS: Not that we came across. I have one of the sales managers around the to say our conversations with the So rather than just say, “The only way world—you can see the lights on in Metamarkets team actually started you can do it is this way, and here’s the their head about the potential for it. about something not entirely off-the-shelf solution,” we really wanted different, but certainly not the something that put the power in the And without fail they’ll say, “That’s product that we’ve come up with hands of the user. And that seems to be brilliant, but how about this and this?” now. Originally we had a slightly what we’ve created here. The credit is Or, “Could we use it for this?” Or, “How different concept under discussion entirely with Metamarkets, I have to say. about this for an intervention?” It’s that didn’t look at this part at all. We just said, “Help, we have a problem,” great. It’s really encouraging to see and they said, “OK, here’s a good a product being taken up by internal As a company, Metamarkets was answer.” So the credit for all the clever customers with the enthusiasm that it is. really prepared to say, “We don’t have stuff behind this should go with them. something on the shelves. We have We very much see this as an iterative some great minds and some really good PwC: So there continues to be a project. We don’t see it as necessarily technology, so why don’t we try to figure lot of back and forth between FT having a specific end in sight. We out with you what your problem is, and and Metamarkets as your needs think there’s always more that we then we’ll come up with an answer.” change and the demand changes? can add into this. It’s pretty close JS: Yes. We have at least a weekly call. to a partnership really, a straight To be honest, we looked around a little The Metamarkets team visits us in vendor and supplier relationship. It bit at what else is out there, but I don’t London about once a month, or we meet is a genuine partnership, I think. want to buy anything off the shelf. I want to work with a company that can understand what I’m after, go away, and come back with the answer to that plus, plus, plus. And that seems to be “So rather than just say, ‘The only way the way Metamarkets has developed. you can do it is this way, and here’s the Other vendors clearly do something off-the-shelf solution,’ we really wanted similar or close, but most of what I’ve something that put the power in the seen comes off the shelf. And we are— we’re quite annoying to work with, I hands of the user.” would say. We’re not really a cookie- cutter business. You can slice and dice those 6 billion ad impressions in 28 PwC Technology Forecast 2012 Issue 1
  • 29.
    Supply accuracy inonline advertising “Accuracy of supply is upward of 15 percent better than what we’ve seen before.” 15% PwC: How is this actually Now that piece is still pretty much do the legal diligence, and of course translated into the bottom line— embryonic, but we’re certainly making we do the contractual diligence, and of yield and advertising dollars? the right moves in that direction. We’ve course we look around to see what else is JS: It would be probably a little hard for found that putting a price up is accepted. available. But if you have a good instinct me to share with you any percentages Essentially what an increase in yield about working with somebody, then or specifics, but I can say that it is implies is that you put your price up. we’re the size of organization where that driving up the yields we achieve. It instinct can still count for something. is double-digit growth on yield as a It’s been accepted because we’ve been result of being able to understand able to offer a much tighter specific And I think that was the case with our supply and demand better. segmentation of that audience. Whereas, Metamarkets. We felt that we were when people are buying on a spray basis talking on the same page here. The degree of accuracy of supply across large networks, deservedly there We almost could put words in one that it provides for us is upward of is significant price pressure on that. another’s mouths and the sentence 15 percent better than what we’ve would still kind of form. So it felt seen before. I can’t quantify the Equally, if we understand our supply very good from the beginning. difference that it’s made to workflows, and demand picture in a much more but it’s significant. To go to a two- granular sense, we know when it’s a If we look at what’s happening in the day turnaround on a simple request good time to walk away from a deal digital publishing world, some of the to eight seconds is significant. or whether we’re being too bullish in most exciting things are happening the deal. That pricing piece is critical, with very small startup businesses PwC: Given our research focus, and we’re looking to get to a real- and all of the big web powers now we have lots of friends in the time dynamic pricing model in 2012. were startups 8 or 10 years ago, publishing business, and many And Metamarkets is certainly along such as Facebook and Amazon. of them talked to us about the the right lines to help us with that. decline in return from impression We believe in that mentality. We advertising. It’s interesting. PwC: A lot of our clients are very believe in a personality in business. Your story seems to be pushing conservative organizations, Metamarkets represented that to us in the different direction. and they might be reluctant very well. And yes, there’s a little bit of a JS: Yes. I’ve noticed that entirely. to subscribe to a cloud service risk, but it has paid off. So we’re happy. Whenever I talk to a buying customer, like Metamarkets, offered by they always say, “Everybody else a company that has not been is getting cheaper, so how come around for a long time. I’m you’re getting more expensive?” assuming that the FT had to make the decision to go I completely hear that. What I would say on this different route and is we are getting better at understanding that there was quite a bit of the attribution model. Ultimately, consideration of these factors. what these impressions create for a JS: Endless legal diligence would be client or a customer is not just how one way to put it—back and forth a lot. many visits will readers make to your We have 2,000 employees worldwide, website, but how much money will so we still have a fairly entrepreneurial they spend when they get there. attitude toward suppliers. Of course we Reshaping the workforce with the new analytics 29
  • 30.
    30 PwC Technology Forecast 2012 Issue 1
  • 31.
    The art andscience of new analytics technology Left-brain analysis connects with right-brain creativity. By Alan Morrison The new analytics is the art and science • In-memory technology—Reducing of turning the invisible into the visible. response time and expanding It’s about finding “unknown unknowns,” the reach of business intelligence as former US Secretary of Defense (BI) by extending the use of main Donald Rumsfeld famously called them, (random access) memory and learning at least something about them. It’s about detecting opportunities • Interactive visualization—Merging and threats you hadn’t anticipated, or the user interface and the presentation finding people you didn’t know existed of results into one responsive who could be your next customers. It’s visual analytics environment about learning what’s really important, rather than what you thought was • Statistical rigor—Bringing more of important. It’s about identifying, the scientific method and evidence committing, and following through on into corporate decision making what your enterprise must change most. • Associative search—Navigating to Achieving that kind of visibility specific names and terms by browsing requires a mix of techniques. Some the nearby context (see the sidebar, of these are new, while others aren’t. “Associative search,” on page 41) Some are clearly in the realm of data science because they make possible A companion piece to this article, more iterative and precise analysis “Natural language processing and of large, mixed data sets. Others, like social media intelligence,” on page 44, visualization and more contextual reviews the methods that vendors use search, are as much art as science. for the needle-in-a-haystack challenge of finding the most relevant social This article explores some of the newer media conversations about particular technologies that make feasible the case products and services. Because social studies and the evolving cultures of media is such a major data source for inquiry described in “The third wave of exploratory analytics and because customer analytics” on page 06. These natural language processing (NLP) technologies include the following: techniques are so varied, this topic demands its own separate treatment. Reshaping the workforce with the new analytics 31
  • 32.
    Figure 1: Addressableanalytics footprint for in-memory technology In-memory technology augmented traditional business intelligence (BI) and predictive analytics to begin with, but its footprint will expand over the forecast period to become the base for corporate apps, where it will blur the boundary between transactional systems and data warehousing. Longer term, more of a 360-degree view of the customer can emerge. 2011 2012 2013 2014 BI + Cross- ERP and functional, mobile + cross-source Other corporate analytics apps In-memory technology users were limited to BI suites such Enterprises exploring the latest as BusinessObjects to push the in-memory technology soon come information to mobile devices,” says to realize that the technology’s Murali Chilakapati, a manager in PwC’s fundamental advantage—expanding the Information Management practice and capacity of main memory (solid-state a HANA implementer. “Now they’re memory that’s directly accessible) and going beyond BI. I think in-memory reducing reliance on disk drive storage is one of the best technologies that to reduce latency—can be applied in will help us to work toward a better many different ways. Some of those overall mobile analytics experience.” applications offer the advantage of being more feasible over the short term. For The full vision includes more cross- example, accelerating conventional BI functional, cross-source analytics, but is a short-term goal, one that’s been this will require extensive organizational feasible for several years through earlier and technological change. The products that use in-memory capability fundamental technological change is from some BI providers, including already happening, and in time richer MicroStrategy, QlikTech QlikView, applications based on these changes will TIBCO Spotfire, and Tableau Software. emerge and gain adoption. (See Figure 1.) “Users can already create a mashup Longer term, the ability of platforms of various data sets and technology such as Oracle Exalytics, SAP HANA, to determine if there is a correlation, and the forthcoming SAS in-memory a trend,” says Kurt J. Bilafer, regional Hadoop-based platform1 to query vice president of analytics at SAP. across a wide range of disparate data sources will improve. “Previously, To understand how in-memory advances will improve analytics, it will help to consider the technological advantages 1 See Doug Henschen, “SAS Prepares Hadoop- Powered In-Memory BI Platform,” InformationWeek, of hardware and software, and how February 14, 2012, http://www.informationweek.com/ they can be leveraged in new ways. news/hardware/grid_cluster/232600767, accessed February 15, 2012. SAS, which also claims interactive visualization capabilities in this appliance, expects to make this appliance available by the end of June 2012. 32 PwC Technology Forecast 2012 Issue 1
  • 33.
    What in-memory technologydoes Memory swapping Figure 2: Memory swapping For decades, business analytics has been plagued by slow response Swapping data from RAM to disk times (also known as latency), a introduces latency that in-memory systems designs can now avoid. problem that in-memory technology helps to overcome. Latency is due to input/output bottlenecks in RAM a computer system’s data path. These bottlenecks can be alleviated Block out Block in by using six approaches: • Move the traffic through more paths (parallelization) Steps that introduce latency • Increase the speed of any single path (transmission) • Reduce the time it takes to switch paths (switching) • Reduce the time it takes to store bits (writing) • Reduce the time it takes to retrieve bits (reading) • Reduce computation time (processing) To process and store data properly access memory (RAM) rather than and cost-effectively, computer frequently reading it from and writing systems swap data from one kind of it to disk—makes it possible to bypass memory to another a lot. Each time many input/output bottlenecks. they do, they encounter latency in transmitting, switching, writing, Systems have needed to do a lot of or reading bits. (See Figure 2.) swapping, in part, because faster storage media were expensive. That’s Contrast this swapping requirement with why organizations have relied heavily processing alone. Processing is much on high-capacity, cheaper disks for faster because so much of it is on-chip or storage. As transistor density per square directly interconnected. The processing millimeter of chip area has risen, the function always outpaces multitiered cost per bit to use semiconductor (or memory handling. If these systems solid-state) memory has dropped and can keep more data “in memory” the ability to pack more bits in a given or directly accessible to the central chip’s footprint has increased. It is now processing units (CPUs), they can avoid more feasible to use semiconductor swapping and increase efficiency by memory in more places where it accelerating inputs and outputs. can help most, and thereby reduce reliance on high-latency disks. Less swapping reduces the need for duplicative reading, writing, and Of course, the solid-state memory used moving data. The ability to load and in direct access applications, dynamic work on whole data sets in main random access memory (DRAM), is memory—that is, all in random volatile. To avoid the higher risk of Reshaping the workforce with the new analytics 33
  • 34.
    Write-behind caching Figure 3: Write-behind caching management practice, notes: “Having a big data set in one location gives you Write-behind caching makes writes to more flexibility.” T-Mobile, one of SAP’s disk independent of other write functions. customers for HANA, claims that reports that previously took hours to generate CPU now take seconds. HANA did require Reader Writer extensive tuning for this purpose.2 Appliances with this level of main RAM memory capacity started to appear in late 2010, when SAP first offered HANA to select customers. Oracle soon followed by announcing its Exalytics In-Memory Machine at OpenWorld Write in October 2011. Other vendors well behind known in BI, data warehousing, and database technology are not far behind. Taking full advantage of in-memory technology depends on hardware and software, which requires extensive supplier/provider partnerships even before any thoughts of implementation. Source: Gigaspaces and PwC, 2010 and 2012 T-Mobile, one of SAP’s Rapid expansion of in-memory customers for HANA, hardware. Increases in memory bit data loss from expanding the use of density (number of bits stored in a claims that reports DRAM, in-memory database systems square millimeter) aren’t qualitatively that previously took incorporate a persistence layer with new; the difference now is quantitative. backup, restore, and transaction What seems to be a step-change in hours to generate now logging capability. Distributed caching in-memory technology has actually take seconds. systems or in-memory data grids been a gradual change in solid- such as Gigaspaces XAP data grid, state memory over many years. memcached, and Oracle Coherence— which cache (or keep in a handy place) Beginning in 2011, vendors could install lots of data in DRAM to accelerate at least a terabyte of main memory, website performance—refer to this usually DRAM, in a single appliance. same technique as write-behind caching. Besides adding DRAM, vendors are These systems update databases on also incorporating large numbers of disk asynchronously from the writes multicore processors in each appliance. to DRAM, so the rest of the system The Exalytics appliance, for example, doesn’t need to wait for the disk write includes four 10-core processors.3 process to complete before performing another write. (See Figure 3.) The networking capabilities of the new appliances are also improved. How the technology benefits the analytics function 2 Chris Kanaracus, “SAP’s HANA in-memory database The additional speed of improved will run ERP this year,” IDG News Service, via InfoWorld, in-memory technology makes possible January 25, 2012, http://www.infoworld.com/d/ applications/saps-hana-in-memory-database-will-run- more analytics iterations within a erp-year-185040, accessed February 5, 2012. given time. When an entire BI suite 3 Oracle Exalytics In-Memory Machine: A Brief is contained in main memory, there Introduction, Oracle white paper, October 2011, http:// www.oracle.com/us/solutions/ent-performance-bi/ are many more opportunities to query business-intelligence/exalytics-bi-machine/overview/ the data. Ken Campbell, a director in exalytics-introduction-1372418.pdf, accessed February 1, 2012. PwC’s information and enterprise data 34 PwC Technology Forecast 2012 Issue 1
  • 35.
    Use case examples Exalyticshas two 40Gbps InfiniBand Business process advantages connections for low-latency database server connections and two 10 Gigabit of in-memory technology Ethernet connections, in addition to lower-speed Ethernet connections. In-memory technology makes in-memory technology. Analysts could Effective data transfer rates are it possible to run queries that identify new patterns of fraud in tax somewhat lower than the stated raw previously ran for hours in minutes, return data in ways they hadn’t been able speeds. InfiniBand connections became which has numerous implications. to before, making it feasible to provide more popular for high-speed data Running queries faster implies the investigators more helpful leads, which center applications in the late 2000s. ability to accelerate data-intensive in turn could make them more effective With each succeeding generation, business processes substantially. in finding and tracking down the most InfiniBand’s effective data transfer potentially harmful perpetrators before rate has come closer to the raw rate. Take the case of supply chain their methods become widespread. Fourteen data rate or FDR InfiniBand, optimization in the electronics which has a raw data lane rate of more industry. Sometimes it can take 30 Competitive advantage in these cases than 14Gbps, became available in 2011.4 hours or more to run a query from a hinges on blending effective strategy, business process to identify and fill means, and execution together, not gaps in TV replenishment at a retailer, just buying the new technology and Improvements in in-memory for example. A TV maker using an installing it. In these examples, the databases. In-memory databases are in-memory appliance component in challenge becomes not one of simply quite fast because they are designed to this process could reduce the query using a new technology, but using it run entirely in main memory. In 2005, time to under an hour, allowing the effectively. How might the TV maker Oracle bought TimesTen, a high-speed, maker to reduce considerably the time anticipate shortfalls in supply more in-memory database provider serving it takes to respond to supply shortfalls. readily? What algorithms might be most the telecom and trading industries. effective in detecting new patterns of With the help of memory technology Or consider the new ability to tax return fraud? At its best, in-memory improvements, by 2011, Oracle claimed incorporate into a process more technology could trigger many creative that entire BI system implementations, predictive analytics with the help of ideas for process improvement. such as Oracle BI server, could be held in main memory. Federated databases— multiple autonomous databases that can be run as one—are also possible. “I can federate data from five physical with SAP porting its enterprise resource databases in one machine,” says PwC planning (ERP) module to HANA Applied Analytics Principal Oliver Halter. beginning in the fourth quarter of 2012, followed by other modules.5 In 2005, SAP bought P*Time, a highly parallelized online transaction Better compression. In-memory processing (OLTP) database, and appliances use columnar compression, has blended its in-memory database which stores similar data together to capabilities with those of TREX and improve compression efficiency. Oracle MaxDB to create the HANA in-memory claims a columnar compression capability database appliance. HANA includes of 5x, so physical capacity of 1TB is stores for both row (optimal for equivalent to having 5TB available. transactional data with many fields) Other columnar database management and column (optimal for analytical data system (DBMS) providers such as with fewer fields), with capabilities EMC/Greenplum, IBM/Netezza, and for both structured and less structured HP/Vertica have refined their own data. HANA will become the base for columnar compression capabilities the full range of SAP’s applications, over the years and will be able to apply these to their in-memory appliances. 4 See “What is FDR InfiniBand?” at the InfiniBand Trade Association site (http://members.infinibandta.org/ kwspub/home/7423_FDR_FactSheet.pdf, accessed 5 Chris Kanaracus, op. cit. February 10, 2012) for more information on InfiniBand availability. Reshaping the workforce with the new analytics 35
  • 36.
    More adaptive andefficient caching data such as fact tables (for example, a algorithms. Because main memory list of countries) that the system needs is still limited physically, appliances at hand. The algorithms haven’t been continue to make extensive use of smart enough to recognize less used advanced caching techniques that but clearly essential fact tables that increase the effective amount of could be easily cached in main memory main memory. The newest caching because they are often small anyway. algorithms—lists of computational procedures that specify which data Generally speaking, progress has to retain in memory—solve an old been made on many fronts to improve problem: tables that get dumped in-memory technology. Perhaps most from memory when they should be importantly, system designers have maintained in the cache. “The caching been able to overcome some of the strategy for the last 20 years relies hardware obstacles preventing the on least frequently used algorithms,” direct connections the data requires Halter says. “These algorithms aren’t so it can be processed. That’s a always the best approaches.” The term fundamental first step of a multi- least frequently used refers to how these step process. Although the hardware, algorithms discard the data that hasn’t caching techniques, and some software been used a lot, at least not lately. exist, the software refinement and expansion that’s closer to the bigger The method is good in theory, but in vision will take years to accomplish. practice these algorithms can discard “The caching strategy for the last 20 years relies on least frequently used algorithms. These algorithms aren’t always the best approaches.” —Oliver Halter, PwC 36 PwC Technology Forecast 2012 Issue 1
  • 37.
    Figure 4: Datablending In self-service BI software, the end user can act as an analyst. Sales database Territory spreadsheet A B C Customer name Container State Last n days Product category State abbreviated Order date Profit Population, 2009 Order ID State Territory Order priority ZIP code Tableau recognizes identical fields in different data sets. Simple drag and drop replaces days of programming. Database You can combine, filter, and even perform calculations among different Spreadsheet data sources right in the Tableau window. Source: Tableau Software, 2011 Derived from a video at http://www.tableausoftware.com/videos/data-integration Self-service BI and In the most visually capable BI tools, interactive visualization the presentation of data becomes just One of BI’s big challenges is to make it another feature of the user interface. easier for a variety of end users to ask Figure 4 illustrates how Tableau, questions of the data and to do so in an for instance, unifies data blending, iterative way. Self-service BI tools put analysis, and dashboard sharing within a larger number of functions within one person’s interactive workflow. reach of everyday users. These tools can also simplify a larger number of How interactive visualization works tasks in an analytics workflow. Many One important element that’s been tools—QlikView, Tableau, and TIBCO missing from BI and analytics platforms Spotfire, to name a few—take some is a way to bridge human language in the advantage of the new in-memory user interface to machine language more technology to reduce latency. But effectively. User interfaces have included equally important to BI innovation features such as drag and drop for are interfaces that meld visual ways decades, but drag and drop historically of blending and manipulating the has been linked to only a single data with how it’s displayed and application function—moving a file how the results are shared. from one folder to another, for example. Reshaping the workforce with the new analytics 37
  • 38.
    Figure 5: Bridginghuman, visual, and machine language 1. To the user, results come from a simple 2. Behind the scenes, complex algebra actually makes the motor run. Hiding all the drag and drop, which encourages complexities of the VizQL computations saves time and frees the user to focus on the experimentation and further inquiry. results of the query, rather than the construction of the query. 552 1104 556 550 612 614 Database Specification Compute x: { (c1, a1)…(ck, bj ) } Construct x: C*(A+B) normalized set y: { (c1), …(d l ), (e1), …(em ) } table and General y: D+E form of each z: { (f1), …(fn ) } sorting queries Z: F table expression network Spreadsheet Iod: G … z x, y 720 Query results Partition into relations corresponding to panes 616 Data interpreter Visual interpreter Per pane aggregation and sorting of tuples Each tuple is rendered as a mark; data is encoded in color, size, etc. Source: Chris Stolte, Diane Tang, and Pat Hanrahan, “Computer systems and methods for the query and visualization of multidimensional databases,” United States Patent 7089266, Stanford University, 2006, http://www.freepatentsonline.com/7089266.html, accessed February 12, 2012. To query the data, users have resorted Jock Mackinlay, director of visual to typing statements in languages analysis at Tableau Software, puts it such as SQL that take time to learn. this way: “The algebra is a crisp way to give the hardware a way to interpret What a tool such as Tableau does the data views. That leads to a really differently is to make manipulating simple user interface.” (See Figure 5.) the data through familiar techniques (like drag and drop) part of an ongoing The benefits of interactive visualization dialogue with the database extracts Psychologists who study how humans that are in active memory. By doing so, learn have identified two types: left- the visual user interface offers a more brain thinkers, who are more analytical, seamless way to query the data layer. logical, and linear in their thinking, and right-brain thinkers, who take a more Tableau uses what it calls Visual Query synthetic parts-to-wholes approach Language (VizQL) to create that that can be more visual and focused on dialogue. What the user sees on the relationships among elements. Visually screen, VizQL encodes into algebraic oriented learners make up a substantial expressions that machines interpret and portion of the population, and adopting execute in the data. VizQL uses table tools more friendly to them can be the algebra developed for this approach difference between creating a culture that maps rows and columns to the of inquiry, in which different thinking x- and y-axes and layers to the z-axis.6 styles are applied to problems, and making do with an isolated group of 6 See Chris Stolte, Diane Tang, and Pat Hanrahan, “Polaris: A System for Query, Analysis, and Visualization of Multidimensional Databases,” Communications of the ACM, November 2008, 75–76, http:// mkt.tableausoftware.com/files/Tableau-CACM-Nov- 2008-Polaris-Article-by-Stolte-Tang-Hanrahan.pdf, accessed February 10, 2012, for more information on the table algebra Tableau uses. 38 PwC Technology Forecast 2012 Issue 1
  • 39.
    Good visualizations without statisticians.(See the article, “How CIOs can build the foundation for a data normalized data science culture,” on page 58.) The new class of visually interactive, Business analytics software generally the data is already set up for the self-service BI tools can engage parts of assumes that the underlying data is analytical processing that machines the workforce—including right-brain reasonably well designed, providing can undertake, the Freemix designers thinkers—who may not have been powerful tools for visualization and the concluded that the machine needs help previously engaged with analytics. exploration of scenarios. Unfortunately, from the user to establish context, and well-designed, structured information made generating that context feasible At Seattle Children’s Hospital, the is a rarity in some domains. for even an unsophisticated user. director of knowledge management, Interactive tools can help refine a Ted Corbett, initially brought Tableau user’s questions and combine data, Freemix walks the user through into the organization. Since then, but often demand a reasonably the process of adding context to according to Elissa Fink, chief marketing normalized schematic framework. the data by using annotations and officer of Tableau Software, its use has augmentation. It then provides plug- spread to include these functions: Zepheira’s Freemix product, the ins to normalize fields, and it enhances foundation of the Viewshare.org project data with new, derived fields (from from the US Library of Congress, geolocation or entity extraction, for • Facilities optimization— works with less-structured data, even example). These capabilities help the Making the best use of scarce comma-separated values (CSV) files user display and analyze data quickly, operating room resources with no headers. Rather than assuming even when given only ragged inputs. • Inventory optimization— Reducing the tendency for nurses to hoard or stockpile supplies by providing visibility into what’s available hospital-wide The QlikTech QlikView 11 also integrates • Test order reporting—Ensuring tests with Microsoft SharePoint and is based on ordered in one part of the hospital an HTML5 web application architecture aren’t duplicated in another part suitable for tablets and other handhelds.8 • Financial aid identification Bringing more statistical and matching—Expediting a rigor to business decisions match between needy parents Sports continue to provide examples whose children are sick and of the broadening use of statistics. In a financial aid source the United States several years ago, Billy Beane and the Oakland Athletics The proliferation of iPad devices, other baseball team, as documented in tablets, and social networking inside the Moneyball by Michael Lewis, hired enterprise could further encourage the statisticians to help with recruiting adoption of this class of tools. TIBCO and line-up decisions, using previously Spotfire for iPad 4.0, for example, little-noticed player metrics. Beane integrates with Microsoft SharePoint had enough success with his method and tibbr, TIBCO’s social tool.7 that it is now copied by most teams. 7 Chris Kanaracus, “Tibco ties Spotfire business 8 Erica Driver, “QlikView Supports Multiple intelligence to SharePoint, Tibbr social network,” Approaches to Social BI,” QlikCommunity, June InfoWorld, November 14, 2011, http:// 24, 2011, http://community.qlikview.com/blogs/ www.infoworld.com/d/business-intelligence/tibco-ties- theqlikviewblog/2011/06/24/with-qlikview-you-can- spotfire-business-intelligence-sharepoint-tibbr-social- take-various-approaches-to-social-bi, and Chris network-178907, accessed February 10, 2012. Mabardy, “QlikView 11—What’s New On Mobile,” QlikCommunity, October 19, 2011, http:// community.qlikview.com/blogs/theqlikviewblog /2011/10/19, accessed February 10, 2012. Reshaping the workforce with the new analytics 39
  • 40.
    In 2012, there’sa debate over whether theme park and can reduce the longest US football teams should more seriously wait times for rides, that is a clear way consider the analyses of academics such to improve customer satisfaction, and it as Tobias Moskowitz, an economics may pay off more and be less expensive professor at the University of Chicago, than reducing the average wait time. who co-authored a book called Scorecasting. He analyzed 7,000 fourth- Much of the utility of statistics is to down decisions and outcomes, including confront old thinking habits with valid field positions after punts and various findings that may seem counterintuitive other factors. His conclusion? Teams to those who aren’t accustomed to should punt far less than they do. working with statistics or acting on the “There are certain basis of their findings. Clearly there This conclusion contradicts the common is utility in counterintuitive but valid statistical principles wisdom among football coaches: even findings that have ties to practical and concepts that lie with a 75 percent chance of making a business metrics. They get people’s first down when there’s just two yards to attention. To counter old thinking habits, underneath all the go, coaches typically choose to punt on businesses need to raise the profiles of sophisticated methods. fourth down. Contrarians, such as Kevin statisticians, scientists, and engineers Kelley of Pulaski Academy in Little Rock, who are versed in statistical methods, You can get a lot out Arkansas, have proven Moskowitz right. and make their work more visible. That of or you can go far Since 2003, Kelley went for it on fourth in turn may help to raise the visibility down (in various yardage situations) of statistical analysis by embedding without having to do 500 times and has a 49 percent success statistical software in the day-to-day complicated math.” rate. Pulaski Academy has won the business software environment. state championship three times —Kaiser Fung, since Kelley became head coach.9 R: Statistical software’s open source evolution New York University Addressing the human factor Until recently, statistical software As in the sports examples, statistical packages were in a group by themselves. analysis applied to business can College students who took statistics surface findings that contradict long- classes used a particular package, and held assumptions. But the basic the language it used was quite different principles aren’t complicated. “There from programming languages such as are certain statistical principles Java. Those students had to learn not and concepts that lie underneath only a statistical language, but also other all the sophisticated methods. You programming languages. Those who can get a lot out of or you can go far didn’t have this breadth of knowledge without having to do complicated of languages faced limitations in what math,” says Kaiser Fung, an adjunct they could do. Others who were versed professor at New York University. in Python or Java but not a statistical package were similarly limited. Simply looking at variability is an example. Fung considers variability What’s happened since then is the a neglected factor in comparison to proliferation of R, an open source averages, for example. If you run a statistical programming language that lends itself to more uses in 9 Seth Borenstein, “Unlike Patriots, NFL slow to embrace ‘Moneyball’,” Seattle Times, February 3, 2012, http://seattletimes.nwsource.com/html/ sports/2017409917_apfbnsuperbowlanalytics.html, accessed February 10, 2012. 40 PwC Technology Forecast 2012 Issue 1
  • 41.
    Associative search business environments.R has become popular in universities and now has Particularly for the kinds of enterprise At any time, users can see not only what thousands of ancillary open source databases used in business intelligence, data is associated—but what data is applications in its ecosystem. In its latest simple keyword search goes only so not related. The data related to their incarnations, it has become part of the far. Keyword searches often come selections is highlighted in white while fabric of big data and more visually up empty for semantic reasons—the unrelated data is highlighted in gray. oriented analytics environments. users doing the searching can’t guess the term in a database that comes In the case of QlikView’s associative R in open source big data closest to what they’re looking for. search, users type relevant words or environments. Statisticians have phrases in any order and get quick, typically worked with small data To address this problem, self-service BI associative results. They can search sets on their laptops, but now they tools such as QlikView offer associative across the entire data set, and with can work with R directly on top of search. Associative search allows search boxes on individual lists, users Hadoop, an open source cluster users to select two or more fields and can confine the search to just that computing environment.10 Revolution search occurrences in both to find field. Users can conduct both direct Analytics, which offers a commercial references to a third concept or name. and indirect searches. For example, R distribution, created a Hadoop if a user wanted to identify a sales interface for R in 2011, so R users will With the help of this technique, users rep but couldn’t remember the sales not be required to use MapReduce or can gain unexpected insights and rep’s name—just details about the Java.11 The result is a big data analytics make discoveries by clearly seeing person, such as that he sells fish to capability for R statisticians and how data is associated—sometimes customers in the Nordic region— programmers that didn’t exist before, for the very first time. They ask a the user could search on the sales stream of questions by making a series rep list box for “Nordic” and “fish” one that requires no additional skills. of selections, and they instantly see to narrow the search results to just all the fields in the application filter sellers who meet those criteria. R convertible to SQL and part of themselves based on their selections. the Oracle big data environment. In January 2012, Oracle announced Oracle R Enterprise, its own distribution of R, which is bundled with a Hadoop distribution in its big interactive visualization.13 R is best data appliance. With that distribution, known for its statistical analysis R users can run their analyses in the capabilities, not its interface. However, Oracle 11G database. Oracle claims interactive visualization tools such performance advantages when as Omniscope are beginning to running in its own database.12 offer integration with R, improving the interface significantly. Integrating interactive visualization with R. One of the newest capabilities The resulting integration makes it involving R is its integration with possible to preview data from various sources, drag and drop from those sources and individual R statistical 10 See “Making sense of Big Data,” Technology Forecast 2010, Issue 3, http://www.pwc.com/us/en/technology- operations, and drag and connect forecast/2010/issue3/index.jhtml, and Architecting the to combine and display results. data layer for analytic applications, PwC white paper, Spring 2011, http://www.pwc.com/us/en/increasing- Users can view results in either a it-effectiveness/assets/pwc-data-architecture.pdf, data manager view or a graph view accessed April 5, 2012, to learn more about Hadoop and other NoSQL databases. and refine the visualization within 11 Timothy Prickett Morgan, “Revolution speeds stats on either or both of those views. Hadoop clusters,” The Register, September 27, 2011, http://www.theregister.co.uk/2011/09/27/revolution_r_ hadoop_integration/, accessed February 10, 2012. 13 See Steve Miller, “Omniscope and R,” Information 12 Doug Henschen, “Oracle Analytics Package Expands Management, February 7, 2012, http:// In-Database Processing Options,” InformationWeek, www.information-management.com/blogs/data- February 8, 2012, http://informationweek.com/news/ science-agile-BI-visualization-Visokio-10021894-1.html software/bi/232600448, accessed February 10, 2012. and the R Statistics/Omniscope 2.7 video, http://www.visokio.com/featured-videos, accessed February 8, 2012. Reshaping the workforce with the new analytics 41
  • 42.
    R has benefittedgreatly from its status There is clear promise in harnessing in the open source community, and the power of a larger proportion of the this has brought it into a mainstream whole workforce with one aspect or data analysis environment. There another of the new analytics. But that’s is potential now for more direct not the only promise. There’s also the collaboration between the analysts and promise of more data and more insight the statisticians. Better visualization about the data for staff already fully and tablet interfaces imply an engaged in BI, because of processes ability to convey statistically based that are instrumented closer to the information more powerfully and action; the parsing and interpretation directly to an executive audience. of prose, not just numbers; the speed that questions about the data can be Conclusion: No lack of vision, asked and answered; the ability to resources, or technology establish whether a difference is random The new analytics certainly doesn’t lack error or real and repeatable; and the for ambition, vision, or technological active engagement with analytics that innovation. SAP intends to base interactive visualization makes possible. its new applications architecture These changes can enable a company to on the HANA in-memory database be highly responsive to its environment, appliance. Oracle envisions running guided by a far more accurate whole application suites in memory, understanding of that environment. starting with BI. Others that offer BI or columnar database products have There are so many different ways now to similar visions. Tableau Software and optimize pieces of business processes, to others in interactive visualization reach out to new customers, to debunk continue to refine and expand a visual old myths, and to establish realities language that allows even casual users that haven’t been previously visible. Of to extract, analyze, and display in a few course, the first steps are essential— drag-and-drop steps. More enterprises putting the right technologies in place are keeping their customer data can set organizations in motion toward longer, so they can mine the historical a culture of inquiry and engage those record more effectively. Sensors who haven’t been fully engaged. are embedded in new places daily, generating ever more data to analyze. 42 PwC Technology Forecast 2012 Issue 1
  • 43.
    There are somany different ways now to optimize pieces of business processes, to reach out to new customers, to debunk old myths, and to establish realities that haven’t been previously visible. Of course, the first steps are essential—putting the right technologies in place can set organizations in motion toward a culture of inquiry. The new analytics certainly doesn’t lack for ambition, vision, or technological innovation. Reshaping the workforce with the new analytics 43
  • 44.
    44 PwC Technology Forecast 2012 Issue 1
  • 45.
    Natural language processing andsocial media intelligence Mining insights from social media data requires more than sorting and counting words. By Alan Morrison and Steve Hamby Most enterprises are more than eager Auker cites the example of a media to further develop their capabilities in company’s use of SocialRep,2 a tool social media intelligence (SMI)—the that uses a mix of natural language ability to mine the public social media processing (NLP) techniques to scan cloud to glean business insights and act social media. Preliminary scanning for on them. They understand the essential the company, which was looking for a value of finding customers who discuss gentler approach to countering piracy, products and services candidly in public led to insights about how motivations forums. The impact SMI can have goes for movie piracy differ by geography. “In beyond basic market research and test India, it’s the grinding poverty. In Eastern marketing. In the best cases, companies Europe, it’s the underlying socialist can uncover clues to help them revisit culture there, which is, ‘my stuff is your product and marketing strategies. stuff.’ There, somebody would buy a film and freely copy it for their friends. “Ideally, social media can function In either place, though, intellectual as a really big focus group,” says Jeff property rights didn’t hold the same Auker, a director in PwC’s Customer moral sway that they did in some Impact practice. Enterprises, which other parts of the world,” Auker says. spend billions on focus groups, spent nearly $1.6 billion in 2011 on social This article explores the primary media marketing, according to Forrester characteristics of NLP, which is the Research. That number is expected to key to SMI, and how NLP is applied grow to nearly $5 billion by 2016.1 to social media analytics. The article considers what’s in the realm of the possible when mining social media 1 Shar VanBoskirk, US Interactive Marketing Forecast, 2011 To 2016, Forrester Research report, August 24, text, and how informed human 2011, http://www.forrester.com/rb/Research/us_ analysis becomes essential when interactive_marketing_forecast%2C_2011_to_2016/q/ id/59379/t/2, accessed February 12, 2012. interpreting the conversations that machines are attempting to evaluate. 2 PwC has joint business relationships with SocialRep, ListenLogic, and some of the other vendors mentioned in this publication. Reshaping the workforce with the new analytics 45
  • 46.
    Natural language processing: Types of NLP Its components and social NLP consists of several subareas of media applications computer-assisted language analysis, NLP technologies for SMI are just ways to help scale the extraction of emerging. When used well, they serve meaning from text or speech. NLP as a more targeted, semantically based software has been used for several complement to pure statistical analysis, years to mine data from unstructured which is more scalable and able to data sources, and the software had its tackle much larger data sets. While origins in the intelligence community. statistical analysis looks at the relative During the past few years, the locus frequencies of word occurrences and has shifted to social media intelligence “It takes very rare the relationships between words, and marketing, with literally NLP tries to achieve deeper insights hundreds of vendors springing up. skill sets in the NLP into the meanings of conversations. community to figure NLP techniques span a wide range, The best NLP tools can provide a level from analysis of individual words and this stuff out. It’s of competitive advantage, but it’s a entities, to relationships and events, to incredibly processing challenging area for both users and phrases and sentences, to document- vendors. “It takes very rare skill sets level analysis. (See Figure 1.) The and storage intensive, in the NLP community to figure this primary techniques include these: and it takes awhile. stuff out,” Auker says. “It’s incredibly processing and storage intensive, Word or entity (individual If you used pure NLP and it takes awhile. If you used pure element) analysis to tell me everything NLP to tell me everything that’s going on, by the time you indexed all • Word sense disambiguation— that’s going on, by the the conversations, it might be days Identifies the most likely meaning of time you indexed all or weeks later. By then, the whole ambiguous words based on context universe isn’t what it used to be.” and related words in the text. For the conversations, it example, it will determine if the word might be days or weeks First-generation social media monitoring “bank” refers to a financial institution, tools provided some direct business the edge of a body of water, the act of later. By then, the whole value, but they also left users with more relying on something, or one of the universe isn’t what it questions than answers. And context was word’s many other possible meanings. a key missing ingredient. Rick Whitney, used to be.” a director in PwC’s Customer Impact • Named entity recognition practice, makes the following distinction (NER)—Identifies proper nouns. —Jeff Auker, PwC between the first- and second- Capitalization analysis can help with generation SMI tools: “Without good NER in English, for instance, but NLP, the first-generation tools don’t capitalization varies by language give you that same context,” he says. and is entirely absent in some. What constitutes good NLP is open • Entity classification—Assigns to debate, but it’s clear that some categories to recognized entities. of the more useful methods blend For example, “John Smith” might different detailed levels of analysis be classified as a person, whereas and sophisticated filtering, while “John Smith Agency” might be others stay attuned to the full context classified as an organization, or more of the conversations to ensure that specifically “insurance company.” novel and interesting findings that inadvertently could be screened out make it through the filters. 46 PwC Technology Forecast 2012 Issue 1
  • 47.
    Figure 1: Thevaried paths to meaning in text analytics Machines need to review many different kinds of clues to be able to deliver meaningful results to users. Documents Metadata Words Lexical Sentences graphs Social graphs Meaning • Part of speech (POS) tagging— about its competitors—even though Assigns a part of speech (such as a single verb “blogged” initiated the noun, verb, or adjective) to every two events. Event analysis can also word to form a foundation for define relationships between entities phrase- or sentence-level analysis. in a sentence or phrase; the phrase “Sally shot John” might establish Relationship and event analysis a relationship between John and Sally of murder, where John is also • Relationship analysis—Determines categorized as the murder victim. relationships within and across sentences. For example, “John’s • Co-reference resolution—Identifies wife Sally …” implies a symmetric words that refer to the same entity. relationship of spouse. For example, in these two sentences— “John bought a gun. He fired the • Event analysis—Determines the gun when he went to the shooting type of activity based on the verb range.”—the “He” in the second and entities that have been assigned sentence refers to “John” in the first to a classification. For example, sentence; therefore, the events in the an event “BlogPost” may have two second sentence are about John. types associated with it—a blog post about a company versus a blog post Reshaping the workforce with the new analytics 47
  • 48.
    Syntactic (phrase andsentence NLP applications require the use of construction) analysis several of these techniques together. Some of the most compelling NLP • Syntactic parsing—Generates a parse applications for social media analytics tree, or the structure of sentences and include enhanced extraction, filtered phrases within a document, which keyword search, social graph analysis, can lead to helpful distinctions at the and predictive and sentiment analysis. document level. Syntactic parsing often involves the concept of sentence Enhanced extraction segmentation, which builds on NLP tools are being used to mine both tokenization, or word segmentation, the text and the metadata in social in which words are discovered within media. For example, the inTTENSITY a string of characters. In English and Social Media Command Center (SMCC) other languages, words are separated integrates Attensity Analyze with by spaces, but this is not true in some Inxight ThingFinder—both established languages (for instance, Chinese). tools—to provide a parser for social media sources that include metadata • Language services—Range and text. The inTTENSITY solution from translation to parsing and uses Attensity Analyze for predicate extracting in native languages. analysis to provide relationship For global organizations, these and event analysis, and it uses services are a major differentiator ThingFinder for noun identification. because of the different techniques required for different languages. Filtered keyword search Many keyword search methods exist. Document analysis Most require lists of keywords to be defined and generated. Documents • Summarization and topic containing those words are matched. identification—Summarizes (in the WordStream is one of the prominent case of topic identification) in a few tools in keyword search for SMI. It words the topic of an entire document provides several ways for enterprises or subsection. Summarization, by to filter keyword searches. contrast, provides a longer summary of a document or subsection. Social graph analysis Social graphs assist in the study • Sentiment analysis—Recognizes of a subject of interest, such as a subjective information in a customer, employee, or brand. document that can be used to These graphs can be used to: identify “polarity” or distinguish between entirely opposite entities • Determine key influencers in and topics. This analysis is often each major node section used to determine trends in public opinion, but it also has other uses, • Discover if one aspect of the brand such as determining confidence needs more attention than others in facts extracted using NLP. • Identify threats and opportunities • Metadata analysis—Identifies and based on competitors and industry analyzes the document source, users, dates, and times created or modified. • Provide a model for collaborative brainstorming 48 PwC Technology Forecast 2012 Issue 1
  • 49.
    Many NLP-based socialgraph tools extract and classify entities and relationships in accordance with a What constitutes good NLP is defined ontology or graph. But some open to debate, but it’s clear social media graph analytics vendors, such as Nexalogy Environics, rely on that some of the more useful more flexible approaches outside methods blend different standard NLP. “NLP rests upon what we call static ontologies—for example, detailed levels of analysis and the English language represented in sophisticated filtering, while a network of tags on about 30,000 concepts could be considered a static others stay attuned to the full ontology,” Claude Théoret, president context of the conversations. of Nexalogy Environics, explains. “The problem is that the moment you hit something that’s not in the ontology, then there’s no way of figuring out what the tags are.” In contrast, Nexalogy Environics generates an ontology for each data set, which makes it possible to capture meaning missed by techniques that are looking just for previously defined terms. “That’s why our stuff is not change public attitudes about its quite real time,” he says, “because products. “We had data on what products the amount of number crunching people had from the competitors and you have to do is huge and there’s no what people had products from this human intervention whatsoever.” (For particular firm. And we also had some an example of Nexalogy’s approach, survey data about attitudes that people see the article, “The third wave of had toward the product. We were able customer analytics,” on page 06.) to say something about what type of people, according to demographic Predictive analysis and early warning characteristics, had different attitudes.” Predictive analysis can take many forms, and NLP can be involved, or it might not Paich’s agent-based modeling be. Predictive modeling and statistical effort matched attitudes with the analysis can be used effectively without manufacturer’s product types. “We the help of NLP to analyze a social calibrated the model on the basis of network and find and target influencers some fairly detailed geographic data in specific areas. Before he came to to get a sense as to whose purchases PwC, Mark Paich, a director in the influenced whose purchases,” Paich firm’s advisory service, did some agent- says. “We didn’t have direct data that based modeling3 for a Los Angeles– said, ‘I influence you.’ We made some based manufacturer that hoped to assumptions about what the network would look like, based on studies of who talks to whom. Birds of a feather 3 Agent-based modeling is a means of understanding flock together, so people in the same age the behavior of a system by simulating the behavior of individual actors, or agents, within that system. groups who have other things in common For more on agent-based modeling, see the article “Embracing unpredictability” and the interview with Mark Paich, “Using simulation tools for strategic decision making,” in Technology Forecast 2010, Issue 1, http://www.pwc.com/us/en/technology-forecast/ winter2010/index.jhtml, accessed February 14, 2012. Reshaping the workforce with the new analytics 49
  • 50.
    tend to talkto each other. We got a Many companies mine social media to decent approximation of what a network determine who the key influencers are might look like, and then we were for a particular product. But mining able to do some statistical analysis.” the context of the conversations via interest graph analysis is important. That statistical analysis helped with “As Clay Shirky pointed out in 2003, the influencer targeting. According influence is only influential within to Paich, “It said that if you want to a context,” Théoret says. sell more of this product, here are the key neighborhoods. We identified Nearly all SMI products provide the key neighborhood census tracts some form of timeline analysis of “Our models are built you want to target to best exploit social media traffic with historical the social network effect.” analysis and trending predictions. on seeds from analysts with years of experience Predictive modeling is helpful when Sentiment analysis the level of specificity needed is high Even when overall social media traffic in each industry. We (as in the Los Angeles manufacturer’s is within expected norms or predicted can put in the word example), and it’s essential when trends, the difference between positive, the cost of a wrong decision is high.4 neutral, and negative sentiment can ‘Escort’ or ‘Suburban,’ But in other cases, less formal social stand out. Sentiment analysis can and then behind that media intelligence collection and suggest whether a brand, customer analysis are often sufficient. When it support, or a service is better or put a car brand such comes to brand awareness, NLP can worse than normal. Correlating as ‘Ford’ or ‘Chevy.’ The help provide context surrounding sentiment to recent changes in a spike in social media traffic about product assembly, for example, models combined could a brand or a competitor’s brand. could provide essential feedback. be strings of 250 filters That spike could be a key data point Most customer sentiment analysis of various types.” to initiate further action or research today is conducted only with statistical to remediate a problem before it gets analysis. Government intelligence —Vince Schiavone, worse or to take advantage of a market agencies have led with more advanced ListenLogic opportunity before a competitor does. methods that include semantic analysis. (See the article, “The third wave of In the US intelligence community, customer analytics,” on page 06.) media intelligence generally provides Because social media is typically faster early indications of events important than other data sources in delivering to US interests, such as assessing early indications, it’s becoming a the impact of terrorist activities on preferred means of identifying trends. voting in countries the Unites States is aiding, or mining social media for early indications of a disease outbreak. 4 For more information on best practices for the use of In these examples, social media predictive analytics, see Putting predictive analytics to prove to be one of the fastest, most work, PwC white paper, January 2012, http:// www.pwc.com/us/en/increasing-it-effectiveness/ accurate sources for this analysis. publications/predictive-analytics-to-work.jhtml, accessed February 14, 2012. 50 PwC Technology Forecast 2012 Issue 1
  • 51.
    Table 1: Afew NLP best practices Strategy Description Benefits Mine the Many tools monitor individual accounts. Scalability and efficiency of the mining effort are essential. aggregated data. Clearly enterprises need more than individual account monitoring. Segment the Regional segmentation, for instance, Orkut is larger than Facebook in Brazil, for instance, and interest graph in is important because of differences in Qzone is larger in China. Global companies need global a meaningful way. social media adoption by country. social graph data. Conduct deep Deep parsing takes advantage of a Multiple extractors that use the best approaches in individual parsing. range of NLP extraction techniques areas—such as verb analysis, sentiment analysis, named rather than just one. entity recognition, language services, and so forth—provide better results than the all-in-one approach. Align internal models After mining the data for social graph With aligned customer models, enterprises can correlate to the social model. clues, the implicit model that results social media insights with logistics problems and shipment should be aligned to the models used delays, for example. Social media serves in this way as an for other data sources. early warning or feedback mechanism. Take advantage of Approaches outside the mainstream Tools that take a bottom-up approach and surface more alternatives to can augment mainstream tools. flexible ontologies, for example, can reveal insights mainstream NLP. other tools miss. NLP-related best practices • Direct concept filtering—Filtering After considering the breadth of NLP, based on the language of social media one key takeaway is to make effective use of a blend of methods. Too simple • Ontological—Models describing an approach can’t eliminate noise specific clients and their product lines sufficiently or help users get to answers that are available. Too complicated an • Action—Activity associated approach can filter out information with buyers of those products that companies really need to have. • Persona—Classes of social Some tools classify many different media users who are posting relevant contexts. ListenLogic, for example, combines lexical, semantic, • Topic—Discovery algorithms for and statistical analysis, as well as models new topics and topic focusing the company has developed to establish specific industry context. “Our models Other tools, including those from are built on seeds from analysts with Nexalogy Environics, take a bottom-up years of experience in each industry. approach, using a data set as it comes We can put in the word ‘Escort’ or and, with the help of several proprie- ‘Suburban,’ and then behind that put tary universally applicable algorithms, a car brand such as ‘Ford’ or ‘Chevy,’” processing it with an eye toward catego- says Vince Schiavone, co-founder and rization on the fly. Equally important, executive chairman of ListenLogic. Nexalogy’s analysts provide interpreta- “The models combined could be strings tions of the data that might not be evident of 250 filters of various types.” The to customers using the same tool. Both models fall into five categories: kinds of tools have strengths and weak- nesses. Table 1 summarizes some of the key best practices when collecting SMI. Reshaping the workforce with the new analytics 51
  • 52.
    Conclusion: A machine-assisted statistical analysis to new levels, making and iterative process, rather it possible to pair a commonly used than just processing alone phrase in one language with a phrase Good analysis requires consideration in another based on some observation of a number of different clues and of how frequently those phrases are quite a bit of back-and-forth. It’s not used. So statistically based processing a linear process. Some of that process is clearly useful. But it’s equally clear can be automated, and certainly it’s in from seeing so many opaque social a company’s interest to push the level of media analyses that it’s insufficient. automation. But it’s also essential not to put too much faith in a tool or assume Structuring textual data, as with that some kind of automated service numerical data, is important. Enterprises will lead to insights that are truly game cannot get to the web of data if the data changing. It’s much more likely that the is not in an analysis-friendly form—a tool provides a way into some far more database of sorts. But even when extensive investigation, which could something materializes resembling a lead to some helpful insights, which better described and structured web, then must be acted upon effectively. not everything in the text of a social media conversation will be clear. One of the most promising aspects of The hope is to glean useful clues and NLP adoption is the acknowledgment starting points from which individuals that structuring the data is necessary to can begin their own explorations. help machines interpret it. Developers have gone to great lengths to see how Perhaps one of the more telling much knowledge they can extract with trends in social media is the rise of the help of statistical analysis methods, online word-of-mouth marketing and it still has legs. Search engine and other similar approaches that companies, for example, have taken pure borrow from anthropology. So-called social ethnographers are monitoring how online business users behave, and these ethnographers are using NLP-based tools to land them in a The tool provides a way into neighborhood of interest and help them some far more extensive zoom in once there. The challenge is how to create a new social science of investigation, which could online media, one in which the tools lead to some helpful insights, are integrated with the science. which then must be acted upon effectively. “As Clay Shirky pointed out in 2003, influence is only influential within a context.” —Claude Théoret, Nexalogy Environics 52 PwC Technology Forecast 2012 Issue 1
  • 53.
    An in-memory appliance to explore graph data YarcData’s uRiKA analytics appliance,1 announced at O’Reilly’s Strata data science conference in March 2012, is designed to analyze the relationships between nodes in large graph data sets. To accomplish this feat, the system can take advantage of as much as 512TB of DRAM and 8,192 processors with over a million active threads. In-memory appliances like these allow very large data sets to be stored and But mining graph data, as YarcData analyzed in active or main memory, (a unit of Cray) explains, demands avoiding memory swapping to disk a system that can process graphs that introduces lots of latency. It’s without relying on caching, because possible to load full business intelligence mining graphs requires exploring (BI) suites, for example, into RAM to many alternative paths individually speed up the response time as much with the help of millions of threads— as 100 times. (See “What in-memory a very memory- and processor- technology does” on page 33 for more intensive task. Putting the full graph information on in-memory appliances.) in a single random access memory With compression, it’s apparent that space makes it possible to query it and analysts can query true big data (data retrieve results in a timely fashion. sets of greater than 1PB) directly in main memory with appliances of this size. The first customers for uRiKA are government agencies and medical Besides the sheer size of the system, research institutes like the Mayo Clinic, uRiKA differs from other appliances but it’s evident that social media because it’s designed to analyze graph analytics developers and users would data (edges and nodes) that take the also benefit from this kind of appliance. form of subject-verb-object triples. Mining the social graph and the larger This kind of graph data can describe interest graph (the relationships relationships between people, places, between people, places, and things) and things scalably. Flexible and richly is just beginning.3 Claude Théoret described data relationships constitute of Nexalogy Environics has pointed an additional data dimension users can out that crunching the relationships mine, so it’s now possible, for example, between nodes at web scale hasn’t to query for patterns evident in the previously been possible. Analyzing graphs that aren’t evident otherwise, the nodes themselves only goes so far. whether unknown or purposely hidden.2 1 The YarcData uRiKA Graph Appliance: Big Data 3 See “The collaboration paradox,” Technology Forecast Relationship Analytics, Cray white paper, http://www. 2011, Issue 3, http://www.pwc.com/us/en/technology- yarcdata.com/productbrief.html, March 2012, accessed forecast/2011/issue3/features/feature-social- April 3, 2012. information-paradox.jhtml#, for more information on the interest graph. 2 Michael Feldman, “Cray Parlays Supercomputing Technology Into Big Data Appliance,” Datanami, March 2, 2012, http://www.datanami.com/ datanami/2012-03-02/cray_parlays_supercomputing_ technology_into_big_data_appliance.html, accessed April 3, 2012. Reshaping the workforce with the new analytics 53
  • 54.
    PwC: When didyou come The payoff from to Tableau Software? JM: I came to Tableau in 2004 out of the research world. I spent a long time interactive at Xerox Palo Alto Research Center working with some excellent people— Stuart Card and George Robertson, who visualization are both recently retired. We worked in the area of data visualization for a long time. Before that, I was at Stanford Jock Mackinlay of Tableau Software University and did a PhD in the same discusses how more of the workforce area—data visualization. I received a Technical Achievement Award for has begun to use analytics tools. that entire body of work from the IEEE organization in 2009. I’m one Interview conducted by Alan Morrison of the lucky few people who had the opportunity to take his research out into the world into a successful company. Jock Mackinlay PwC: Our readers might Jock Mackinlay is the director of visual appreciate some context on analysis at Tableau Software. the whole area of interactive visualization. Is the innovation in this case task automation? JM: There’s a significant limit to how we can automate. It’s extremely difficult to understand what a person’s task is and what’s going on in their head. When I finished my dissertation, I chose a mixture of automated techniques plus giving humans a lot of power over thinking with data. And that’s the Tableau philosophy too. We want to provide people with good defaulting as best we can but also make it easy for people to make adjustments as their tasks change. When users are in the middle of looking at some data, they might change their minds about what questions they’re asking. They need to head toward that new question on the fly. No automated system is going to keep up with the stream of human thought. 54 PwC Technology Forecast 2012 Issue 1
  • 55.
    “No amount ofpre-computation or work by an IT department is going to be able to anticipate all the possible ways people might want to work with data. So you need to have a flexible, human-centered approach.” PwC: Humans often don’t know you see the fields on the side. You can PwC: Are there categories of themselves what question they’re drag out the fields and drop them more structured data that would ultimately interested in. on row, column, color, size, and so lend themselves to this sort of JM: Yes, it’s an iterative exploration forth. And then the tool generates approach? Most of this data process. You cannot know up front the graphical views, so users can presumably has been processed what question a person may want to ask see the data visualization. They’re to the point where it could be today. No amount of pre-computation probably familiar with their data. fed into Tableau relatively or work by an IT department is Most people are if they’re working easily and then worked with going to be able to anticipate all the with data that they care about. once it’s in the visual form. possible ways people might want to JM: At a high level, that’s accurate. work with data. So you need to have The graphical view by default codifies One of the other key innovations of the a flexible, human-centered approach the best practices for putting data in the dissertation out of Stanford by Chris to give people a maximal ability to view. For example, if the user dragged Stolte and Pat Hanrahan was that they take advantage of data in their jobs. out a profit and date measure, because built a system that could compile those it’s a date field, we would automatically algebraic expressions into queries on PwC: What did your research generate a line mark and give that user databases. So Tableau is good with any uncover that helps? a trend line view because that’s best information that you would find in a JM: Part of the innovation of the practice for profit varying over time. database, both SQL databases and MDX dissertation at Stanford was that the databases. Or, in other words, both algebra enables a simple drag-and- If instead they dragged out product and relational databases and cube databases. drop interface that anyone can use. profit, we would give them a bar graph They drag fields and place them in view because that’s an appropriate But there is other data that doesn’t rows and columns or whatnot. Their way to show that information. If they necessarily fall into that form. It is just actions actually specify an algebraic selected a geographic field, they’ll data that’s sitting around in text files or expression that gets compiled into get a map view because that’s an in spreadsheets and hasn’t quite got into a query database. But they don’t appropriate way to show geography. a database. Tableau can access that data need to know all that. They just need pretty well if it has a basic table structure to know that they suddenly get to We work hard to make it a rapid to it. A couple of releases ago, we see their data in a visual form. exploration process, because not only introduced what we call data blending. are tables and numbers difficult for PwC: One of the issues we run humans to process, but also because A lot of people have lots of data in into is that user interfaces are a slow user experience will interrupt lots of databases or tables. They often rather cryptic. Users must cognition and users can’t answer the might be text files. They might be be well versed in the tool from the questions. Instead, they’re spending Microsoft Access files. They might designer’s perspective. What have the time trying to make the tool work. be in SQL or Hyperion Essbase. But you done to make it less cryptic, whatever it is, their questions often to make what’s happening more The whole idea is to make the tool span across those tables of data. explicit, so that users don’t an extension of your hand. You don’t present results that they think think about the hammer. You just think are answering their questions about the job of building a house. in some way but they’re not? JM: The user experience in Tableau is that you connect to your data and Reshaping the workforce with the new analytics 55
  • 56.
    Normally, the wayto address that is to other, which we call grouping. At a data about the lenders, their location, create a federated database that joins fundamental level, it’s a way you can the amount, and the borrower right the tables together, which is a six-month build up a hierarchical structure out of a down to their photographs. And we or greater IT effort. It’s difficult to query flat dimension easily by grouping fields built a graphical view in Tableau. We across multiple data tables from multiple together. We also have some lightweight sliced and diced it first and then built databases. Data blending is a way—in support for supporting those hierarchies. some graphical views for the demo. a lightweight drag-and-drop way—to bring in data from multiple sources. We’ve also connected Tableau to The key problem about it from a human Hadoop. Do you know about it? performance point of view is that there’s Imagine you have a spreadsheet that high latency. It takes a long time for you’re using to keep track of some PwC: We wrote about Hadoop the programs to run and process the information about your products, in 2010. We did a full issue data. We’re interested in helping people and you have your company-wide on it as a matter of fact.1 answer their questions at the speed of data mart that has a lot of additional JM: We’re using a connector to their thought. And so latency is a killer. information about those products. Hadoop that Cloudera built that And you want to combine them. You allows us to write SQL and then access We used the connection to process the can direct connect Tableau to the data data via the Hadoop architecture. XML file and build a Tableau extract mart and build a graphical view. file. That file runs on top of our data In particular, whenever we do demos engine, which is a high-performance Then you can connect to your on stage, we like to look for real data columnar database system. Once we had spreadsheet, and maybe you build sets. We found one from Kiva, the the data in the Tableau extract format, a view about products. Or maybe online micro-lending organization. it was drag and drop at human speed. you have your budget in your Kiva published the huge XML file spreadsheet and you would like describing all of the organization’s We’re heading down this vector, but compare the actuals to the budget lenders and all of the recipients this is where we are right now in terms you’re keeping in your spreadsheet. of the loans. This is an XML file, of being able to process less-structured It’s a simple drag-and-drop operation so it’s not your normal structured information into a form that you could or a simple calculation to do that. data set. It’s also big, with multiple then use Tableau on effectively. years and lots of details for each. So, you asked me this big question PwC: Interesting stuff. What about structured to unstructured data. We processed that XML file in Hadoop about in-memory databases and used our connector, which has and how large they’re getting? PwC: That’s right. string functions. We used those string JM: Anytime there’s a technology that JM: We have functionality that allows functions to reach inside the XML and can process data at fast rates, whether you to generate additional structure pull out what would be all the structured it’s in-memory technology, columnar for data that you might have brought databases, or what have you, we’re in. One of the features gives you the excited. From its inception, Tableau 1 See “Making sense of Big Data,” Technology Forecast ability—in a lightweight way—to 2010, Issue 3, http://www.pwc.com/us/en/technology- combine fields that are related to each forecast/2010/issue3/index.jhtml, for more information. 56 PwC Technology Forecast 2012 Issue 1
  • 57.
    involved direct connectingto databases easier to use. I love that I have authentic and making it easy for anybody to be users all over the company and I can able to work with it. We’re not just ask them, “Would this feature help?” about self-analytics; we’re also about data storytelling. That can have as So yes, I think the focus on the workforce much impact on the executive team is essential. The trend here is that data as directly being able themselves is being collected by our computers to answer their own questions. almost unmanned, no supervision necessary. It’s the process of utilizing PwC: Is more of the workforce that data that is the game changer. And doing the analysis now? the only way you’re going to do that JM: I just spent a week at the is to put the data in the hands of the Tableau Customer Conference, individuals inside your organization. and the people that I meet are extremely diverse. They’re not just the hardcore analysts who know about SPSS and R. They come from all different sizes of companies “A lot of people have lots of data in and nonprofits and on and on. lots of databases or tables. They And the people at the customer might be text files. They might be conferences are pretty passionate. I think part of the passion is the Microsoft Access files. They might realization that you can actually work be in SQL or Hyperion Essbase. But with data. It doesn’t have to be this horribly arduous process. You can whatever it is, their questions often rapidly have a conversation with your span across those tables of data.” data and answer your questions. Inside Tableau, we use Tableau everywhere—from the receptionist who’s tracking utilization of all the conference rooms to the sales team that’s monitoring their pipeline. My major job at Tableau is on the team that does forward product direction. Part of that work is to make the product Reshaping the workforce with the new analytics 57
  • 58.
    Palm tree nursery.Palm oil is being tested to be used in aviation fuel 58 PwC Technology Forecast 2012 Issue 1
  • 59.
    How CIOs canbuild the foundation for a data science culture Helping to establish a new culture of inquiry can be a way for these executives to reclaim a leadership role in information. By Bud Mathaisel and Galen Gruman The new analytics requires that CIOs Whatever the reasons, CIOs must rise and IT organizations find new ways to above them and find ways to provide engage with their business partners. important capabilities for new analytics For all the strategic opportunities new while enjoying the thrill of analytics analytics offers the enterprise, it also discovery, if only vicariously. The IT threatens the relevance of the CIO. The organization can become the go-to threat comes from the fact that the CIO’s group, and the CIO can become the business partners are being sold data true information leader. Although it is analytics services and software outside a challenge, the new analytics is also normal IT procurement channels, an opportunity because it is something which cuts out of the process the very within the CIO’s scope of responsibility experts who can add real value. more than nearly any other development in information technology. Perhaps the vendors’ user-centric view is based on the premise that only users The new analytics needs to be treated in functional areas can understand as a long-term collaboration between which data and conclusions from its IT and business partners—similar to analysis are meaningful. Perhaps the the relationship PwC has advocated1 CIO and IT have not demonstrated for the general consumerization-of-IT the value they can offer, or they have phenomenon invoked by mobility, dwelled too much on controlling social media, and cloud services. This security or costs to the detriment of tight collaboration can be a win for showing the value IT can add. Or the business and for the CIO. The perhaps only the user groups have the new analytics is a chance for the CIO funding to explore new analytics. to shine, reclaim the “I” leadership in CIO, and provide a solid footing for a new culture of inquiry. 1 The consumerization of IT: The next-generation CIO, PwC white paper, November 2011, http:// www.pwc.com/us/en/technology-innovation-center/ consumerization-information-technology-transforming- cio-role.jhtml, accessed February 1, 2012. Reshaping the workforce with the new analytics 59
  • 60.
    The many waysfor CIOs to E. & J. Gallo Winery takes this be new analytics leaders approach. Its senior management In businesses that provide information understood the need for detailed products or services—such as customer analytics. “IT has partnered healthcare, finance, and some utilities— successfully with Gallo’s marketing, there is a clear added value from having sales, R&D, and distribution to the CIO directly contribute to the use leverage the capabilities of information of new analytics. Consider Edwards from multiple sources. IT is not the Lifesciences, where hemodynamic focus of the analytics; the business (blood circulation) modeling has is,” says Kent Kushar, Gallo’s CIO. benefited from the convergence of “After working together with the new data with new tools to which business partners for years, Gallo’s the CIO contributes. New digitally IT recently reinvested heavily in enabled medical devices, which are updated infrastructure and began capable of generating a continuous to coalesce unstructured data with flow of data, provide the opportunity the traditional structured consumer to measure, analyze, establish pattern data.” (See “How the E. & J. Gallo boundaries, and suggest diagnoses. Winery matches outbound shipments to retail customers” on page 11.) “In addition, a personal opportunity arises because I get to present our Regardless of the CIO’s relationship newest product, the EV1000, directly to with the business, many technical our customers alongside our business investments IT makes are the “IT has partnered team,” says Ashwin Rangan, CIO of foundation for new analytics. A CIO successfully with Gallo’s Edwards Lifesciences. Rangan leverages can often leverage this traditional his understanding of the underlying role to lead new analytics from marketing, sales, R&D, technologies, and, as CIO, he helps behind the scenes. But doing even and distribution to provision the necessary information that—rather than leading from the infrastructure. As CIO, he also has front as an advocate for business- leverage the capabilities credibility with customers when he valuable analytics—demands new of information from talks to them about the information skills, new data architectures, capabilities of Edwards’ products. and new tools from IT. multiple sources. IT is not the focus of the For CIOs whose businesses are not in At Ingram Micro, a technology information products or services, there’s distributor, CIO Mario Leone views analytics; the business is.” still a reason to engage in the new a well-integrated IT architecture as analytics beyond the traditional areas a critical service to business partners —Kent Kushar, of enablement and of governance, risk, to support the company’s diverse and E. & J. Gallo Winery and compliance (GRC). That reason dynamic sales model and what Ingram is to establish long-term relationships Micro calls the “frontier” analysis with the business partners. In this of distribution logistics. “IT designs partnership, the business users decide the modular and scalable backplane which analytics are meaningful, architecture to deliver real-time and and the IT professionals consult relevant analytics,” he says. On one with them on the methods involved, side of the backplane are multiple including provisioning the data and data sources, primarily delivered tools. These CIOs may be less visible through partner interactions; on the outside the enterprise, but they flip side of the backplane are analytics have a crucial role to play internally tools and capabilities, including such to jointly explore opportunities for analytics that yield useful results. 60 PwC Technology Forecast 2012 Issue 1
  • 61.
    Figure 1: ACIO’s situationally specific roles CIO #1 Focuses on inputs when production innovation, for example, is at a premium. I O Marketing N U P T Sales Multiple P data U Backplane T U sources S T Distribution S Research and development CIO #2 Focuses on outputs when sales or marketing, for example, is the major concern. new features as pattern recognition, Enable the data scientist optimization, and visualization. Taken One course of action is to strategically together, the flow of multiple data plan and provision the data and streams from different points and infrastructure for the new sources advanced tools for business users of data and new tools (discussed can permit more sophisticated and in the next section). However, the iterative analyses that give greater bigger challenge is to invoke the insight to product mix offerings, productive capability of the users. This changing customer buying patterns, challenge poses several questions: and electronic channel delivery preferences. The backplane is a • How can CIOs do this without convergence point of those data into a knowing in advance which users coherent repository. (See Figure 1.) will harvest the capabilities? Given these multiple ways for CIOs • Analytics capabilities have been to engage in the new analytics— pursued for a long time, but several and the self-interest for doing so— hurdles have hindered the attainment the next issue is how to do it. After of the goal (such as difficult-to-use interviewing leading CIOs and tools, limited data, and too much other industry experts, PwC offers dependence on IT professionals). the following recommendations. CIOs must ask: which of these impediments are eased by the new capabilities and which remain? Reshaping the workforce with the new analytics 61
  • 62.
    • As analyticsmoves more broadly Gallo has tasked statisticians in IT, R&D, through the organization, there may sales, and supply chain to determine be too few people trained to analyze what information to analyze, the and present data-driven conclusions. questions to ask, the hypotheses to test, Who will be fastest up the learning and where to go after that, Kushar says. curve of what to analyze, of how to obtain and process data, and of The CIO has the opportunity to help how to discover useful insights? identify the skills needed and then help train and support data scientists, What the enterprise needs is the data who may not reside in IT. CIOs should scientist—actually, several of them. work with the leaders of each business A data scientist follows a scientific function to answer the questions: method of iterative and recursive Where would information insights pay analysis, with a practical result in the highest dividends? Who are the mind. Examples are easy to identify: likely candidates in their functions to an outcome that improves revenue, be given access to these capabilities, profitability, operations or supply chain as well as the training and support? efficiency, R&D, financing, business strategy, the use of human capital, Many can gain or sharpen analytic skills. and so forth. There is no sure way of The CIO is in the best position to ensure knowing in advance where or when that the skills are developed and honed. this insight will arrive, so it cannot be tackled in assembly line fashion The CIO must first provision the Josée Latendresse of with predetermined outcomes. tools and data, but the data analytics Latendresse Groupe requires the CIO and IT team to The analytic approach involves trial and assume more responsibility for the Conseil says one of her error and accepts that there will be dead effectiveness of the resources than in clients, an apparel ends, although a data scientist can even the past. Kushar says Gallo has a team draw a useful conclusion—“this doesn’t within IT dedicated to managing and manufacturer based in work”—from a dead end. Even without proliferating business intelligence Quebec, has been hiring formal training, some business users tools, training, and processes. have the suitable skills, experience, PhDs to serve in the data and mind-set. Others need to be When major systems were deployed science function. trained and encouraged to think like a in the past, CIOs did their best to train scientist but behave like a—choose the users and support them, but CIOs function—financial analyst, marketer, only indirectly took responsibility sales analyst, operations quality for the users’ effectiveness. In data analyst, or whatever. When it comes analytics, the responsibility is more to repurposing parts of the workforce, directly correlated: the investments it’s important to anticipate obstacles or are not worth making unless IT steps frequent objections and consider ways up to enhance the users’ performance. to overcome them. (See Table 1.) Training should be comprehensive and go beyond teaching the tools to Josée Latendresse of Latendresse helping users establish an hypothesis, Groupe Conseil says one of her clients, iteratively discover and look for insights an apparel manufacturer based in from results that don’t match the Quebec, has been hiring PhDs to serve hypothesis, understand the limitations in this function. “They were able to of the data, and share the results with know the factors and get very, very fine others (crowdsourcing, for example) analysis of the information,” she says. who may see things the user does not. 62 PwC Technology Forecast 2012 Issue 1
  • 63.
    Table 1: Barriersto adoption of analytics and ways to address them Barrier Solution Too difficult to use Ensure the tool and data are user friendly; use published application programming interfaces (APIs) against data warehouses; seed user groups with analytics-trained staff; offer frequent training broadly; establish an analytics help desk. Refusal to accept facts and resulting Require a 360-degree perspective and pay attention to dissenters; establish a culture analysis, thereby discounting analytics of fact finding, inquiry, and learning. Lack of analytics incentives and Make contributions to insights from analytics an explicit part of performance reviews; performance review criteria recognize and reward those who creatively use analytics. Training should encompass multiple insights that would translate to tools, since part of what enables improved marketing, increased sales, discovery is the proper pairing of tool, improved customer relationships, and person, and problem; these pairings more effective business operations. vary from problem to problem and person to person. You want a toolset to Because most enterprises have been handle a range of analytics, not a single frustrated by the lack of clear payoffs tool that works only in limited domains from large investments in data analysis, and for specific modes of thinking. they may be tempted to treat the new analytics as not really new. This The CIO could also establish and would be a mistake. As with most reinforce a culture of information developments in IT, there is something inquiry by getting involved in data old, something new, something analysis trials. This involvement lends borrowed, and possibly something blue direct and moral support to some in the new analytics. Not everything is of the most important people in the new, but that doesn’t justify treating organization. For CIOs, the bottom line the new analytics as more of the is to care for the infrastructure but focus same. In fact, doing so indicates that more on the actual use of information your adoption of the new analytics is services. Advanced analytics is adding merely applying new tools and perhaps insight and power to those services. personnel to your existing activities. It’s not the tool per se that solves Renew the IT infrastructure problems or finds insights—it’s the for the new analytics people who are able to explore openly As with all IT investments, CIOs and freely and to think outside the box, are accountable for the payback aided by various tools. So don’t just from analytics. For decades, much re-create or refurbish the existing box. time and money has been spent on data architectures; identification of Even if the CIO is skeptical and believes “interesting” data; collecting, filtering, analytics is in a major hype cycle, storing, archiving, securing, processing, there is still reason to engage. At the and reporting data; training users; very least, the new analytics extends and the associated software and IT’s prior initiatives; for example, hardware in pursuit of the unique the new analytics makes possible Reshaping the workforce with the new analytics 63
  • 64.
    the kind ofanalytics your company Develop the new analytics has needed for decades to enhance strategic plan business decisions, such as complex, As always, the CIO should start with real-time events management, or it a strategic plan. Gallo’s Kushar refers makes possible new, disruptive business to the data analytics specific plan as opportunities, such as the on-location a strategic plan for the “enterprise promotion of sales to mobile shoppers. information fabric,” a reference to all the crossover threads that form an Given limited resources, a portfolio identifiable pattern. An important approach is warranted. The portfolio component of this fabric is the should encompass many groups in the identification of the uses and users that enterprise and the many functions they have the highest potential for payback. perform. It also should encompass the Places to look for such payback include convergence of multiple data sources areas where the company has struggled, and multiple tools. If you follow where traditional or nontraditional Ingram Micro’s backplane approach, competition is making inroads, and you get the data convergence side of where the data has not been available the backplane from the combination or granular enough until now. of traditional information sources with new data sources. Traditional The strategic plan must include the information sources include structured data scientist talent required and the transaction data from enterprise technologies in which investments resource planning (ERP) and customer need to be made, such as hardware and relationship management (CRM) software, user tools, structured and systems; new data sources include unstructured data sources, reporting textual information from social media, and visualization capabilities, and clickstream transactions, web logs, higher-capacity networks for moving radio frequency identification (RFID) larger volumes of data. The strategic sensors, and other forms of unstructured planning process brings several benefits: and/or disparate information. it updates IT’s knowledge of emerging capabilities as well as traditional The analytics tools side of the backplane and new vendors, and it indirectly arises from the broad availability of informs prospective vendors that the new tools and infrastructure, such as CIO and IT are not to be bypassed. mobile devices; improved in-memory Once the vendor channels are known systems; better user interfaces to be open, the vendors will come. for search; significantly improved visualization technologies; improved Criteria for selecting tools may vary pattern recognition, optimization, and by organization, but the fundamentals analytics software; and the use of the are the same. Tools must efficiently cloud for storing and processing. (See handle larger volumes within acceptable the article, “The art and science of new response times, be friendly to users and IT analytics technology,” on page 30.) support teams, be sound technically, meet security standards, and be affordable. Understanding what remains the same and what is new is a key to The new appliances and tools could profiting from the new analytics. each cost several millions of dollars, and Even for what remains the same, millions more to support. The good news additional investments are required. is some of the tools and infrastructure can be rented through the cloud, and then tested until the concepts and 64 PwC Technology Forecast 2012 Issue 1
  • 65.
    You want atoolset to handle a range of analytics, not a single tool that works only in limited domains and for specific modes of thinking. super-users have demonstrated their business partners are changing potential. (See the interview with Mike or extending the following: Driscoll on page 20.) “All of this doesn’t have to be done in-house with expensive • Data sources to include the traditional computing platforms,” says Edwards’ enterprise structured information Rangan. “You can throw it in the cloud in core systems such as ERP, CRM, … without investing in tremendous manufacturing execution systems, capital-intensive equipment.” and supply chain, plus newer sources such as syndicated data (point of sale, With an approved strategy, CIOs Nielsen, and so on) and unstructured can begin to update the IT internal data from social media and other capabilities. At a minimum, IT must sources—all without compromising first provision the new data, tools, and the integrity of the production infrastructure, and then ensure the IT systems or their data and while team is up to speed on the new tools managing data archives efficiently. and capabilities. Gallo’s IT organization, for example, recently reinvested • Appliances to include faster heavily in new appliances; system processing and better in-memory architecture; extract, transform, and caching. In-memory caching load (ETL) tools; and ways in which improves cycle time significantly, SQL calls were written, and then began enabling information insights to to coalesce unstructured data with the follow human thought patterns traditional structured consumer data. closer to their native speeds. Provision data, tools, • Software to include newer and infrastructure data management, analysis, The talent, toolset, and infrastructure reporting, and visualization are prerequisites for data analytics. tools—likely multiple tools, each In the new analytics, CIOs and their tuned to a specific capability. Reshaping the workforce with the new analytics 65
  • 66.
    • Data architecturesand flexible to meet the increased demands for metadata to accommodate multiple technical support. IT will need new streams of multiple types of data skills and capabilities that include: stored in multiple databases. In this environment, a single database • Broader access to all relevant architecture is unworkable. types of data, including data from transaction systems and new sources • A cloud computing strategy that factors in the requirements of newly • Broader use of nontraditional expanded analytics capability and how resources, such as big data best to tap external as well as internal analytics services resources. Service-level expectations should be established for customers • Possible creation of specialized to ensure that these expanded databases and data warehouses sources of relevant data are always online and available in real time. • Competence in new tools and techniques, such as database The adoption of new analytics is appliances, column and row an opportunity for IT to augment databases, compression techniques, or update the business’s current and NoSQL frameworks capabilities. According to Kushar, Gallo IT’s latest investments are • Support in the use of tools for extensions of what Gallo wanted to reporting and visualization do 25 years ago but could not due to limited availability of data and tools. • Updated approaches for mobile access to data and analytic results Of course, each change requires a new response from IT, and each raises the • New rules and approaches perpetual dilemma of how to be selective to data security with investments (to conserve funds) while being as broad and heterogeneous • Expanded help desk services as possible so a larger population can create analytic insights, which Without a parallel investment in could come from almost anywhere. IT skills, investments in tools and infrastructure could lie fallow, causing Update IT capabilities: frustrated users to seek outside help. Leverage the cloud’s capacity For example, without advanced With a strategic plan in place and the compression and processing techniques, tools provisioned, the next prerequisite performance becomes a significant is to ensure that the IT organization is problem as databases grow larger and ready to perform its new or extended more varied. That’s an IT challenge job. One part of this preparation that users would not anticipate, but is the research on tools the team it could result in a poor experience needs to undertake with vendors, that leads them to third parties that consultancies, and researchers. have solved the issue (even if the users never knew what the issue was). The CIO should consider some organizational investments to add to the core human resources in IT, because once the business users get traction, IT must be prepared 66 PwC Technology Forecast 2012 Issue 1
  • 67.
    Most of theIT staff will welcome Enabling the productive use of the opportunities to learn new tools information tools is not a new obligation and help support new capabilities, for the CIO, but the new analytics even if the first reaction might be extends that obligation—in some to fret over any extra work. CIOs cases, hyperextends it. Fulfilling that must lead this evolution by being obligation requires the CIO to partner a source for innovation and trends with human resources, sales, and in analytics, encouraging adoption, other functional groups to establish having the courage to make the the analytics credentials for knowledge investments, demonstrating trust in workers and to take responsibility IT teams and users, and ensuring that for their success. The CIO becomes execution matches the strategy. a teacher and role model for the increasing number of data engineers, Conclusion both the formal and informal ones. Data analytics is no longer an obscure science for specialists in the ivory tower. Certainly, IT must do its part to plan Increasingly more analytics power is and provision the raw enabling available for more people. Thanks to capabilities and handle GRC, but these new analytics, business users have more than ever, data analytics is the been unchained from prior restrictions, opportunity for the CIO to move out and finding answers is easier, faster, of the data center and into the front and less costly. Developing insightful, office. It is the chance for the CIO to actionable analytics is a necessary skill demonstrate information leadership. for every knowledge worker, researcher, consumer, teacher, and student. It is driven by a world in which faster insight is treasured, and it often needs to be real time to be most effective. Real-time data that changes quickly invokes a quest Developing insightful, actionable for real-time analytic insights and is not tolerant of insights from last quarter, last analytics is a necessary skill for month, last week, or even yesterday. every knowledge worker, researcher, consumer, teacher, and student. The adoption of new analytics is an opportunity for IT to augment or update the business’s current capabilities. According to CIO Kent Kushar, Gallo IT’s latest investments are extensions of what Gallo wanted to do 25 years ago but could not due to limited availability of data and tools. Reshaping the workforce with the new analytics 67
  • 68.
    PwC: What areEdwards How visualization Lifesciences’ main business intelligence concerns given its role as a medical device company? and clinical decision AR: There’s the traditional application of BI [business intelligence], and then there’s the instrumentation support can improve part of our business that serves many different clinicians in the OR and ICU. We make a hemodynamic [blood patient care circulation and cardiac function] monitoring platform that is able to communicate valuable information Ashwin Rangan details what’s different about and hemodynamic parameters hemodynamic monitoring methods these days. to the clinician using a variety of visualization tools and a rich graphical user interface. The clinician can use Interview conducted by Bud Mathaisel and Alan Morrison this information to make treatment decisions for his or her patients. PwC: You’ve said that the form in which the device provides Ashwin Rangan information adds value for the clinician or guides the clinician. Ashwin Rangan is the CIO of Edwards What does the monitoring Lifesciences, a medical device company. equipment do in this case? AR: The EV1000 Clinical Platform provides information in a more meaningful way, intended to better inform the treating clinician and lead to earlier and better diagnosis and care. In the critical care setting, the earlier the clinician can identify an issue, the more choices the clinician has when treating the patient. The instrument’s intuitive screens and physiologic displays are also ideal for teaching, presenting the various hemodynamic parameters in the context of each other. Ultimately, the screens are intended to offer a more comprehensive view of the patient’s status in a very intuitive, user-friendly format. 68 PwC Technology Forecast 2012 Issue 1
  • 69.
    PwC: How doesthis approach PwC: Why is visualization Figure 1: Edwards Lifesciences compare with the way the important to this process? EV1000 wireless monitor monitoring was done before? AR: Before, we tended to want to tell Patton Design helped develop AR: Traditional monitoring historically doctors and nurses to think like engineers this monitor, which displays a range of presented physiologic information, in when we constructed these monitors. blood-circulation parameters this case hemodynamic parameters, in Now, we’ve taken inspiration from the very simply. the form of a number and in some cases glass display in Minority Report [a 2002 a trend line. When a parameter would science-fiction movie] and influenced fall out of the defined target zones, the design of the EV1000 clinical the clinician would be alerted with an platform screens. The EV1000 clinical alarm and would be left to determine platform is unlike any other monitoring the best course of action based upon tool because you have the ability to the displayed number or a line. customize display screens to present parameters, color codes, time frames Comparatively, the EV1000 clinical and more according to specific patient platform has the ability to show needs and/or clinician preferences, truly physiologic animations and physiologic offering the clinician what they need, decision trees to better inform when they need it and how they need it. and guide the treating clinician, whether it is a physician or nurse. We are no longer asking clinicians to Source: Patton Design, 2012 translate the next step in their heads. The PwC: How did the physician goal now is to have the engineer reflect view the information before? the data and articulate it in a contextual AR: It has been traditional in movies, and intuitive language for the clinician. for example, to see a patient surrounded The clinician is already under pressure, depending on the kind of statistics that by devices that displayed parameters, caring for critically ill patients; our goal people are looking to understand. all of which looked like numbers is to alleviate unnecessary pressure and jagged lines on a timescale. In and provide not just information but I think we need to look at this our view and where we’re currently also guidance, enabling the clinician more broadly and not just print at with the development of our to more immediately navigate to bar graphs or pie graphs. What is technology, this is considered more the best therapy decisions. the visualization that can really be basic hemodynamic monitoring. contextually applicable with different PwC: Looking toward the applications? How do you make it In our experience, the “new-school” next couple of years and some easier? And more quickly understood? hemodynamic monitoring is a device of the emerging technical that presents the dynamics of the capability, what do you circulatory system, the dampness of think is most promising? the lungs and the cardiac output real- AR: Visualization technologies. The time in an intuitive display. The only human ability to discern patterns is not lag time between what’s happening in changing. That gap can only be bridged the patient and what’s being reflected by rendering technologies that are visual on the monitor is the time between the in nature. And the visualization varies analog body and the digital rendering. Reshaping the workforce with the new analytics 69
  • 70.
    To have adeeper conversation about this subject, please contact: Tom DeGarmo Bill Abbott US Technology Consulting Leader Principal, Applied Analytics +1 (267) 330 2658 +1 (312) 298 6889 thomas.p.degarmo@us.pwc.com william.abbott@us.pwc.com Bo Parker Oliver Halter Managing Director Principal, Applied Analytics Center for Technology & Innovation +1 (312) 298 6886 +1 (408) 817 5733 oliver.halter@us.pwc.com bo.parker@us.pwc.com Robert Scott Global Consulting Technology Leader +1 (416) 815 5221 robert.w.scott@ca.pwc.com Comments or requests? Please visit www.pwc.com/techforecast or send e-mail to techforecasteditors@us.pwc.com
  • 71.
    This publication isprinted on McCoy Silk. It is a Forest Stewardship Council™ (FSC®) certified stock containing 10% postconsumer waste (PCW) fiber and manufactured with 100% certified renewable energy. By using postconsumer recycled fiber in lieu of virgin fiber: 6 trees were preserved for the future 16 lbs of waterborne waste were not created 2,426 gallons of wastewater flow were saved 268 lbs of solid waste were not generated 529 lbs net of greenhouse gases were prevented 4,046,000 BTUs of energy were not consumed Photography Catherine Hall: Cover, pages 06, 20 Gettyimages: pages 30, 44, 58 PwC (www.pwc.com) provides industry-focused assurance, tax and advisory services to build public trust and enhance value for its clients and their stakeholders. More than 155,000 people in 153 countries across our network share their thinking, experience and solutions to develop fresh perspectives and practical advice. © 2012 PricewaterhouseCoopers LLP, a Delaware limited liability partnership. All rights reserved. PwC refers to the US member firm, and may sometimes refer to the PwC network. Each member firm is a separate legal entity. Please see www.pwc.com/structure for further details. This content is for general information purposes only, and should not be used as a substitute for consultation with professional advisors. NY-12-0340
  • 72.
    www.pwc.com/techforecast Subtext Culture of inquiry A business environment focused on asking better questions, getting better answers to those questions, and using the results to inform continual improvement. A culture of inquiry infuses the skills and capabilities of data scientists into business units and compels a collaborative effort to find answers to critical business questions. It also engages the workforce at large— whether or not the workforce is formally versed in data analysis methods—in enterprise discovery efforts. In-memory A method of running entire databases in random access memory (RAM) without direct reliance on disk storage. In this scheme, large amounts of dynamic random access memory (DRAM) constitute the operational memory, and an indirect backup method called write-behind caching is the only disk function. Running databases or entire suites in memory speeds up queries by eliminating the need to perform disk writes and reads for immediate database operations. Interactive The blending of a graphical user interface for visualization data analysis with the presentation of the results, which makes possible more iterative analysis and broader use of the analytics tool. Natural language M ethods of modeling and enabling machines to extract processing (NLP) meaning and context from human speech or writing, with the goal of improving overall text analytics results. The linguistics focus of NLP complements purely statistical methods of text analytics that can range from the very simple (such as pattern matching in word counting functions) to the more sophisticated (pattern recognition or “fuzzy” matching of various kinds).