Downloaded 87 times


![PV Status Report 2009 | 9
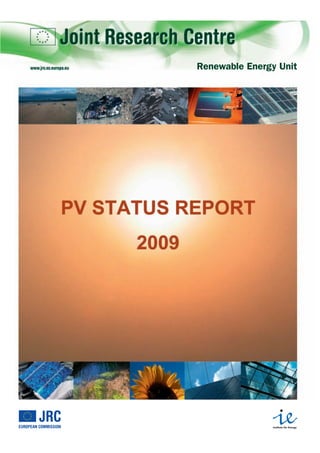
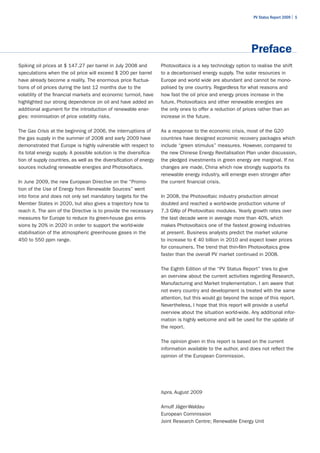
1. Introduction Production data for the global cell production1 in 2008 vary
between 6.9 GW and 8 GW. The significant uncertainty in the
data for 2008 is due to an overheated market, as well as the
fact that some companies report shipment figures, whereas
others report production figures. In addition, the difficult
economic conditions led to a decreased willingness to report
confidential company data. Nevertheless, the figures show
a significant growth of the production and an easing of the
tight silicon supply situation. However, the delay of a number
of silicon expansion projects might lead to a tight supply
situation again, if markets recover faster than the silicon
expansion takes place. Our own data, collected from various
companies and colleagues was then compared to various
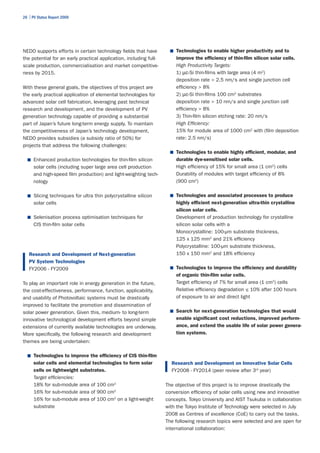
data sources thus led to an estimate of 7.35 GW (Fig. 1),
representing a production growth of about 80% compared
to 2007.
Again, both Chinese and Taiwanese production increased
over-proportionally, keeping the PRC in the top rank with
about 2.4 GW followed by Europe with 1.9 GW, Japan with
1.2 GW and Taiwan with 0.8 GW. In terms of production,
Q-cells (DE) was N° 1 (570 MW), followed by Suntech (PRC)
with 550 MW, First Solar (US/DE/Malaysia) 503 MW and
Sharp (JP) 470 MW. However, in terms of shipments, the or-
der was slightly revised, N° 1 Q-cells (DE) 570 MW, followed
by Suntech (PRC) with 497 MW, Sharp (JP) 458 MW and First
Solar (US/DE/Malaysia) with 435 MW [Min 2009].
1
Solar cell production capacities mean:
- In the case of wafer silicon based solar cells only the cells
- In the case of thin films, the complete integrated module
- Only those companies which actually produce the active circuit (solar cell) are counted
- Companies which purchase these circuits and make cells are not counted.
Fig. 1: World PV Cell/Module Production 8000
from 1990 to 2008
(data source: Navigant [Min 2009], Rest of World
7000
PV News [Pvn 2009] and own analysis) United States
Taiwan
6000
PR China
PV Production [MW]
Europe
5000
Japan
4000
3000
2000
1000
0
1990 1995 2000 2001 2002 2003 2004 2005 2006 2007 2008](https://image.slidesharecdn.com/pvindustrystatusreport2009-110903042424-phpapp02/85/Pv-industry-status-report-2009-11-320.jpg)
![10 | PV Status Report 2009
This rapid increase of the production also led to a massive The number of consulting companies and financial institu-
increase of inventory stocks. This can be observed if one tions offering market studies and investment opportunities
looks at the development of the figures reported for ship- has considerably increased in the last few years and busi-
ments to first point of sale (5.5 GW) [Min 2009] and the ness analysts are very confident that despite raising interest
global PV Market estimates which range between 5.5 GW rates, the Photovoltaics sector is in a healthy long term
and 6 GW [Epi 2009, Fra 2009]. condition. Following the stock market decline, as a result of
the financial turmoil, the PPVX3 (Photon Pholtovoltaic stock
Since 2003, total PV production increased almost 10 fold index) declined to 2,095 points at the end of 2008. Between
with annual growth rates between 40% and 80%, whereas January and 7 August 2009 the index has increased by
the thin film segment – starting from a very low level – grew 12.9% to 2,552 points and the market capitalisation of
in average by over 90%. In 2008 shipments to point of first the 30-PPVX companies4 was € 32.6 billion. It is expected
sale increased to 750 MW or 14%. The high growth rate of that the arrival of the “green stimulus” money from govern-
thin film production and the increase of the total production ments aimed to help relieve the effect of the recession will
share indicate that the thin film technology is gaining more further stimulate the PV markets. Since September 2008,
and more acceptance in the markets. Equally competitive the major economies have announced about US $ 185 billion
technologies are amorphous/micromorph Silicon, CdTe and (€ 132 billion) of recovery funds aimed at renewable energies
Cu(In,Ga)(S,Se)2 thin films. In addition, more and more PV or energy efficiency measures. However, analysts predict that
manufacturers are diversifying their production portfolio and only about 15% or less will be spent in 2009, whereas two
add thin film production to the wafer based one. It should be thirds of these funds will be spent in 2010 and 2011.
noted that the current thin film market leader First Solar will
reach an annual production capacity of more than 1 GW by 3
The PPVX is a non commercial financial index published by the solar magazine
the end of 2009. Sharp (Japan), Showa Shell Sekiyu (Japan) „Photon“ and „Öko-Invest“. The index started on 1 August 2001 with 1000 points and 11
companies and is calculated weekly using the Euro as reference currency. Only companies
and Best Solar (PRC) had announced they would increase
which made more than 50% of their sales in the previous year with PV products or services
their thin film production to at least 1 GW capacity to be
are included [Pho 2007].
operational in 2010 [Bes 2008, Sha 2007] and 2011 [Sho
2008] respectively, but in the meantime their expansion 4
Please note that the composition of the index changes as new companies are added
speed has slowed down. Despite this development, a thin and others have to leave the index.
film market share of 20 to 25% in 2010 seems not to be
unrealistic as a number of other thin film manufacturers are Market predictions for the 2010 PV market vary between
aiming at 500 MW production capacities in that time frame. 6.8 GW (Navigant conservative scenario), 7 to 10 GW (EPIA
policy driven scenario, EuPD, Bank Sarasin, LBBW) and
Public traded companies manufacturing solar products, 17 GW (Photon Consulting). Massive capacity increases are
or offering related services, have attracted a growing number underway or announced and if all of them are realised, the
of private and institutional investors. In 2008 worldwide worldwide production capacity for solar cells would exceed
new investments into the renewable energy and energy 38 GW at the end of in 2010. This indicates that even with
efficiency sectors increased to a record US $ 155 billion the most optimistic market growth expectations, the planned
(€2 110 billion), up 5% from 2007, but the second half of capacity increases are way above the market growth. The
the year saw a significant slowdown due to the unfolding of consequence would be a quite low utilisation rate and
the financial crisis (Quarter to quarter difference: -10% Q3, consequently an accelerated shift from the demand-driven
-23% Q4) [New 2009]. This trend continued in the first markets of the last years to an oversupplied market which
quarter of 2009 (-47% compared to Q4 2008), but then will increase the pressure on the margins. Such a develop-
started to reverse in the 2nd quarter (+83% compared to ment will accelerate the consolidation of the Photovoltaics
Q1 2009) [New 2009a]. industry and spur more mergers and acquisitions.
New investments in solar power grew again surpassing The current solar cell technologies are well established
bioenergy and second only to wind with US $ 33.5 billion and provide a reliable product, with sufficient efficiency and
(€ 23.9 billion) or 21.6% of new capital in 2008 [UNEP 2009]. energy output for at least 25 years of lifetime. This reliabil-
Solar power continued to be the fastest growing sector for ity, the increasing potential of electricity interruption from
new investments: acquisition transactions US $ 11 billion grid overloads, as well as the rise of electricity prices from
(€ 7.86 billion), venture capital (VC) and private equity (PE) conventional energy sources, add to the attractiveness of
US $ 5.5 billion (€ 3.93 billion), public market investments Photovoltaic systems.
US $ 6.4 billion (€ 4.57 billion).
2
Exchange rate: 1 € = 1.40 US$](https://image.slidesharecdn.com/pvindustrystatusreport2009-110903042424-phpapp02/85/Pv-industry-status-report-2009-12-320.jpg)
![PV Status Report 2009 | 11
About 85% of the current production uses wafer-based Projected silicon production capacities available for solar
crystalline silicon technology. Up to now the main advantage in 2010 vary between 99,500 metric tons [Pvn 2008] and
of this technology was that complete production lines could 245,000 metric tons [EuP 2008]. The possible solar cell
be bought, installed and be up and producing within a rela- production will in addition depend on the material use per
tively short time-frame. This predictable production start-up Wp. Material consumption could decrease from the current
scenario constitutes a low-risk placement with calculable 10 g/Wp down to 8 g/Wp, but this might not be achieved
return on investments. However, the last shortage in silicon by all manufacturers.
feedstock and the market entry of companies offering turn-
key production lines for thin film solar cells led to a massive Similar to other technology areas, new products will enter
expansion of investments into thin film capacities. More the market, enabling further cost reduction. Concentrating
than 150 companies are involved in the thin film solar cell Photovoltaics (CPV) is an emerging market with approximately
production process ranging from R&D activities to major 17 MW cumulative installed capacity at the end of 2008.
manufacturing plants. In addition, Dye-cells are getting ready to enter the market
as well. The growth of these technologies is accelerated
The past shortage in silicon feedstock, the relative slow by the positive development of the PV market as a whole.
response of the established silicon producers and the accel- It is interesting to note that not only new players are entering
erated expansion of production capacities led to the market into thin film production, but also established silicon-based
entry of new potential silicon producers. PV cell manufacturers diversify into thin film PV.
The following developments can be observed at the moment:
It can be concluded that in order to maintain the extremely
■ Silicon producers are in the process of increasing their high growth rate of the Photovoltaic industry, different path-
production capacities, which will ease the pressure ways have to be pursued at the same time:
on the supply side within the next years. However, a
number of expansion projects have been delayed due to ■ Drastic increase of solar grade silicon production
the financial constraints and current market situation. capacities;
■ New silicon producers are entering the market, and in ■ Accelerated reduction of material consumption per
the process of finalising their business plans or are silicon solar cell and Wp, e.g. higher efficiencies,
already constructing new production facilities. However, thinner wafers, less wafering losses, etc.;
due to the current restricted financial opportunities
a number of projects are on hold or cancelled. ■ Accelerated introduction of thin film solar cell techno-
logies and CPV into the market as well as capacity
■ PV companies accelerate the move to thinner silicon growth rates above the normal trend.
wafers and higher efficient solar cells in order to save
on the silicon demand per Wp. Further cost reduction will depend not only on the scale-up
benefits, but also on the cost of the encapsulation system,
■ Significant expansions of thin film production capacities if module efficiency remains limited to below 15%, stimulating
of existing manufacturers are under way and a large strong demand for very low area-proportional costs.
number of new manufacturers try to enter the market
to supply the growing demand for PV modules. Despite
the scale back of expansion plans by some companies,
the number of new entrants and their planned capaci-
ties are still increasing the overall announced capacity.
If all announced thin film production capacities are
realised, more than 11 GW production capacities could
be reached by 2010. This is an increase of about 10%
compared to the announcements made in the autumn
of last year.](https://image.slidesharecdn.com/pvindustrystatusreport2009-110903042424-phpapp02/85/Pv-industry-status-report-2009-13-320.jpg)

![PV Status Report 2009 | 13
2. The World Market
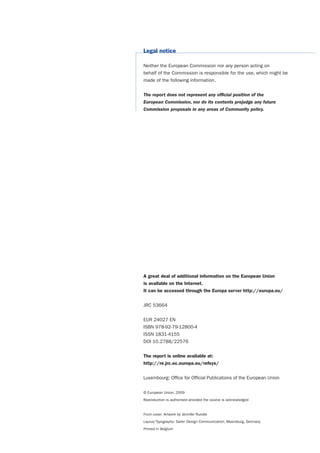
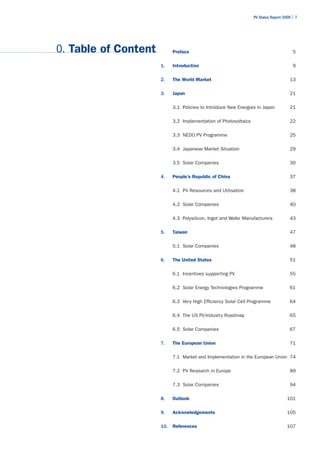
The Photovoltaic world market grew in terms of production
by more than 80% in 2008 to approximately 7.35 GW. The
market for installed systems about doubled and the current
estimates are between 5.6 and 6 GW, as reported by various
consultancies (Fig.2). One could guess that this represents
mostly the grid connected Photovoltaic market. To what ex-
tent the off-grid and consumer product markets are included
is unclear. The difference of roughly 1.3 to 1.75 GW could
therefore be explained as a combination of unaccounted
off-grid installations (approx. 100 MW off-grid rural, approx.
100 MW communication/signals, approx. 80 MW off-grid
commercial), consumer products (ca. 100 MW) and cells/
modules in stock.
The impressive growth in 2008 is mainly due to the excep-
tional development in the Spanish market, which almost
increased five-fold from 560 MW in 2007 to 2.5 – 2.7 GW in
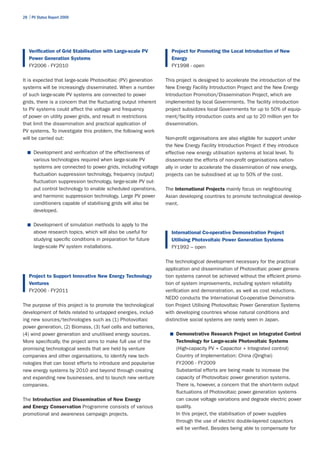
Fig. 2: Annual Photovoltaic Installations from 6000
2000 to 2008
(data source: EPIA [Epi 2009], Eurobserver Spain
Annual Photovoltaic Installations [MW]
[Sys 2009] and own analysis) 5000 Rest of Europe
United States
Rest of World
Germany
4000
Japan
3000
2000
1000
0
2000 2001 2002 2003 2004 2005 2006 2007 2008](https://image.slidesharecdn.com/pvindustrystatusreport2009-110903042424-phpapp02/85/Pv-industry-status-report-2009-15-320.jpg)
![14 | PV Status Report 2009
2008 [Epi 2009, Sys 2009]. The second largest and most voltaic Technology Development and $ 40.5 million will be
stable market was Germany with 1.5 GW followed by the US spent on Solar Energy Deployment, where projects will focus
(342 MW), South Korea (282 MW), Italy (258 MW) and Japan on non-technical barriers to solar energy deployment.
(230 MW). The Photovoltaic Energy Barometer reported that
Europe had a cumulative installed PV system capacity of There is no single market for PV in the United States, but a
9.5 GW in 2008. conglomeration of regional markets and special applications for
which PV offers the most cost-effective solution. In 2005 the
Despite the fact that the European PV production grew again cumulative installed capacity of grid-connected PV systems
by over 80% and reached 1.9 GW, the exceptional market surpassed that of off-grid systems. Since 2002 the grid-
situation in Spain, the size of the German and the rapidly connected market has been growing much faster, thanks to
developing Italian market, the promising developments in a wide range of “buy-down” programmes, sponsored either
Belgium, the Czech Republic (51 MW), France (46 MW) and by States or utilities.
Table 1: Korean Feed-in Tarifs [Kim 2009]
Fixed Price in Korean Won/kWh (¤5/kWh)
Until Period <30kW >30 kW
30 Sept. 2008 15 years 711.25 677.38
(€ 0,44) (€ 0,42)
Until Period <30kW 30 – 200 kW 200 kW – 1 MW 1 MW – 3 MW >3 MW
1. Oct. 2008 – 2009 15 years 646.96 620.41 590.87 561.33 472.7
(0,40) (0,39) (0,37) (0,35) (0,30)
20 years 589.64 562.84 536.04 509.24 428.83
(0,37) (0,35) (0,34) (0,32) (0,27)
Portugal (50 MW) did not change the role of Europe as a net South Korea became the fourth largest PV market in 2008.
importer of solar cells and/or modules. The ongoing capacity At the end of 2006 the cumulative installed capacity of
expansions and the cap in the Spanish market might change Photovoltaic electricity systems was only in the range of
this in the future. 25 MW. In 2007 about 45 MW were installed and in 2008
the market surpassed the estimated 75 to 80 MW by far,
The third largest market was the USA with 342 MW of PV with 282 MW of new installations [Kim 2009]. The driver
installations, 292 MW grid-connected [Sei 2009]. California, for this development is the Government's goal to increase
New Jersey and Colorado account for more than 75% of the the share of New and Renewable Energy Sources (NRES) to
US grid-connected PV market. After more than a year of politi- 5% by 2011. For Photovoltaics, a goal of 1.3 GW cumulative
cal debate the US Senate finally voted to extend the tax cred- installed Photovoltaic electricity generation capacity by 2012
its for solar and other renewable energies on 23 September and 4 GW by 2020 was set.
2008. On 3 October 2008, following weeks of contentious
negotiations between the House and Senate, Congress In January 2009, the Korean Government has announced
approved and the President signed into law the “Energy the third National Renewable Energy Plan, under which
Improvement and Extension Act of 2008” as part of H.R. renewable energy sources will steadily increase their share
1424, the “Emergency Economic Stabilization Act of 2008”. of the energy mix between now and 2030. The plan covers
such areas as investment, infrastructure, technology develop-
On 27 May 2009, President Obama announced to spend ment and programmes to promote renewable energy.
over $ 467 million from the American Reinvestment and The new plan calls for a Renewable Energies share of 4.3%
Recovery Act to expand and accelerate the development, in 2015, 6.1% in 2020 and 11% in 2030.
deployment, and use of geothermal and solar energy through-
out the United States. The Department of Energy (DOE) will To reach this target, South Korea had introduced an attrac-
provide $ 117.6 million in Recovery Act funding to accelerate tive feed-in tariff for 15 years along with investment grants
the widespread commercialisation of solar energy technolo- up to 60%. From October 2008 to 2011 the following feed-in
gies across America. $ 51.5 million will go directly for Photo- tariffs are valid (Table 1).
5
Exchange rate: 1 € = 1600 KRW](https://image.slidesharecdn.com/pvindustrystatusreport2009-110903042424-phpapp02/85/Pv-industry-status-report-2009-16-320.jpg)
![PV Status Report 2009 | 15
From 2012 on it is planned to substitute the tariffs by a chase of “excess” electricity from PV systems at a higher
Renewable Portfolio Standard. In the new tariff scheme it rate and it is planned to introduce this measure for FY2010.
is possible to choose between 15 years guarantee and a The “Japanese Recovery Plan” with its three pillars 1) Low-
higher kWh price and a 20 years guarantee and a somewhat carbon revolution, 2) Healthy long life and 3) Exert Attractive-
lower kWh price. The previous 100 MW cap was increased ness includes the specific project “Plan to become the
to 500 MW and if it is not reached in 2009 the fixed prices world's leading PV & energy-saving nation” and calls for a
applicable for new systems in 2010 will be announced drastic acceleration of the introduction of PV power genera-
later. However, the cumulative installed capacity at the end tion. The goal is an approximately twenty-fold increase of
of 2007 was 78 MW. In January 2008, 46 MW of installed the cumulative installed PV capacity by 2020.
capacity was under the cap scheme and more than 560 MW
were already under planning or construction. The Korean In addition to the National Government, Local Government
Government aims to equip 100,000 houses and 70,000 and Utilities have announced plans as well. The Tokyo Metro-
public/commercial buildings with PV systems by 2012. An politan Government implemented a plan to install 1 GW
interesting aspect is that some of the larger projects will within the next 10 years and gives an investment support for
qualify for Clean Development Mechanism (CDM) credits, the installation of residential PV systems in FY 2009
allowing for trading of Certified Emission Reductions (CER) and FY2010. Other prefectures and cities have also announ-
under the Kyoto Protocol. ced implementation plans and are offering additional invest-
ment incentives as well.
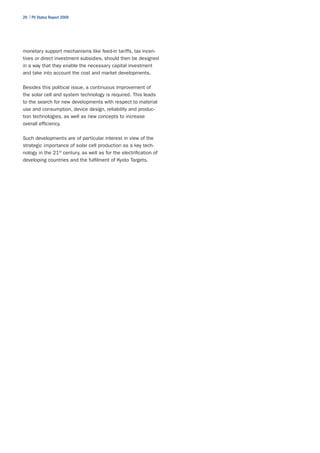
After two years of decline, the Japanese market rebounded
slightly and reached 230 MW of new installations, 9% higher At the end of 2008, total cumulative installed capacity in
than in 2007, but still 21% lower than in 2006 and 2007. 2008 stands at 2.15 GW, less than half of the original
To change this situation, the Japanese Ministry for Economy, 4.8 GW goal for 2010 [Ohi 2009, Epi 2009]. Despite a
Trade and Industry (METI) proposed a new investment incen- production increase of 31% in 2008 compared to 2007,
tive scheme which was introduced by the Japanese Govern- the world market share of Photovoltaic devices manufac-
ment, starting in January 2009. The allocated budget for the tured in Japan further decreased from 23% to 17%.
last months of FY2008 (January – March 2009) and FY2009 The number of Japanese companies amongst the Top Ten
would allow the installation of more than 100,000 systems was three, equal to those from PR China (Fig. 3).
or 400 MW.
The rapid expansion of solar cell manufacturing capacities
METI started to review the Renewable Portfolio Standard and production volume in the People's Republic of China and
(RPS) Law in order to prepare the introduction of a new PV Taiwan is not yet reflected in a significant size of the respec-
power purchase programme, which should allow the pur- tive home markets.
Fig. 3: Top 10 Photovoltaic companies 2008 700
941
2004 3,430
600
2006
2008
Annual Production [MW}
500
400
300
200
100
0
s
E)
)
P)
)
P)
P)
)
T)
)
T)
H
er
C
C
)
W
C
(D
(J
(J
(J
(P
(IN
R
R
(IN
th
(T
PR
(P
(P
O
o
a
rp
ls
er
ar
h
ny
er
ld
r(
el
a
r
h
ow
ec
la
ol
or
oc
Sh
ec
-C
Sa
la
So
ot
tS
rw
nP
So
Ky
nt
Q
M
la
rs
Su
JA
Su
li
So
Fi
ng
Yi
6
Exchange rate: 1 € = 9.5 RMB](https://image.slidesharecdn.com/pvindustrystatusreport2009-110903042424-phpapp02/85/Pv-industry-status-report-2009-17-320.jpg)
![16 | PV Status Report 2009
Despite the fact that the Chinese PV market more than 100 GW by 2030 and 200 GW by 2050.
doubled in 2008 to 45 MW, the home market is still less
then 2% of total Photovoltaic production. This situation might In April 2009, SEMI's PV group published a White Paper
change because China’s RMB 4 trillion stimulus package, where they identified the need for focused, collaborative and
which was announced in early March 2009, includes RMB goal-driven R&D for Photovoltaics in India as one of the key
210 billion (€ 22 billion6) for green energy programmes. challenges for the growth and development of PV in industry
On 23 March 2009 the Chinese Ministry of Finance and [Sem 2009]. This is a clear signal that the current support
Ministry of Housing and Urban-Rural Development [Mof 2009] activities for the increase of production capacities and de-
announced a solar subsidy programme which immediately ployment are seen as insufficient to utilise the solar potential
went into effect. For 2009 the subsidy will be 20 RMB/Wp of the country. The materials and semiconductor research
(2.10 €/Wp) installed. The document neither mentions a base in India is excellent and with proper public and private
cap on individual installations nor a cap for the total market. funded R&D Programmes in place, India's academia and
It was suggested that 70% of the incentives budget would be industry could accelerate the development and growth of
transferred to the Provincial Finance Ministries. the industry substantially.
Analysts believe that these measures will accelerate the At the end of 2008, most of Photovoltaic applications in
Chinese domestic market. For 2009 a doubling, or even India were off-grid, mainly solar lanterns, solar home sys-
tripling of the market seems possible as a starting point for tems, solar street lights and water pumping systems. Grid-
the development of a GW size market from 2012 on. China connected were 33 solar Photovoltaic systems with a total
is now aiming for 2 GW solar capacity in 2011 and in July capacity of approximately 2 MWp. For its eleventh Five Year
2009 under the new energy stimulus plan China revised its Plan (2008 – 2012) India has set a target to install 50 MW
2020 targets for installed solar capacity to 20 GW. In addi- grid-connected Photovoltaic systems supported by the
tion, the National Energy Administration (NEA) has set a subsi- Ministry of New and Renewable Energy with an investment
dised price for solar power at 1.09 RMB/kWh (0.115 €/kWh). subsidy and power purchase programme. Contrary to these
moderate installation plans, Indian PV companies expect the
To promote the solar energy industry the Taiwanese Govern- PV market in India to grow to 1 – 2 GW by 2010.
ment decided to subsidise manufacturers engaging in R&D
and will offer incentives to consumers that use solar energy. Another noteworthy development is the fact that the market
About a dozen manufacturers expressed the intention to in- share of the ten largest PV manufacturers together further
vest in fabricating thin films for solar cells and eight of them decreased from 80% in 2004 to 50% in 2008. This develop-
will set up their own plants to process the products. More- ment is explained by the fact that an increasing number of
over, the Industrial Technology Research Institute (ITRI), solar cell manufacturers are entering the market. The most
a Government-backed research organisation, is going to rapid expansion of production capacities can be observed
import advanced foreign technology for local manufacturers. at the moment in China and Taiwan, but other countries like
India, Malaysia and South Korea are following the example
On 12 June 2009, the Legislative Yuan passed the “Renew- to attract investment in the solar sector.
able Energy Development Statute”, which aims to increase
the total renewable electricity capacity by 6.5 GW over the The announced increases of production capacities – based
next 20 years. It is expected that 1.2 GW of these new on a survey of more than 200 companies worldwide – again
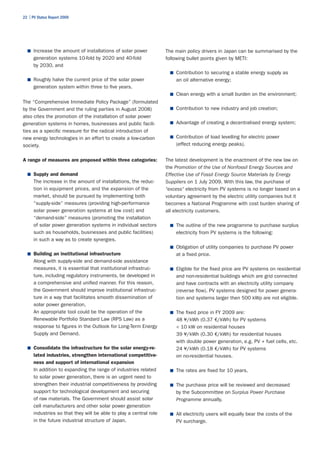
renewable capacities would come from PV. accelerated in 2008 and the first half of 2009 (Fig. 4). Only
published announcements of the respective companies and
On 1 July 2008, Prime Minister Manmohan Singh unveiled no third source info were used. The cut-off date of the info
India’s first National Action Plan on Climate Change. To cope used was July 2009.
with the challenges of Climate Change India identified eight This method has of course the setback that
National Missions aimed to develop and use new technolo-
gies. The use of solar energy with Photovoltaics and Concen- a) not all companies announce their capacity increases in
trating Solar Power (CSP) is described in the National Solar advance, and
Mission (NSM). The actions for Photovoltaics in the National
Solar Mission call for R&D collaboration, technology transfer b) that in times of financial tightening, the announcements
and capacity building. In April 2009, the Union Government of expansion plan scale-back are often delayed in order not
finalised the draft for the National Solar Mission. It aims to to upset financial markets.
make India a global leader in solar energy and envisages
an installed solar generation capacity of 20 GW by 2020, Therefore, the capacity figures just give a trend, but do not](https://image.slidesharecdn.com/pvindustrystatusreport2009-110903042424-phpapp02/85/Pv-industry-status-report-2009-18-320.jpg)
![PV Status Report 2009 | 17
represent final numbers. It is worthwhile to mention that between the two figures, which cannot be avoided.
despite the fact that a significant number of players have
announced a slow down of their expansion, or cancelled If all these ambitious plans can be realised by 2012, China
their expansion plans for the time being, the number of new will have about 32% of the worldwide production capacity of
entrants into the field, notably large semiconductor or energy 54 GW, followed by Europe (20%), Taiwan (15%) and Japan
related companies, are overcompensating this and, at least (12%) (Fig. 4). However, it is expected that the capacity utili-
on paper, are increasing the expected production capacities. sation rate will further decrease from 56% in 2007 and 54%
in 2008 to less than 50% in 2012.
In addition, the assessment of all the capacity increases is
rather difficult, as it is affected by the following uncertain- In 2005 production of Thin-Film solar modules reached for
ties. The announcements of the increase in production ca- the first time more than 100 MW per annum. Since then
pacity in Europe, the US or China, often lack the information the Compound Annual Growth Rate (CAGR) of thin-film solar
about completion date compared to Japan. Because of the module production was even beyond that of the overall
Japanese mentality, where it is felt that a public announce- industry increasing the market share of thin-film products
ment reflects a commitment, the moral pressure to meet a from 6% in 2005 to 10% in 2007 and 12 – 14 % in 2008.
given time target is higher in Japan than elsewhere, where Thin-film shipments in 2008 increased by 129% compared
delays are more acceptable. Not all companies announce to 2007 and the utilisation rate of thin-film capacities is 60%
their capacity increases in advance. and somewhat higher than the overall utilisation rate of the
photovoltaic industry, with 54%.
In addition, it is of high importance to note that production
capacities are often announced, taking into account different More than 150 companies are involved in the thin-tilm solar
operation models, such as number of shifts, operating hours cell production process, ranging from R&D activities to major
per year, etc. manufacturing plants. The first 100 MW thin-film factories
became operational in 2007 and the announcements of
Announcements of the increase in production capacity do new production capacities accelerated again in 2008. If all
not always specify when the capacity will be fully ramped expansion plans are realised in time, thin-film production
up and operational and frequently refer to the installation of capacity could be 11.9 GW (vs 4.5 GW reported 2007 at the
the equipment only. It does not mean that the production line 22nd EUPVSEC in Milan) or 30% of the total 39 GW in 2010
is really fully operational. This means, especially with new and 20.4 GW in 2012 of a total of 54.3 GW (Fig. 5). The first
technologies, that there can be some time delay between thin-film factories with GW production capacity are already
installation of the production line and real sales of solar under construction for various thin-fFilm technologies.
cells. In addition, the production capacities are not equal to
sales and therefore, there is always a noticeable difference However, one should bear in mind that out of the ca. 150
Fig. 4: World-wide PV Production 2008 70.000
and planned production capacity increases
ROW
60.000
USA
50.000 Taiwan
China
40.000
[MW]
Europe
30.000 Japan
20.000
10.000
0
Production Planned Planned Planned Planned Planned
2008 Capacity Capacity 2009 Capacity 2010 Capacity 2012 Capacity 2015
2008](https://image.slidesharecdn.com/pvindustrystatusreport2009-110903042424-phpapp02/85/Pv-industry-status-report-2009-19-320.jpg)
![18 | PV Status Report 2009
companies, which have announced their intention to in- with approximately 17 MW cumulative installed capacity at
crease their production capacity or start up production in the end of 2008. There are two main tracks – either high
the field of thin films, only one fourth have actually already concentration > 300 suns (HCPV) or low to medium concen-
produced thin film modules on a commercial scale. tration with a concentration factor of 2 to approx. 300. In order
to maximise the benefits of CPV, the technology requires
For 2010 about 12 GW of thin film production capacities are high Direct Normal Irradiation (DNI) and these areas have
announced, which is almost a doubling of the 2009 figures. a limited geographical range – the “Sun Belt” of the Earth.
Considering that the 2009 end-of-year capacity could eventu- The market share of CPV is still small, but an increasing
ally be ready for production, First Solar and Sharp together number of companies are focusing on CPV. In 2008 about
could contribute with about 2 GW, whereas the other existing 10 MW of CPV were produced and market predictions for
producers would add about the same capacity. For that reason, 2009 and 2010 are 30 MW and 100 MW respectively.
4 GW production in 2010 are considered as possible, if market
conditions allow. For the remaining 2 GW there is a high In the case of a continuing silicon feedstock expansion to
uncertainty as to whether or not it can be realised in the 120,000 metric tons available for the solar industry and a
time-frame given. material consumption decrease to 8 g/Wp, about 20 GW
of solar cells could theoretically then be produced annually
Despite the fact that only limited comparisons between the (15 GW silicon based and 6 GW thin films). This would be
different world regions are possible, the planned cell produc- twice as much as the current optimistic market predictions
tion capacities portray some very interesting developments. forecast. Another important factor is the actual utilisation
rate of the production capacities. For 2007 and 2008, the
First, the technology, as well as the company distribution, overall capacity utilisation rates of the solar cell industry with
varies significantly from region to region (Fig. 6). 48 compa- respect to shipments were given as 56% and 54% respective-
nies are located in Europe, 41 in China, 25 in the US, 17 in ly by Navigant Consulting [Min 2009]. This is different from
Taiwan, 9 in Japan and 16 elsewhere. The majority of 117 the utilisation rate with respect to production, as shipments
companies is silicon based. The reason is probably that were given with 3,061 MW and 5,492 MW by Navigant.
in the meantime there is a number of companies offering
complete production lines for amorphous and/or micro- Second, more than 15 companies are aiming at total pro-
morph silicon. 30 companies will use Cu(In,Ga)(Se,S)2 as duction capacity in the order of 1GW or more within the next
absorber material for their thin-film solar modules, whereas five to six years. The number of those aiming at 500 MW
11 companies will use CdTe and 8 companies go for dye and or more in the same time-frame is above 20.
other materials.
This leads to a third observation. If the large increase in pro-
Concentrating Photovoltaics (CPV) is an emerging market duction capacity is realised in China, the share on the world
Fig. 5: Actual and planned PV Production 70000
capacities of Thin-Film and Crystalline Silicon
based solar modules. Crystalline Silicon
60000
Thin Films
Production Capacity [MW]
50000
40000
30000
20000
10000
0
2006 2008 2009 2010 2012 2015](https://image.slidesharecdn.com/pvindustrystatusreport2009-110903042424-phpapp02/85/Pv-industry-status-report-2009-20-320.jpg)
![PV Status Report 2009 | 19
Fig. 6: Regional and technology
distribution of the thin-film 6000
production capacity increases.
CIS
5000 CdTe
Production Capacity [MW] silicon based
4000
3000
2000
1000
0
USA
USA
USA
USA
USA
Taiwan
Taiwan
Taiwan
Taiwan
Taiwan
ROW
ROW
ROW
ROW
ROW
Japan
Japan
Japan
Japan
Japan
China
China
China
China
China
Europe
Europe
Europe
Europe
Europe
2008 2009 2010 2012 2015
market would increase from 11.9% in 2005 to about 32% in lations of new Photovoltaic systems would have to increase
2012. This production capacity would be much more than from around 4.5 GW per annum in 2008 to 40 – 90 GW per
the 2 GW of cumulative installed solar systems in the People’s annum in 2020. This corresponds to a CAGR (Compound
Republic of China by 2011, as announced in July 2009. Annual Growth Rate) of 26% to 33% over the next 12 years.
Despite the positive market development signs in China, the
solar cell manufacturers in China will continue with a high This would be a dramatic change from the development of
export rate (98% in 2007) of their production to the growing the last years. Since the introduction of the German Feed-in
markets in Europe, the US and developing countries. Law in 1999, more than 80% of European PV systems were
installed in Germany. The Spanish PV market grew from
In response to the Intergovernmental Panel on Climate 14.5 MW in 2005, to about 2.7 GW in 2008. However,
Change's (IPCC) Fourth Assessment Report “Climate Change the prospects for 2009 are not as bright as the Spanish
2007”, the European Council endorsed during its Council Government introduced a cap of 500 MW on the yearly
Meeting in Brussels on 8-9 March 2007 a binding target installations, which is well below the 2008 installation figure.
of a 20% share of renewable energies in the overall EU Since 1999, European PV production has grown on average
energy consumption by 2020 and a 10% binding minimum by 50% per annum and reached almost 2 GW in 2008. The
target to be achieved by all Member States for the share of European market share rose during the same time from 20%
Biofuels in overall EU transport petrol and diesel consump- to 25%, whereas the Chinese from 0% to more than 30%.
tion [CEU 2007]. This target became law, when the Directive On the contrary, the US share decreased due to a weak home
2009/28/EC on the promotion of the use of energy from market. By 2005 the Japanese market share had increased
renewable energy sources was officially published on 5 June and stabilised at around 50 ± 3%, but decreased sharply to
2009 [EC 2009]. 37% in 2006, 24% in 2007 and 16% in 2008.
During the 23rd European Photovoltaic Solar Energy Conference The European PV industry has to continue its high growth
and Exhibition from 1 to 5 September 2008, Anton Milner, over the next years in order to maintain that level and to con-
Director of EPIA, presented the new vision of the European tribute to the new EPIA vision. This will, however, only be pos-
Photovoltaic Industry Association to produce 6 to 12% of sible if reliable and long-term political frame conditions – not
European electricity with Photovoltaic systems in 2020. This to be changed each year – are in place in Europe to enable
would correspond to 210 to 420 TWh of electricity or 175 to a return on investment for the PV industry and the final con-
350 GWp installed capacity of Photovoltaic electricity systems. sumer. One of the crucial issues is an agreement on an easy
To realise this new vision, around 165 GW to 340 GW of new and priority access of renewable electricity to the grid all over
capacity have to be installed between 2009 and 2020. Instal- Europe and preferably worldwide. The design of subsequent](https://image.slidesharecdn.com/pvindustrystatusreport2009-110903042424-phpapp02/85/Pv-industry-status-report-2009-21-320.jpg)
![PV Status Report 2009 | 21
3. Japan The long-term Japanese PV research and development
programmes, as well as the measures for market implemen-
tation which started in 1994, have ensured that Japan has
become a leading PV nation world-wide. The principles of
Japan’s Energy Policy are the 3Es:
■ Security of Japanese Energy Supply (Alternatives to oil)
■ Economic Efficiency (Market mechanisms)
■ Harmony with Environment (Cutting CO2 emissions on
line with the Kyoto Targets)
3.1 Policies to Introduce New Energies in
Japan
In earlier Status Reports, the main differences between
the Japanese and European reasons for the introduction of
renewable energies, as well as the history, were already de-
scribed [Jäg 2004]. The current basic energy policy is based
on market principles, but seeks to ensure a stable supply
and environmentally-friendly production and consumption of
energy at the same time [MET 2006]. The justification for
the promotion of New Energies is spelled out in the goals
supporting this policy:
■ Promoting energy conservation measures;
■ Developing and introducing diverse sources of energy;
■ Ensuring a stable supply of oil;
■ Basing the energy market on market principles.
The scarcity of natural conventional energy resources in
Japan, the current status of mid/long-term supply of oil and
the risks for a stable energy supply for Japan, as well as the
need to address global environmental problems, such as
reducing emissions of greenhouse gases like CO2, increase
the need to accelerate the advancement of implementation
of new energy. A description of the development of the Japa-
nese legislation and activities can be found in the 2008 PV
Status Report [Jäg 2008].
In November 2008, METI published the “Action Plan for Promo-
ting the Introduction of Solar Power Generation” [MET 2008].
This Action Plan was developed in order to support the Govern-
ment’s “Action Plan for Achieving a Low-carbon Society”
(approved by the Cabinet in July 2008) which set targets such as](https://image.slidesharecdn.com/pvindustrystatusreport2009-110903042424-phpapp02/85/Pv-industry-status-report-2009-23-320.jpg)
![PV Status Report 2009 | 23
3.2 Implementation of Photovoltaics 1) Strategic promotion of technological developments
as a driving force for competitiveness:
The Japanese residential implementation programme for
Photovoltaics, which ended in October 2005, was the long- ■ Promotion of technological development to overcome
est running. It started with the “Monitoring Programme for high costs;
Residential PV systems” from 94 to 96, followed by the
“Programme for the Development of the Infrastructure for ■ Development of PV systems to facilitate grid-connection
the Introduction of Residential PV Systems”, which has been and creation of the environment for its implementation.
running since 1997. During this period, the average price
for 1 kWp in the residential sector fell from 2 million ¥/kWp 2) Accelerated demand creation:
in 1994 to 670,000 ¥/kWp in 2004. With the end of the
“Residential PV System Dissemination Programme” in October ■ Develop a range of support measures besides subsidies;
2005, the price data base of the New Energy Foundation
(NEF) was no longer continued. ■ Support to create new business models.
The Residential PV System Dissemination Programme has 3) Enhancement of competitiveness to establish a
been leading the expansion of Japan's PV market for 12 years. sustainable PV industry:
In 2006, 88.5%, or 254 MW of the new installations were
grid-connected residential systems, bringing the accumulated ■ Establishment of standards, codes and an accreditation
power of solar systems under the Japanese PV Residential system to contribute to the availability of human
Programme to 1,617 MW, out of 1,709 MW total installed resources, as well as securing performance, quality
PV capacity at the end of FY 2006 [Mat 2007]. However, in and safety;
FY 2007 the Japanese market declined to 210 MW and only
recovered slightly to 230 MW in 2008 [Ohi 2009, Epi 2009]. ■ Enhancement of the awareness for Photovoltaic systems;
At the end of 2008, total cumulative installed capacity was
2.15 GW, less then half of the original 4.8 GW goal for 2010. ■ Promotion of international co-operation.
In general, the end of the Residential PV System Dissemi- The key elements are industry-policy targeted and the goal
nation Programme in FY 2005 was considered the main is to strengthen the renewable energy industry in Japan.
reason for the decrease of new installations, but not so much This includes the whole value chain from raw material pro-
because of the financial incentive of ¥ 20,000 per kWp, but duction, cell, module and BOS component manufacturing
because this was perceived as lack of political support. In to the es-tablishment of business opportunities in overseas
order to stop the downward trend of the Japanese market markets. The strong focus on the establishment of interna-
and to stimulate the home market, METI announced at tional standards should help to transfer the new Japanese
the end of August 2008 that they wanted to reinstate an business models world-wide.
investment subsidy for residential Photovoltaic systems in
FY 2009 and that they have submitted a budget request. The number of Japanese Ministries working on support
measures to install PV systems has expanded from METI
These new measures to revitalise the Japanese market, to the Ministry of the Environment (MOE), the Ministry of
as well as METI's “Vision for New Energy Business” (June Land, Infrastructure and Transport (MLIT) and the Ministry
2004), the “New National Energy Strategy” (June 2006) of Agriculture, Forestry and Fisheries of Japan (MAFF).
and the “Action Plan for Promoting the Introduction of Solar
Power Generation” (November 2008) confirm the political In addition to the measures taken by the National Govern-
support for renewable energies. ment, over 300 local authorities have introduced measures
to promote the installation of PV systems. One of the largest
These activities are aimed to develop an independent and programmes was announced by the Tokyo Metropolitan
sustainable new energy business and various support meas- Government which plans to support the installation of 1 GW
ures for PV are explicitly mentioned. The key elements are: of PV systems in 40,000 households in FY2009 and 2010.
The Federation of Electric Power Companies of Japan (FEPC)
announced that they intend to install PV plants with a cumu-
lative installed capacity of 10 GW by 2020 [Ikk 2008].
7
Photovoltaic Power Generation Technology Research Association
8
Japan Photovoltaic Energy Association](https://image.slidesharecdn.com/pvindustrystatusreport2009-110903042424-phpapp02/85/Pv-industry-status-report-2009-25-320.jpg)
![24 | PV Status Report 2009
Fig. 7: Japanese Roadmap
for PV R&D and market
implementation [Kur 2004]
Table 2: Key points of PV2030+ scenario for future growth of PV power generation
Target
(completion of development) 2010 or later 2020 (2017) 2030 (2025) 2050
Power generation cost Equivalent to house- Equivalent to Equivalent to Equivalent to
hold retail price commercial general power general power
retail price generation generation
(23 ¥/kWh) (14 ¥/kWh) (7 ¥/kWh) (7 ¥/kWh or below)
Commercial module
conversation 16% 20% 25% ultra high performance
(Lab.efficiency) (20%) (25%) (30%) modules with 40% added
Production for Japanese Market
[GW/annum] 0.5 - 1 2 to 3 6 to 12 25 - 35
Production for Export
[GW/annum] ca 1 ca 3 30 - 35 ca 300
Major applications single family houses, single/multi family single/multi family consumer use,
public facilities houses, public houses, public indutries, transport,
facilities, commercial facilities, consumer agriculture, etc.,
buildings use, charging Evs, etc. stand alone power source](https://image.slidesharecdn.com/pvindustrystatusreport2009-110903042424-phpapp02/85/Pv-industry-status-report-2009-26-320.jpg)
![PV Status Report 2009 | 25
In 2004, NEDO, METI, PVTEC7 and JPEA8 drafted the “PV and PV systems. In addition to these activities, there are
Roadmap towards 2030” (Fig.7) [Kur 2004]. The world-wide programmes on future technology (in and outside NEDO)
changes of circumstances, especially the rapid growing Pho- where participation of Japanese institutes or companies
tovoltaic production and markets, as well as the accelerated occurs by invitation only. For the participation of non-Japa-
growth of energy demand in Asia, together with a changed nese partners, there are “future development projects” and
attribute towards Climate Change and the necessary green- the NEDO Joint Research Programme, mainly dealing with
house gas reductions in Japan, have led to a revision of the non-applied research topics.
Roadmap PV2030 to 2030+. The review aims at further
expanding PV usage and maintaining the international com- Within the New Energy Technology Development Programme
petitiveness of Japan’s PV industry. there are projects on Photovoltaic technology specific issues,
problems of grid-connected systems, as well as public solici-
The 2030 Roadmap has been reviewed and the goal has tation.
been changed from “making PV power generation one of the
key technologies by 2030” to “making PV power generation
one of the key technologies, which plays a significant role
in reducing CO2 emissions by 2050, so that it can contribute Field Test Projects on Photovoltaic Power Generation
not only to Japan, but also to the global society”. FY2007 - FY2014 (Installation work to be completed in
FY2010)
In PV2030+, the target year has been extended from 2030
to 2050 and a goal to cover between 5 and 10 % of domestic To further promote the introduction of PV systems, it is
primary energy demand with PV power generation in 2050 considered essential to install them at public facilities,
was set. PV2030+ assumes that Japan can supply approxi- residential housing complexes, and in the industrial sector,
mately one-third of the required overseas market volumes such as at factories. The potential of such installations is
(Table 2). To improve economic efficiency, the concept of comparable to that of the detached home market. Medium-
“realiszing Grid Parity” remained unchanged and the generation and large-scale PV systems are being adopted more slowly
cost targets remained unchanged from PV2030. In addition, than detached home systems, even though costs have been
PV2030+ aims to achieve generation cost of below 7 ¥/kWh substantially reduced and their effectiveness as power
in 2050. Regarding the technological development, an accel- generation devices has been verified. Systems employing new
eration to realise these goals is aimed to achieve the 2030 modules or other innovations will be verified through joint
target already in 2025, five years ahead of the schedule set research activities (partly covered by technology research
in PV2030. For 2050, ultra-high efficiency solar cells with subsidies). Operating data is being analysed, evaluated,
40% and even higher conversion efficiency will be developed. and published with the objective of encouraging further
cost reductions and system performance improvements.
NEDO and joint researchers each bear 50% of the costs.
3.3 NEDO PV Programme
In Japan, the Independent Governmental Entity New Energy Development of Technologies to Accelerate the Practical
Development Organisation (NEDO) is responsible for the Application of Photovoltaic Power Generation Systems
Research Programme for Renewable Energies. The current FY2008 - FY2009
programme for Photovoltaics in the frame of Energy and
Environment Technologies Development Projects has three Technical development is needed to significantly increase
main pillars [NED 2007]: the efficiency of photovoltaic (PV) power generation systems
and to achieve a generation cost target of 14 yen/kW by
■ New Energy Technology Development 2020. Through various projects, including Research and
Development of Next-generation PV Generation System Tech-
■ Introduction and Dissemination of New Energy nologies, NEDO is supporting research and development of
and Energy Conservation elemental technologies, which are considered to be mid- or
long-term challenges in order to determine the feasibility of
■ International Projects the technologies. While many foreign companies are actively
participating in the PV market, NEDO's aim is to maintain
One of the dominant priorities, besides the future increase Japan's competitiveness in PV technology development and
in PV production, is obviously the cost reduction of solar cells strengthen its industrial structure. To achieve these goals,](https://image.slidesharecdn.com/pvindustrystatusreport2009-110903042424-phpapp02/85/Pv-industry-status-report-2009-27-320.jpg)
![PV Status Report 2009 | 29
output variations in general, electric double-layered International Co-operative Demonstration Project for
capacitors rapidly respond to instantaneous voltage Stabalised and Advanced Grid-connected PV Systems
variations, are easily serviceable, and have less environ- FY2005 – FY2009
mental impact when disposed of.
Other points to be verified in this project include failure In order to prepare for the future large-scale introduction of
response technology to be applied during power system renewable energy solutions like photovoltaic (PV) power
failures or other incidents, as well as other space- and generation systems, technologies that enable a stable supply
equipment-saving measures required when system of electric power with minimum voltage and frequency varia-
capacity increases significantly. tions, even when operated independently from power grids,
The site for this demonstrative project is the Xining are required for renewable energy microgrids built near energy
National Economic and Technological Development Area demand sites. In this project, experimental development will
in Xining City, Qinghai Province, China. be carried out to address such technical challenges in order
to allow these microgrids to produce a stable supply
■ Development of Design Support Tools for Photovoltaic of electric power.
Power Generation Systems
FY2006 - FY2009
By utilising the data and knowledge obtained through
NEDO’s international co-operative demonstration
projects, including those related to Photovoltaic power
generation systems, highly reliable design support tools 3. 4 Japanese Market Situation
will be developed reflecting the field results in order
to improve the accuracy and accelerate design efforts Japanese Photovoltaic production has rapidly increased
regarding the capacity, output, and economic efficiency following the development of roof-type technologies and the
of Photovoltaic power generation systems. introduction of the subsidy system “Programme for the De-
velopment of Infrastructure for the Introduction of Residential
■ Support Project to Improve Maintenance Skills for PV Systems” in 1997. After the end of the Residential Mar-
Application to Photovoltaic Power Generation Systems ket Implementation Programme which was widely received
FY2006 - FY2009 as a slowing political support, the Japanese market has
In order to further raise the technological knowledge decreased from about 290 MW in 2005 to 210 MW in 2007
level and to popularise the use of reusable energies and recovered slightly with 230 MW in 2008. The total cumu-
through the use of technologies such as Photovoltaic lative installed capacity in 2008 was 2.15 GW, less then half
generation systems, it is necessary to obtain sufficient of the original 4.8 GW goal for 2010 [Ohi 2009, Epi 2009].
knowledge of the methods and techniques to enable
the efficient use, maintenance and management of the After 30 years of PV development under the different NEDO
systems. Presently, however, education and training programmes, 11 Japanese PV manufacturing companies
systems to systematically provide information on reusable have produced solar cells in 2008 [Ikk 2009] and approx.
energies are not widely available in most Asian countries. 17% (1220 MWp) of the solar cells world-wide. Despite an
To address this situation, NEDO, using results and overall Japanese production growth of more than 30% from
knowledge obtained through international co-operative 2007 to 2008, Japanese manufacturers lost overall market
demonstration projects, will help other Asian countries shares due to the doubling of world-wide production.
implement education and training for selected engineer-
ing managers. These individuals will then become master All Japanese solar cell manufacturers have announced mas-
trainers in their home countries. NEDO will prepare sive increases of production capacities for 2010 onwards,
textbooks and training curriculum for the participating signalling the expectations for a continuation of the high
countries, and implement education and training cours- growth rates of the world market. If the announced capacity
es to be delivered by the master trainers to trainers and increases are realised, production capacity in Japan would
students in their own countries. increase from 1.5 GW in 2007 to 4.5 GW in 2010 and close
The School of Renewable Energy Technology (SERT) at to 7 GW in 2012.
Naresuan University in Thailand serves as the centre
for this project. SERT was chosen in part because of A new investment subsidy system was introduced by METI
its efforts to develop renewable energy education and started in January 2009 under a supplementary budget
programmes, including a curriculum on Photovoltaic for FY 2008 and a volume of ¥ 9 billion (€ 69 million).
power generation systems. For FY 2009 the programme has a budget volume of](https://image.slidesharecdn.com/pvindustrystatusreport2009-110903042424-phpapp02/85/Pv-industry-status-report-2009-31-320.jpg)
![30 | PV Status Report 2009
¥ 20.05 billion (€ 154 million). The new subsidy is It is interesting to note that the number of real roof integrated
70,000 ¥/kWp (€ 540) and will be available for systems houses is rather small, despite the fact that such solutions
smaller than 10 kWp, and only if the system costs are below are readily available. One of the reasons for this is that peo-
700,000 ¥/kWp. The allocated budget for the last months ple investing in PV systems want to “exhibit” them in order
of FY2008 (January – March 2009) and FY2009 would allow to show their environmental consciousness and lifestyle.
the installation of more than 100,000 systems, or 400 MW.
In June 2006 the Japanese Photovoltaic Energy Association
METI started to review the Renewable Portfolio Standard published its vision on the “Future of the Photovoltaics
(RPS) Law in order to prepare the introduction of a new Industry in Japan” in response to METI's “New National
PV power purchase programme. The new law was enacted Energy Strategy” in June 2006 [Ikk 2006]. This vision paper
on 1 July 2009 and sets a fixed price for the purchase of was a revision of the 2002 version, taking into account the
"excess" electricity from eligible PV systems at a higher rate significant increase of the world PV market, as well as soar-
then the current residential electricity price of ∼24¥/kWh ing crude oil and energy prices. The figures given in this vi-
(details see Chapter 3.1). It is planned to start with this sion for the expected domestic market of 1.18 GW for 2010
programme at the end of FY2009 and the purchase price were still in view of the cumulative installed capacity target
of 48¥/kWh for residential systems smaller then 10 kWp of 4.8 GW for 2010 and 100 GW in 2030.
should allow a pay-back period of approximately 10 years.
The draft of the new RPS law sets a target of 3.89 TWh for This 2030 Roadmap has been reviewed and the new
electricity generated by PV systems under the new power PV2030+ version has extended the time horizon from 2030
purchase programme in 2014. to 2050. The new motto is “making PV power generation
one of the key technologies, which plays a significant role in
In addition to the National Government, Local Government reducing CO2 emissions by 2050, so that it can contribute
and Utilities have announced plans as well. The Tokyo Metro- not only to Japan but also to the global society”.
politan Government implemented a plan to install 1 GW
within the next 10 years and supports the installation of In PV2030+, the Japanese domestic market for 2010 is
residential PV systems with an additional 100,000 ¥/kWp estimated between 0.5 and 1 GW and the predictions for
in FY 2009 and FY2010. Other prefectures and cities have 2020 and 2030 are equally moderate with 2 to 3 GW in
also announced implementation plans and are offering 2020 and 6 to 12 GW in 2030. PV2030+ assumes that
additional investment incentives as well. Japan can supply approximately one-third of the required
overseas market volumes (Table 2).
So far, the majority of PV systems were installed on residen-
tial houses. At the end of FY 2008, about 1.75 GWp, out of In an interview with Photon International during the PV Japan
the total 2.15 GWp installed, were on residential buildings. 2008 Fair in Tokyo (30 July – 1 August 2008), Junichi Honda,
10000
Fig. 8: Sunshine Target and current trends
Cumulative Installed Capacity [MWp]
Sunshine Target
4.8 GWp
1000
100
Installed Capacity by 2010
if growth rates do not increase
< 3 GWp
10
Growth Rate Required
for Sunshine Target
37%
1
1994
1995
1996
1997
1998
1999
2000
2001
2002
2003
2004
2005
2006
2007
2008
2009
2010](https://image.slidesharecdn.com/pvindustrystatusreport2009-110903042424-phpapp02/85/Pv-industry-status-report-2009-32-320.jpg)
![PV Status Report 2009 | 31
Manager of the Japan Photovoltaic Energy Association Olomouc, Czech Republic, where the capacity was increased
(JPEA), expressed his view that in his opinion the domestic to 30 MW in 2008. In FY2008 the total production capac-
market should be in the range of 35 to 40% of the Japanese ity was expanded to 70 MWp/year. A further expansion to
actual production. This would be close to JPEA's 2006 vision 150 MW in 2010 and to 1 GW in 2015 was announced early
figures and it has to be seen if the market stimulus by a 2009 [Kan 2009]. In FY 2008 production was 52 MW [Pvn
new residential PV programme is sufficient to realise it. But 2009].
even if the new programme is approved, the capacity of all
installed PV systems in Japan will be in the range of 3 GW 3.5.2 Kyocera Corporation
in 2010 (Fig. 8). This is in line with the PV2030+ assump- In 1975 Kyocera began with research on solar cells. The Shiga
tion that Japan could provide about 35% of the production Yohkaichi Factory was established in 1980 and R&D and
required by overseas markets. manufacturing of solar cells and products started with mass
production of multicrystalline silicon solar cells in 1982. In
A special condition of the Japanese PV industry is the fact 1993 Kyocera achieved a 19.5 % world record efficiency with
that most of the production capacities are limited to a few single-crystal silicon solar cells (10 cm2). In the same year
large companies, which bundle the whole, or at least large Kyocera started as the first Japanese company to sell home
portions, of the PV value chain inside their own company, PV generation systems.
i.e. the solar cell, module, BOS components and sometimes
even the installation and maintenance of the PV systems, In 2008, Kyocera had a production of 290 MW and is also
are offered from the same company. This development is marketing systems that both generate electricity through
fostered by the special situation of the Japanese construc- solar cells and exploit heat from the sun for other purposes,
tion market. The average lifetime of a residential home is such as heating water. The Sakura Factory, Chiba Prefecture,
25 to 35 years and corresponds well with the lifetime of is involved in everything from R&D and system planning
solar modules. A lot of houses are either prefabricated or to construction and servicing and the Shiga factory, Shiga
construction companies use standardised building compo- Prefecture, is active in R&D, as well as the manufacturing of
nents, favourable for the integration of solar modules. This solar cells, modules, equipment parts, and devices, which
advantage was recognised by the solar cell manufacturers exploit heat. Like other Japanese manufacturers, Kyocera
and they have either bought housing or construction compa- is planning to increase its current capacity of 300 MW to
nies, or forged strategic alliances with such companies. 500 MW in 2010 and 650 MW by 2012 [Kyo 2008].
The growing markets in developing countries are of major
interest to the company. Therefore, Kyocera set up a joint
3.5 Solar Companies venture with the Tianjin Yiqing Group (10% share) in Tianjin,
China, to produce PV modules for the local market. The
In the following chapter, most of the market players in Japan factory started operation in October 2003 and the current
are briefly described. This listing does not claim to be com- production of 60 MW is expanded to 240 MW in 2012
plete, especially due to the fact that the availability of infor- [Kyo 2009]. A second module factory with 36 MW production
mation or data for some companies was very fragmentary. capacity in Tijuana, Mexico, started production in December
2004 and the expansion to 150 MW should be finished in
3.5.1 Kaneka Solartech 2010 [Kyo 2009a]. In order to supply the growing European
Kaneka has been involved in the development of amorphous market, Kyocera set up a third module assembly plant in
solar cells for over 25 years. Initially this was aimed at the Kadan, Czech Republic, which started operation in 2005,
consumer electronics market, but overall R&D, as well as with a production capacity of 60 MW annually. The capacity of
business strategy, was changed in 1993 when Kaneka de- this plant is scheduled to be increased to 150 MW by early
cided to move into the power module market for residential 2011 [Kyo 2007]
and industrial applications.
3.5.3 Mitsubishi Electric
Currently Kaneka produces a-Si and amorphous/microcrys- In 1974 research and development of Photovoltaic modules
talline silicon modules for rooftop application and built-in was initiated. In 1976 Mitsubishi Electric established its
roofing types for the Japanese, as well as export markets. space satellite business and 1986 saw the beginning of a
The built-in roofing types were developed for the Japanese public and industrial systems business. One of the largest
housing market in co-operation with Quarter-House and PV systems in Japan was delivered in 1993 to Miyako Island
Kubota and are either shingle type modules or larger roofing in the Okinawa Prefecture (750 kWp). With the start of the
elements. In 2006 the company opened a module factory in NEDO Residential Programme, Mitubishi Electric got involved](https://image.slidesharecdn.com/pvindustrystatusreport2009-110903042424-phpapp02/85/Pv-industry-status-report-2009-33-320.jpg)
![32 | PV Status Report 2009
in the residential PV market in 1996. The Iida factory, Nagano 3.5.5 SANYO Electric Company
Prefecture, was established in 1998 where cells and mod- Sanyo commenced R&D for a-Si solar cells in 1975. 1980
ules were manufactured. Today this plant is used for cell pro- marked the beginning of Sanyo’s a-Si solar cell mass
duction and the modules are manufactured in Nakatsugawa, productions for consumer applications. Ten years later in
Gifu Prefecture, and Nagaokakyo, Kyoto Prefecture. Current 1990 research on the HIT (Heterojunction with Intrinsic Thin
production capacity is 220 MW [Mit 2008] and production Layer) structure was started. In 1992 Dr. Kuwano (former
in 2008 was 148 MW [Pvn 2009]. president of SANYO) installed the first residential PV system
at his private home. Amorphous Silicon modules for power
3.5.4 Mitsubishi Heavy Industries use became available from SANYO in 1993 and in 1997 the
Mitsubishi Heavy Industries (MHI) started their pilot plant mass production of HIT solar cells started. In 2008 Sanyo
production in 2001, because solar energy has attracted in- produced 210 MW solar cells [Pvn 2009]. The company
creasing attention as an environment-friendly form of energy. announced to increase its current production capapcity of
In 2008 MHI produced 40 MW of amorphous silicon solar 340 MW HIT cells to 600 MW by 2010 [San 2009].
cells and it is planned to increase the current production
capacity of 128 MW to 600 MW in 2010. At the end of 2002, Sanyo announced the start of module
production outside Japan. The company now has a HIT PV
The plasma CVD deposition used by MHI allows rapid depo- module production (50 MW/a) at SANYO Energy S.A. de
sition on large size glass and flexible substrates (roll-to-roll). C.V.’s Monterrey, Mexico and it joined Sharp and Kyocera
MHI has stabilised the a-Si single-junction efficiency at 8%, to set up module manufacturing plants in Europe. In 2005
starting with 10% initial efficiency. The degradation process it opened its module manufacturing plant in Dorog, Hungary,
lasts for approximately 3 to 4 months, before the stabilised and the production capacity was increased to 145 MW
efficiency is reached. Long-time outdoor exposure tests in 2008.
performed at JQA showed that the stabilised efficiency does
not change and that the lifetime expectancy can be rated at Sanyo has set a world record for the efficiency of the HIT
20 to 25 years. Mitsubishi is currently working on improving solar cell with 23% under laboratory conditions [San 2009a].
the efficiency to 12% by using a microcrystalline/a-Si struc- The HIT structure offers the possibility to produce double-
ture in the future. Another feature of the Mitsubishi modules sided solar cells, which offer the advantage to collect
is their high voltage. The modules are produced with either scattered light on the rear side of the solar cell and can
50V or 100V and power ratings between 24 and 100Wp. therefore increase the performance by up to 30% compared
to one-sided HIT modules in the case of vertical installation.
Fig. 9: Sanyo’s Solar Ark
(Picture: courtesy of Sanyo)](https://image.slidesharecdn.com/pvindustrystatusreport2009-110903042424-phpapp02/85/Pv-industry-status-report-2009-34-320.jpg)
![PV Status Report 2009 | 33
Sanyo works closely with Daiwa House to promote the HIT PV module “Lumiwall”, integrating light emitting diodes)
power roofing tile. The advantages are the lower weight or non see-through modules. After the announcement that
(50%) compared to a conventional roof tile. Like other big their triple-junction thin-film solar cell, with an increased
Japanese solar companies Sanyo offers the complete PV module efficiency of 10%, would go into mass production
systems manufactured by its own factories. in May 2007 [Sha 2007b], the company announced the
construction of a 1 GW thin-film plant by 2010 [Sha 2007].
Solar Ark Project: The “Solar Ark”, a large scale solar power During the 1st International Photovoltaic Power Generation
generation system (630 kWp) at SANYO's Gifu facility was Expo in Tokyo on 27 February 2008, Sharp announced to
completed in December 2001 and is a symbol of solar increase thin-film production capacity beyond the original
energy well known in the whole of Japan. The Solar Ark was foreseen 1 GW to 6 GW after 2012.
built in the image of an Ark embarking into the 21st century,
powered by solar energy (Fig. 9). Together with Daido Steel and Daido Metal, Sharp developed
a super high-efficiency Compound Solar Cell used for low
The Ark's total length measures 315 metres, with its highest cost solar concentrator modules and tracking systems within
point measuring 37.1 metres, making it the largest single- a NEDO research project. The InGaP/InGaAs/Ge solar cell
structure solar installation in the world. In the meantime, has an efficiency of 36% under 700 X concentration. The
it has become one of the symbols of Photovoltaics. Placed tracking system has a size of 3.8 x 4.8 m2 and the system
underneath the Ark is the “Solar Lab”, a Solar Energy Museum output is 2,922 W. According to a press release from Sep-
opened in 2002. The main activities are: tember 2007, the system is now available [Sha 2007c].
■ Cultivating children’s awareness in Science and Ecology. The company has close collaboration with major Japanese
housing companies and offers complete PV systems with
■ Releasing information from the standpoint of benefiting all components made within the company.
mankind and the environment.
In addition to the solar cell factory at the Katsuragi Plant,
■ Regional contribution, such as support for the develop- Nara Prefecture, Sharp has five module factories and has
ment of Eco-Town. established the Toyama factory to produce silicon. Three of
the module factories are outside Japan, one in Memphis,
■ Creation of new ideas through various activities. Tennessee, USA with 70 MW capacity, one in Wrexham, UK,
with 220 MW capacity and one in Nakornpathom, Thailand.
In November 2008, the company announced to establish a
joint venture with the Italian Enel SpA to build and operate
3.5.6 Sharp Corporation a number of photovoltaic power plants with a total capacity
Sharp started to develop solar cells in 1959 and succeeded of 189 MW by the end of 2012 [Sha 2008]. The companies
in mass-producing them in 1963. Since its products were also signed an MoU to set up a manufacturing plant with an
mounted on “Ume”, Japan's first commercial-use artificial initial capacity of 480 MW in 2010.
satellite, in 1974, Sharp has been the only Japanese maker
to produce silicon solar cells for use in space. Another mile- 3.5.7 Showa Shell Sekiyu:
stone was achieved in 1980, with the release of electronic In 1986 Showa started to import small modules for traffic
calculators equipped with single-crystal solar cells. Sharp signals, and started module production in Japan, co-opera-
aims to become a “Zero Global Warming Impact Company tively with Siemens (now Solar World). The company devel-
by 2010” as the World’s Top Manufacturer of Solar Cells. oped CIS solar cells and completed the construction of the
first factory with 20 MW capacity in October 2006. Commer-
In 2008 Sharp had a production capacity of 855 MWp/year cial production started in FY 2007. In August 2007 the com-
[Sha 2007a] and produced 473 MW [Pvn 2009]. An enhanced pany announced the construction of a second factory with a
production line (15 MW), for new large format thin-film production capacity of 60 MW to be fully operational in 2009
polycrystalline solar cells, went into operation in September [Sho 2007]. In July 2008 the company announced to open a
2005 and was expanded to 160 MW in FY2008. The newly research centre “to strengthen research on CIS solar powered
developed “Thin-Film Crystalline Tandem Cell” consists of cell technology, and to start a collaborative research on mass
an upper amorphous silicon solar cell and a lower crystal- production technology of the solar modules with Ulvac, Inc.”
line thin-film silicon solar cell [Sha 2004]. The thin-films can [Sho 2008]. The aim of this project is to start a new plant
either be manufactured as see-through (illuminating in 2011 with a capacity of 1 GW.](https://image.slidesharecdn.com/pvindustrystatusreport2009-110903042424-phpapp02/85/Pv-industry-status-report-2009-35-320.jpg)
![34 | PV Status Report 2009
3.5.8 Additional Solar Cell Companies vidual solar modules or cells. In addition, Matsushita
is involved in research of CIGS thin-film modules.
■ Clean Venture 21: Clean Venture 21 Corporation was
founded in 2001 as a privately held solar company ■ Sanyo – Eneos Solar Company was established in
and develops spherical Silicon solar cells. In 2006 January 2009 by SANYO Electric Co., Ltd. and Nippon
CV21 opened its first production facility in Kyoto. The Oil Corporation with the aim of producing and commer-
company claims that the cells have 12% efficiency and cialising reliable thin-film PV modules. The new joint
that the costs should be only one fifth of a conventional company will start production and sales at an initial
silicon cell due to the significantly reduced silicon use. scale of 80 MW in Fiscal Year 2010 and gradually
CV21 entered into an exclusive sale agreement with increase its production capacity while reviewing and
FujiPream Corporation in December 2005. According to considering the market needs. The goals for the future
RTS Corporation, the company has a production capac- scope of business are 1GW for annual global production
ity of 12 MW for spherical silicon solar cells [Ikk 2009]. and sales by FY2015 and around 2GW for the annual
global production and sales of thin-film solar
■ Fuji Electric Systems Co. Ltd.: In 1993 Fuji Electric by FY2020.
started its activities in amorphous thin-film technol-
ogy. The company developed amorphous-silicon thin- ■ Space Energy Corporation: The company was estab-
film solar cells in the framework of a NEDO contract. lished in April 1995 under the name Metal Reclaim
The cells, which use a plastic film substrate less than Corporation and produces wafers. In April 2008 the
0.1mm thick, are light, inexpensive to manufacture and company bought Hitachi's bi-facial solar cell and
easily processed into large surface areas. In 2005 Fuji module manufacturing facility and started to set up
announced the construction of a factory with an initial a factory in Nagano with an initial capacity of 3.5 MW
capacity of 12 MW to be expanded to 40 MW in 2009 to be expanded to 8 MW in 2009.
[Fuj 2007].
3.5.9 Kobelco (Kobe Steel)
■ Hitachi: Tokyo-based Hitachi Ltd. had a production In April 1999, Kobe Steel's Engineering Company formed an
capacity for its bi-facial crystalline solar cell of agreement with Germany's Angewandte Solarenergie - ASE
10 MW/a, but sold it to Space Energy Corporation GmbH that enables Kobe Steel to market ASE's (now Schott-
in April 2008. In addition, Hitachi developed a dye- Solar) Photovoltaic systems in Japan. Kobe Steel is focusing
sensitised solar cell with 9.3% efficiency according on selling mid- to large-size systems for industrial and public
to the company. facilities. By 2010, it aims to acquire a 10% share of the
domestic market.
■ Honda Soltec Co. Ltd.: Honda R&D Co. Ltd. developed
a CIGS thin-film module with a power output of 112W. Since the beginning of 2002, Kobelco has been supplying
To commercialise the product, Honda Soltec Co. Ltd Misawa Homes Co., Ltd., with Photovoltaic module systems
was established on 1 December 2006. Since June for its houses. Owing to rising demand, they began manu-
2007, the company is selling 125 W modules produced facturing the modules in November 2001 at the Takasago
by Honda Engineering Co. Ltd. and announced that Works in Hyogo, Japan.
the mass production at the Kumamoto Plant, with an
annual capacity of 27.5 MW, started its production in 3.5.10 MSK Corporation
November 2007 [Hon 2007]. MSK Corporation was founded in 1967 as an import/export
company for electrical parts. Already in 1981 MSK began
■ Kyosemi Corporation was founded in 1980 and is a with sales of solar cells and in 1984 opened a Photovoltaic
research and development-oriented optoelectronic module factory in the Nagano Prefecture. In 1992 they con-
company. The company developed a proprietary spherical cluded a distribution agreement with Solarex (now BP Solar)
solar cell and in 2004 registered the trademark and at the beginning of the Japanese Residential Dissemina-
Sphelar® . tion Programme in 1994, MSK developed the roof material
“Just Roof”, together with Misawa Homes, and started sales
■ Matsushita Ecology Systems: National/Panasonic of residential PV systems.
produces a colourable Photovoltaic cell (PV) and module
especially for commercial use. Applications are building In August 2006, Suntech Power (PRC) announced the first
roofs, wall mountings and glass windows. They design step of its acquisition of MSK. Suntech acquired a two-third
and select the most suitable products, and supply indi- equity interest in MSK for $ 107 million (€ 73.86 million) in](https://image.slidesharecdn.com/pvindustrystatusreport2009-110903042424-phpapp02/85/Pv-industry-status-report-2009-36-320.jpg)
![PV Status Report 2009 | 35
cash [Msk 2006]. The second step to acquire the remaining 3.5.15 PanaHome Corporation
shares was closed in June 2008 [Sun 2008]. PanaHome Corporation was established in 1963 to support
the Matsushita Group’s housing business. On 1 October
3.5.11 YOKASOL 2002, the 28 principal subsidiaries of the PanaHome Group
After the takeover of MSK by Suntech Power, employees of merged to form PanaHome. Designating detached housing,
MSK's Fukuoka Plant bought the plant and set it up as a asset management, and home remodelling are the three
new company named YOKASOL. The company manufactures core businesses of the company. In line with this, Pana-
mono- and polycrystalline silicon modules. Home offers Eco-Life Homes that are “friendly to people and
the environment”. As a part of this initiative, in July 2003
3.5.12 Daiwa House PanaHome launched the sale of energy-conservation homes
Since August 1998, Daiwa House has been selling “Whole- equipped with solar power generation systems and other
Roof Solar Energy System” attached to single-family houses. energy saving features.
This system, which is a unique type that comes already fixed
to the steel roofing material, uses thin-film solar cells made Matsushita Electric Industrial Co., Ltd., has strengthened its
from amorphous materials. capital alliance with Matsushita Electric Works, Ltd., creat-
ing a new comprehensive co-operative framework for the
3.5.13 Misawa Homes Matsushita Group for the 21st century. As a part of this new
In 1990, Misawa Homes Co. Ltd., one of the biggest housing Group framework, PanaHome was turned into a consolidated
companies in Japan, started research activities to utilise PV subsidiary of Matsushita Electric Industrial on 1 April 2004.
as roofing material. In October 1992 they built the first model
of the “Eco Energy House” with a PV roof-top system in the PanaHome is offering environment-friendly Eco-Life Homes to
suburbs of Tokyo. In 2003/4 Misawa Homes built “Hills reduce the volume of CO2 emissions generated in everyday
Garden Kiyota”, a 503-home residential community in Kiyota, living, through the use of a solar power generation system,
Hokkaido. The homes are all equipped with solar Photo- an all-electric system, and the Eco-Life ventilation system.
voltaic systems, with a total electrical generation capacity of
1,500 KW, the world’s largest in terms of electricity gener- 3.5.16 Tokuyama Corporation
ated by a residential development at that time [Mis 2005]. Tokuyama is a chemical company involved in the manu-
facturing of solar-grade silicon, the base material for solar
3.5.14 Sekisui Heim cells. The company is one of the world’s leading polysilicon
Sekisui Heim is a housing division of the Sekisui Chemical manufacturers and produces roughly 16% of the global supply
Company, which was founded in 1947. Sekisui Chemical was of electronics and solar grade silicon. According to the
the first to develop plastic moulds in Japan. In 1971, Sekisui company, Tokuyama had an annual production capacity of
Chemical created the Heim Division to build modular houses. 5,200 tons in 2008 and has expanded this to 8,200 tons
Sekisui Heim, currently the fourth largest house builder in in 2009. In November 2008, a plan to build a 3,000 ton
Japan, builds about 15,000 houses per year, of which about factory in Malaysia was presented. The plant should become
50% are equipped with a solar Photovoltaic system. operational in 2012.
In January 2003 Sekisui introduced the “zero-cost-electricity- A verification plant for the vapour to liquid-deposition process
system” [Jap 2003]. The basic specification of the “utility (VLD method) of Polycrystalline silicon for solar cells has
charges zero dwelling house” are: been completed in December 2005 [Tok 2006]. According to
the company, steady progress has been made with the veri-
1) Use of “creative energy” = solar Photovoltaic electricity fication tests of this process, which allows a more effective
generation system; manufacturing of polycrystalline silicon for solar cells.
2) Utilisation of “energy saving” = heat pump and the build-
ing frame responsive to the next-generation energy saving Tokuyama has decided to form a joint venture with Mitsui
standard; Chemicals, a leading supplier of silane gas [Tok 2008].
3) Management for “effective operation” = the total electri- The reason for this is the increased demand for silane gas
fication by using the electricity in the middle of night. due to the rapid expansion of amorphous/ microcrystalline
thin-film solar cell manufacturing capacities.
In its 2009 Annual Report Sekisui stated that they have
already sold some 67,000 units with Photovoltaic electricity
systems.](https://image.slidesharecdn.com/pvindustrystatusreport2009-110903042424-phpapp02/85/Pv-industry-status-report-2009-37-320.jpg)
![36 | PV Status Report 2009
3.5.17 Additional Silicon Producer completed in May 2007 [Sum 2007]. The second
increase to 1,400 tons/year should be completed in
■ JFE Steel Corporation: JFE Steel began to produce October 2008. In addition, a new plant with 2,200 tons
silicon ingots in 2001. To stabilise their supplies of will be constructed and should become operational
feedstock, it began to investigate techniques for produc- in 2011.
ing SOG silicon in-house from metallic silicon as an
alternative to polysilicon. Prototypes created with 100%
metallic silicon have achieved the same high conversion
efficiency as conventional polysilicon units. According
to RTS the production capacity in 2008 was about
400 tons and it is planned to increase this to 500 to
1000 tons in the future [Ikk 2009].
■ Japan Solar Silicon: JSS was established in June 2008
as a joint venture between Chisso Corporation, Nippon
Mining Holdings (since 1 April 2009 – Nippon Mining
& Metals) and Toho Titanium. Currently the company
operates a pilot plant and plans to start their commer-
cial plant operation with a capacity of 400 tons in the
second half of 2010. An expansion to 3,000 tons is
foreseen to begin in 2010 as well.
■ M.Setek: Manufacturer of semiconductor equipment
and monocrystalline silicon wafers. The company has
two plants in Japan (Sendai, Kouchi) and two in the
PRC, Hebei Lang Fang Songgong Semiconductor Co. Ltd.
(Beijing) and Hebei Ningjin Songgong Semiconductor
Co. Ltd. (Ningjin). In April 2007 polysilicon production
started at the Soma Factory in Fukushima Prefecture.
According to the company, the current production capacity
is 3,000 tons.
■ Mitsubishi Materials Corporation (MMC): The company
was established in 1950 and is one of the world's
largest diversified materials corporations. MMC produces
polysilicon for the semiconductor and Photovoltaic industry.
Current production capacity is about 3,300 tons with a
further expansion underway. The first 1,000 ton phase
should become operational win 2010 with further ramp
up to 2,800 tons possible. About 1,500 tons of polysili-
con are produced by their affiliates Mitsubishi Polycrys-
talline Silicon Corp. and Mitsubishi Polycrystalline Silicon
America Corp.
■ NS Solar Material Co., Ltd.: This is a joint venture
between Nippon Steel Materials and Sharp Corporation
and was established in June 2006. Production was
planned with 480 tons/year and start of operation
was scheduled for October 2007.
■ OSAKA Titanium Technologies Co. Ltd. is a manu-
facturer of Titanium and Silicon. The first step of the
capacity increase from 900 tons to 1,300 tons was](https://image.slidesharecdn.com/pvindustrystatusreport2009-110903042424-phpapp02/85/Pv-industry-status-report-2009-38-320.jpg)
![PV Status Report 2009 | 37
4. People’s
Republic of China The production of solar cells and the announcements of
planned new production capacities in the People’s Republic
of China have sky-rocketed since 2001. Production rose from
just 3 MW in 2001 to 1070 MW in 2007 and for 2008 the
estimates vary between 2.3 and 2.9 GW. For 2009, capacity
increases to 8.9 GW have been announced, whereas the
figure stands at 12.3 GW for 2010. In parallel, China is
aiming to build up its own polysilicon production capacity.
The numbers given for 2007 production capacity vary quite
significantly from 1,225 [Pvn 2008] to 4,550 [Cui 2007] and
8,900 [Yol 2008]. The same is true for the 2010 figures:
29,050 [Pvn 2008] to 84,500 [Cui 2007]. However, despite
the discrepancies, it is clear that there is a strong drive for
building up its own silicon feedstock supply industry. This
development has to be seen in the light of the PRC’s strat-
egy to diversify its energy supply system and overcome the
existing energy shortage.
Why is this of particular interest? During the China Develop-
ment Forum 2003, it was highlighted that China’s primary
energy demand will reach 2.3 billion toe in 2020 or 253%
of the 2000 consumption if business-as-usual (BAU) occurs
[Fuq 2003]. Under such a scenario the electricity demand
would be 4,200 TWh by 2020 (Fig. 10).
This development presents a reason to press for additional
Government policies supporting the introduction of energy
efficiency measures and renewable energy sources. With the
proposed measures, fossil energy demand would still grow,
though considerably slower than in the case of BAU.
Fig. 10: Scenarios of PRC’s fossil energy 2,4
ademand up until 2020 for different scenarios
[Fuq 2003] BAU
2,2
Energy Savings Industry
Energy Savings Transport
2
Energy Savings Buildings
Renewable Energies
1,8
billion toe
1,6
1,4
1,2
1
0,8
2000 2005 2010 2015 2020](https://image.slidesharecdn.com/pvindustrystatusreport2009-110903042424-phpapp02/85/Pv-industry-status-report-2009-39-320.jpg)
![38 | PV Status Report 2009
The Standing Committee of the National People’s Congress Development and Reform Commission, this is not sufficient
of China endorsed the Renewable Energy Law on 28 February for Chinese companies to be profitable yet.
2005. At the same time as the law was passed, the Chinese
Government set a target for renewable energy to contribute At the moment, the companies need between 1.3 and 1.5
10% of the country’s gross energy consumption by 2020, RMB/kWh (0.134 and 0.155 €/kWh) to become profitable.
a huge increase from the current 1%. The Renewable Energy Therefore, the Institute is calling on the Government to
Law went into effect on 1 January 2006, but no specific adjust the prices to accelerate the domestic market growth.
rate was set for electricity from Photovoltaic installations. When the electricity generation cost with solar PV systems
The 2006 Report on the Development of the Photovoltaic declines to some 1 RMB/kWh (0.103 €/kWh) in 2010/11,
Industry in China, by the National Development and Reform this will be within the cost price of routine power generation.
Commission (NDRC), the Global Environment Facility (GEF)
and World Bank (WB), estimates a market of 130 MW in In 21 July 2009 a joint notice was release by the Ministry
2010 [NDR 2006]. The report states that the imbalance of Finance, Ministry of Science and Technology and the
between solar cell production and domestic market develop- National Energy Administration announcing subsidies for PV
ment impedes not only the sustainable development of energy demonstration projects in the following two to three years
sources in China, but also the healthy development of the PV through a programme called “Golden Sun”. The Government
industry. will subsidize 50% of total investment in PV power genera-
tion systems and power transmission facilities in on-grid
In the National Outlines for Medium and Long-term Planning projects, and 70% for independent projects, according to the
for Scientific and Technological Development (2006-2020), notice. The available budget should allow about 500 MW of
solar energy is listed as a priority theme. PV installations.
New and renewable energy technologies: to develop low- A new plan to foster the development of “new energy”
cost, large-scale renewable energy development and utilisa- sources, including wind, solar and nuclear is expected to be
tion technologies, large-scale wind power generation equip- published by the end of this year. According to statements
ment; to develop technology of Photovoltaic cells with high of senior Government officials published in various Chinese
cost-effect ratio and its utilisation; to develop solar power media, investment in new energy under this Energy Revitali-
generation technology and study integration of solar powered zation Plan will reach more than RMB 3 trillion (€ 309 billion)
buildings; to develop technologies of fuel cells, hydropower, and investments in smart-grids will exceed RMB 4 trillion
biomass energy, hydrogen energy, geothermal energy, ocean (€ 436 billion) by the next decade.
energy, biogas, etc.
Also the National Medium-and-Long Term Renewable Energy
Development Plan has listed solar Photovoltaic power gen- 4.1 PV Resources and Utilisation
eration as an important developing point. Within the National
Basic Research Programme of China, the so-called 973 The PRC’s continental solar power potential is estimated at
Programme, there is an additional topic on “Basic research 1,680 billion toe (equivalent to 19,536,000 TWh) per year
of mass hydrogen production using solar energy”. [CDF 2003]. One percent of China’s continental area, with
15% transformation efficiency, could supply 29,304 TWh
With the support from national ministries and commissions, of solar energy. That is 189% of the world-wide electricity
the top efficiency of China's current lab PV cell is 21%, consumption in 2001.
commercialised PV components and normal commercialised
cells respectively have an efficiency of 14 – 15% and 10 The Standing Committee of the National People’s Congress
– 13%. China has reduced the production cost of solar PV of China endorsed the Renewable Energy Law on 28 February
cells and the price of solar cells has gradually declined from 2005. Although the Renewable Energy Law went into effect
the 40 RMB/Wp (4.40 €/Wp)9 in 2000. In July 2009, the on 1 January 2006, the impact on Photovoltaic installations
National Energy Administration (NEA) has set a subsidised in China is however still limited, due to the fact that no tariff
price for solar power at 1.09 RMB/kWh (0.112 €/kWh)10. has yet been set for PV. The main features of the Law are
It should be noted, that so far this is for a single project in listed below:
Gansu, Dunhuang and serves as a reference. However, accord-
ing to the Energy Research Institute under the National ■ Energy Authorities of the State Council are responsible
9
Exchange rate 2003: 1 RMB = 0.11 €
for implementing and managing renewable energy devel-
10
Exchange rate 2009: 1 RMB = 0.103 € opment, including resource surveys;](https://image.slidesharecdn.com/pvindustrystatusreport2009-110903042424-phpapp02/85/Pv-industry-status-report-2009-40-320.jpg)
![PV Status Report 2009 | 39
■ The Government budget establishes a renewable energy de- China Renewable Energy Industry Association, Greenpeace
velopment fund to support R&D and resource assessment; China, European PV Industry Association, and WWF, reduced
the market predictions to 300 MW cumulative installed
■ The Government encourages and supports various types capacity in 2010 [Chi 2007]. For 2020, two scenarios are
of grid-connected renewable energy power generation; given. The low target scenario predicts 1.8 GW, in line with
the old Government policy, whereas a high target of 10 GW
■ Grid enterprises shall purchase the power produced would be possible if strong support mechanisms were to be
with renewable energy within the coverage of their power introduced.
grid, and provide grid-connection service;
In May 2009, SEMI's PV Group published a White Paper
■ The grid-connection price of renewable energy power entitled “China's Solar Future” [Sem 2009a]. China faces
generation shall be determined by the price authorities, a rapidly increasing demand for energy, and the country is
and the excess shall be shared in the power selling building a massive PV industry, representing all facets of the
price within the coverage of the grid; supply chain, from polysilicon feedstock, ingots and wafers
to cells and modules. The report recommends an acceler-
■ The Law became effective in January 2006. ated adoption of PV generated electric power in China to
reach global average level of PV power generation by 2014.
During the China Renewable Energy Development Strategy The main policy recommendations of the report are:
Workshop 2005, Wang Sicheng, from the National Develop-
ment and Reform Commission's Energy Institute, presented ■ Establish clear targets for PV installation. Adjust current
the “Strategic Status of Photovoltaics in China” [Sic 2005]. national targets and achieve global average level by the
The national target for the accumulated capacity of PV sys- year 2014, including adjustment of the 2010 target from
tems set in the »Eleventh Five-Year Plan« (2006 – 2010) was 300MW to 745MW and the 2020 target from 1.8GW to 28GW.
500 MW in 2010. The predictions of the PV Market in China
for 2020 were rather optimistic. The accumulated installed ■ Enact clear and easy-to-administer PV incentive policies
capacity was given as 30 GW and included 12 GW in the that are suitable for China’s unique situations, using
frame of the Chinese Large-Scale PV Development Plan, a both market and legal mechanisms to encourage private
project which was scheduled to start in 2010. However, due investment in PV.
to the fact that at that time this plan did not receive official
consideration the actual growth of PV installations was far ■ Maintain the current rural electrification effort but prior-
below the required figures. ity should be given to grid-connected large scale power
plants and building integrated systems.
Therefore, the 2007 China Solar PV Report authored by the
100000
Fig. 11: Cumulative installed Photovoltaic New 20 GWp Goal in 2020
capacities in PRC, the old and new targets
Cumulative instaleed PV capacity [MWp]
for 2010/11 and 2020 and the needed 29%
annual growth rates. 10000
1000
25.5%
42% 52%
100
10
1
2000 2005 2010 2015 2020](https://image.slidesharecdn.com/pvindustrystatusreport2009-110903042424-phpapp02/85/Pv-industry-status-report-2009-41-320.jpg)
![40 | PV Status Report 2009
■ Immediately implement a Government financed direct support the use of renewable energies in buildings on 21
investment subsidy model at central and local levels, July 2009.
and effectively implement feed-in tariff programmes
stipulated in the Renewable Energy Law. In April 2009, JLM Pacific Epoch reported that according to
China Business News the Jiangsu Province plans to release
The White Paper also points out that despite the economic a new plan to promote solar power applications soon [Jlm
and social benefits of increasing solar power demand, 2009]. According to the plan, Jiangsu intends to reach
China’s lack of PV demand might threaten Government solar building and rooftop installations of 10MW in 2009; 50MW
incentives in other countries. Policy-makers in Europe, US including 40MW of rooftop projects in 2010; and 200MW
and elsewhere may view China as the primary beneficiary including 180MW of rooftop projects in 2011. The plan also
of domestic economic policies that encourage PV demand, mentions the possibility of establishing funds to provide
while China itself is not contributing to global fossil fuel project construction subsidies and risk guarantees, an ex-
reduction. ecutive of Jiangsu's PV Industry Association stated. The plan
stipulates further allocations of quotas to local companies.
On 1 November 2006 a new law on energy-efficient construc-
tion, in order to promote the use of solar power to supply hot A number of large scale Photovoltaic projects, ranging up to
water and generate electricity, took effect in the city of Shen- 1 GW were announced in the course of the last 18 months
zhen18. Projects which are unable to use solar power will in China. How many of them will actually be realised to cre-
require special permission from the Government otherwise ate a local market for solar Photovoltaic electricity systems,
they cannot be put on the market. By 2010, the Shenzhen still has to be seen.
Construction Bureau expects that 50% of the new buildings
will install solar water heating systems and 20% of new With all these measures a doubling or even tripling of the
buildings will use Photovoltaic electricity generation systems. market seems possible in 2009, as a starting point for the
development of a GW size market from 2012 on. China is
China’s RMB 4 trillion stimulus package included RMB 210 now aiming for 2 GW total installed solar capacity in 2011.
billion (€ 21.6 billion) for green energy programmes as In July 2009 the new Chinese energy stimulus plan revised
announced in early March 2009. On 23 March 2009 the the 2020 targets for installed solar capacity to 20 GW
Chinese Ministry of Finance and Ministry of Housing and (Fig. 11).
Urban-Rural Development [Mof 2009] announced a solar
subsidy programme which immediately went into effect. It
was suggested that 70% of the budget would be handled
by the Provincial Finance Ministries. For 2009 the subsidy 4.2 Solar Companies
will be 20 RMB/Wp (2.06 €/Wp) for BIPV and 15 RMB/Wp
(1.46 €/Wp) for roof top applications . The document neither In the following chapter, some of the major market players in
mentions a cap on individual installations nor a cap for the the PRC are briefly described. This listing is far from being
total market. The subsidy will be paid as a 70% down pay- complete, due to the fact that more than 50 solar cell and
ment and 30% after the final acceptance of the project. more than 300 solar module companies exist in China. In
addition, availability of information or data for some compa-
Eligible are all systems >50kW which have module efficien- nies is very fragmentary.
cies of >14% (polycrystalline modules), >16% (monocrystal-
line modules), or >6% (thin-film). Applications for grants 4.2.1 Canadian Solar Inc.
apparently have to be made from 15 May to 30 August. Canadian Solar Inc. was founded in Canada in 2001 and
However, public comments from an official of the National was listed on NASDAQ in November 2006. CSI has estab-
Development and Reform Commission (NDR) indicate that lished six wholly-owned manufacturing subsidiaries in China,
issues like grid connection are not yet discussed sufficiently. manufacturing ingot /wafer (planned production in mid
One of the reasons is that none of the Ministries which 2008), solar cells and solar modules. According to the com-
announced the subsidy has jurisdiction over the grid. pany it achieved 120-150 MW of ingot and wafer capacity
and 270 MW of cell capacity in 2008. For 2008 the com-
In addition to the solar subsidy programme which was an- pany reported shipments of 167.5 MW.
nounced on 23 March 2009 by the Chinese Ministry of
Finance and Ministry of Housing and Urban-Rural Develop- 4.2.2 Changzhou EGing Photovoltaic Technology Co. Ltd.
ment [Mof 2009], Mof announced another support pro- The company was founded in 2003 and works along the
gramme – the Golden Sun Programme – for pilot cities to complete Photovoltaic industry value chain, from the produc-](https://image.slidesharecdn.com/pvindustrystatusreport2009-110903042424-phpapp02/85/Pv-industry-status-report-2009-42-320.jpg)
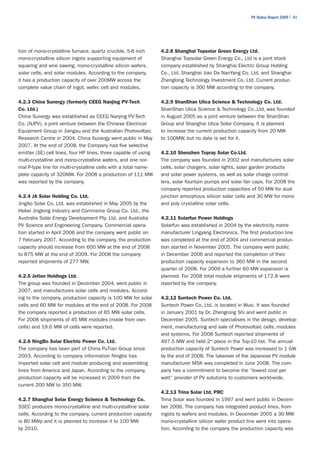
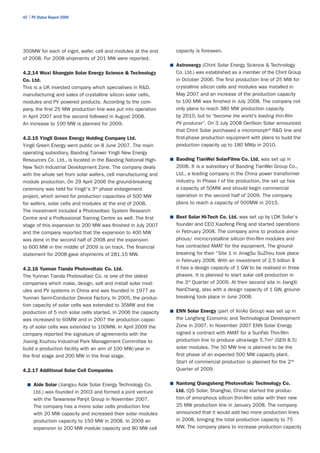
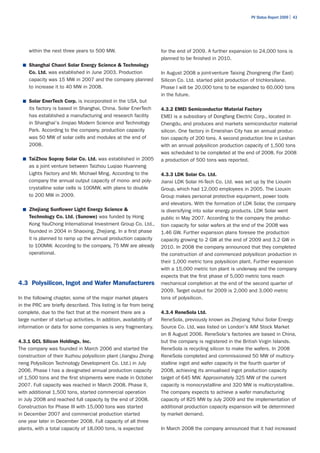
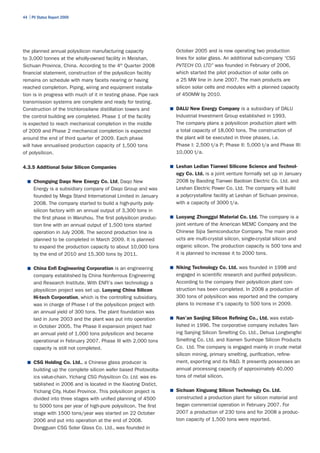
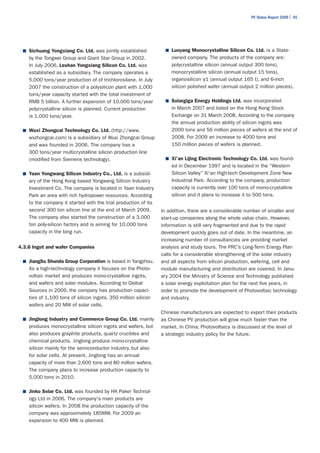

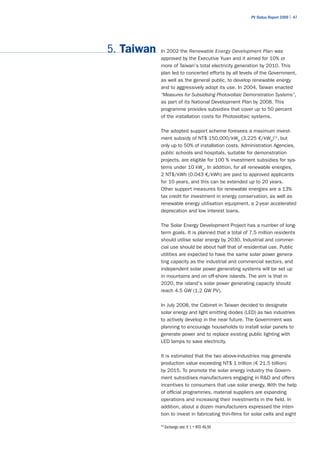
![48 | PV Status Report 2009
of them will set up their own plants to process the products. 5.1 Solar Companies
The solar energy industry may see its output reach NT$ 450
billion (€ 9.68 billion) by 2015. In the following chapter, some of the market players in Taiwan
are briefly described. This listing does not claim to be
The Industrial Technology Research Institute (ITRI), a Govern- complete, especially due to the fact that the availability of
ment-backed research organisation, has drawn up an R&D information or data for some companies was fragmentary.
Strategy for Taiwan with the aim to lower module costs to
around 1 $/Wp between 2015 and 2020. The research 5.1.1 DelSolar Co. Ltd.
topics identified range from efficiency increase in the various DelSolar was established as a subsidiary of Delta Electron-
wafer based and thin-film solar cells to concentrator concepts ics in 2004 and went public in November 2007. DelSolar
and novel devices. Despite the fact that the national R&D has a strategic co-operation with the Industrial Technology
budget should be doubled within the next four years, it is Research Institute (ITRI), and had a production capacity
visible that the main focus is on the industry support to of 120 MW at the end of 2008 and produced 71.5 MW in
increase production capacities and improved manufacturing 2008 [Pvn 2009]. The company has plans to expand the
technologies. production capacity to 840 MW by 2012.
The Executive Yuan (the Cabinet) passed the “Programme 5.1.2 E-TON Solartech Co. Ltd.
for Coping with Economic Slowdown and Bolstering the Econ- E-Ton Solartech was founded in 2001 and produced 95 MW
omy” on 11 September 2008. The package covers a total in 2008 [Pvn 2009]. At the end of 2008 the production
of 41 measures and includes the promotion of solar energy. capacity was 320 MW per annum and a capacity increase
For 2008 and 2009, the Government set aside NT$ 1 billion to 630 MW should be realised at the end of 2010.
(€ 21.5 million) for subsidies to consumers who buy solar-
power systems. The Government plans to subsidise half of 5.1.3 Gintech Energy Corporation
the installation cost for solar devices, and households which Gintech was established in August 2005 and went public in
install solar Photovoltaic electricity systems would be offered December 2006. In 2008 the company increased its produc-
a favourable electricity rate of 2.1 NT$/kWh (0.045 €/kWh). tion capacity to 560 MW and had a production of 180 MW
For 2010 a National Target to double the cumulative capacity [Pvn 2009]. The company plans to expand capacity to
installations to 31 MW was set. 660 MW at the end of 2009 and to 1.5 GW by 2012.
On 12 June 2009, the Legislative Yuan gave its final approval 5.1.4 Motech Solar
to the Renewable Energy Development Act, a move that is Motech Solar is a wholly-owned subsidiary of Motech Indus-
expected to bolster the development of Taiwan’s green tries Inc., located in the Tainan Science Industrial Park. The
energy industry. The new law authorises the Government to company started its mass production of polycrystalline solar
enhance incentives for the development of renewable energy cells at the end of 2000 with an annual production capacity
via a variety of methods, including the acquisition mecha- of 3.5 MW. The production increased from 3.5 MW in 2001
nism, incentives for demonstration projects and the loosen- to 272 MW in 2008. With this output, Motec Solar was No. 8
ing of regulatory restrictions. The goal is to increase Taiwan’s of the Top-10 list for 2008. Production capacity should reach
renewable energy generation capacity by 6.5 GW to a total of 600 MW at the end of 2009. In August 2007, Motech So-
10 GW within 20 years. lar's Research and Development Department was upgraded
to Research and Development Centre (R&D Centre), with the
According to Tsai Chin-Yao, Chairman of the Photovoltaic aim not only to improve the present production processes
Committee, the law will attract investment of at least NT$ 30 for wafer and cell production, but to develop next generation
billion (€ 645 million) per year, create at least 10,000 jobs solar cell technologies [Mot 2007].
and generate output value of NT$ 100 billion within two
years. Tsai recommended setting a price floor of 8 NT$/kWh 5.1.5 Neo Solar Power Corporation
(0.172 €/kWh) for green energy, as this would give firms a The company was founded in 2005 by PowerChip Semicon-
reasonable profit margin. ductor, Taiwan's largest DRAM company, and went public in
October 2007. The current production capacity of silicon
solar cells is 210 MW and a further expansion to 700 MW
is already underway. In 2008 the company had shipments of
102 MW [Pvn 2009].](https://image.slidesharecdn.com/pvindustrystatusreport2009-110903042424-phpapp02/85/Pv-industry-status-report-2009-50-320.jpg)
![PV Status Report 2009 | 49
5.1.6 Additional Taiwanese Companies ■ Green Energy Technology (GET) was founded as a sub-
sidiary of the Tatung Group of companies in Taiwan and
■ Auria Solar Co. was founded in October 2007 as a went public in 2008. GET's Initial capacity in May 2005
joint venture between E-Ton Solar, Lite-On Technology was 25 – 30 MW wafers with 13 furnaces, band saws,
Corp, Hermes-Epitek Corp. and MiTAC-SYNNEX Group and wire saws. An additional 7 furnaces were installed
to manufacture thin-film solar cells. The company has in July 2006, boosting annual capacity to 40 – 50 MW.
chosen Oerlikon as equipment supplier and plans to In 2008, GET has expanded to 80 furnaces and has
produce amorphous/micromorph silicon thin-films. now an annual capacity of up to 200 MW wafer produc-
The first factory will have a capacity of 60 MW and tion. The company purchased a fully-integrated thin-film
pilot production started at the end of 2008. Further solar cell production line with a nominal rated capacity
expansion plans aim for 500 MW in 2012. of 50 MW from Applied Materials and started mass
production in December 2008. Full capacity is expected
■ BeyondPV Co. Ltd's main shareholder is optical film to be reached in the 4th Quarter 2009.
maker Efun Technology and plans to produce amorphous/
microcrystalline silicon thin-film modules. The company ■ Higher Way Electronic Co. Ltd. is an IC application
is expected to complete their equipment installation design company established in 1991, which manufac-
in the fourth quarter of 2008, and annual capacity will tures GaAs and silicon solar cells. The focus is mainly
reach 40MWp by 2010, to be ramped up to 80MWp by on consumer products.
2011, and 350MWp by 2014, according to the parent
company. ■ Jenn Feng Co.,Ltd. was incorporated in 1975. The
company plans and installs solar systems. They plan to
■ Big Sun Energy Technology Incorporation was founded start a CIGS thin-film production with 12 MW in 2009.
in 2006 and started its solar cell production in the 3rd
Quarter of 2007 [Dig 2007]. According to the company ■ Kenmos Photovoltaic was founded as a joint venture
the production capacity in 2007 was 30 MW and in- of Kenmos Technology Co. Ltd., NanoPV Corporation
creased to 90 MW. and a Taiwanese equipment manufacturer in September
2007. Kenmos PV set up a 10 MW amorphous silicon
■ Chi Mei Energy Corp. is a subsidiary of Chi Mei Opto- thin-film production capacity and started mass produc-
electronics (CMO), a world leader in the production of tion in February 2009. The capacity will be expanded
TFT-LCD (Thin-film Transistor Liquid Crystal Display ) to 30 MW in 2009.
panels for a wide range of application. Chi Mei Energy
was established in January 2008 and completed its ■ Millennium Communication Co. Ltd. manufacures III–V
equipment installation in Q4, 2008. The start of mass compound material solar cells like GaAs, InGaP single
production was Q1, 2009 with 50MW annual capacity. junction and GaAs/InGaP tandem solar cells with up
After 2009, Chi Mei Energy plans an aggressive capac- to 25% efficiency.
ity expansion to the GW scale.
■ Mosel Vitelic Inc.: The Group's principal activities are
■ Ever Energy Co. Ltd. was established in October 2005 the design, research, development, manufacturing and
by a group of investors. In early 2007, Ever Energy sale of integrated circuits and related spare parts. As
signed a contract with Centrotherm AG, Germany, to part of a five-year transformation project, the company
purchase equipment with 90MW capacity for the initial moved into the solar cell business in 2006. According
phase of a 180MW facility. In October 2007 the com- to the company, current production capacity is 60 MW.
pany started to build the factory. The ground-breaking for a further expansion with 200 MW
capacity took place in May 2008. Mosel also plans
■ Formosun Technology Corporation was established in to develop thin-film solar cell production from its own
2005 as a trading company of solar cell materials and technology and to expand production capacity to
products. In 2006 they decided to start the production 1.5 GW by 2014.
of amorphous silicon thin-film modules with produc-
tion equipment from EPV (NJ), USA. According to the ■ Nexpower Technology Corporation was formed by
company, series production started in May 2008 and it United Microelectronics Corporation (UMC) in 2005.
is planned to double the capacity to 12 MW in 2009. UMC is one of the world-wide IC foundry providers.](https://image.slidesharecdn.com/pvindustrystatusreport2009-110903042424-phpapp02/85/Pv-industry-status-report-2009-51-320.jpg)
![50 | PV Status Report 2009
In addition to crystalline silicon solar cells, Nexpower ■ United Printed Circuit Board (UPCB) started the
is dedicated to silicon thin-film Photovoltaics technol- construction of its first solar cell factory at the high-tech
ogy and commercial applications, by building up a industrial park in Yilan County of Eastern Taiwan in
new manufacturing facility in Hsin Chu, Taiwan with August 2007. The first stage is a 30 MW multi-crystal-
an annual production capacity of 25MW in 2008. The line silicon line from Centrotherm, Germany. According
company contracted ULVAC, Japan, for the production to the company, production will increase from the
equipment [Ulv 2007]. According to the company they current 30 MW to 80 MW in 2009, 180 MW in 2010
have a production capacity of 100 MW. and 270 MW in 2011.
■ Powercom Co. Ltd. was founded in 1987, as a provider
of power protection products. In 2007 the company
installed a 30MW silicon solar cell production line.
A future capacity increase to 90MW is planned.
■ Solartech Energy Corp. (Solartech) was founded in
June 2005. Solartech expanded its production capacity
from 60 MW to 180 MW in 2008. Further expansion
plans aim at a capacity beyond 1 GW per year by 2014.
■ Sunner Solar Corporation was founded in Taoyuan,
Taiwan in June 2007. The company started their pilot
production in March 2009 and plan to start mass pro-
duction of thin-film amorphous silicon modules in the
second half of 2009 with 25 MW capacity. The company
then plans to expand to 200 MW by 2010.
■ Sunwell Solar Corporation, a subsidiary of CMC Mag-
netics Corporation, Taiwan's top compact disc maker,
contracted a 45 MW thin-film PV production plant with
Oerlikon Solar. The plant started production at the
beginning of September 2008. According to Oerlikon,
Sunwell has placed a follow-up order of 180 MW and
plans to start production in 2009 [Oer 2008].
■ Tainergy Tech Company Ltd. was founded in 2007.
According to the company, production capacity was
60 MW in 2008 and in 2009 total production capacity
will be increased to 240 MW.
■ Topco Scientific, is a semiconductor company and
Taiwan's largest distributor of silicon wafers. In 2005
the company started to produce wafers for solar cells
from reclaimed semiconductor material. In 2006 the
company announced that it would stop the manufac-
turing of silicon solar cells and move to thin-film solar
cells.
■ Top Green Energy Technologies Inc. was established
in January 2006 by Powercom. The company produces
silicon solar cells and invested in the upstream poly-
crystalline silicon production with a modified Siemens
manufacturing process. They broke ground for the fac-
tory at “Chang Pin Industrial Park” in May 2009.](https://image.slidesharecdn.com/pvindustrystatusreport2009-110903042424-phpapp02/85/Pv-industry-status-report-2009-52-320.jpg)
![PV Status Report 2009 | 51
6. The United States In 2008, the USA was the third largest market with 342 MW
of PV installations, 292 MW grid connected [Sei 2009]. Cali-
fornia, New Jersey and Colorado account for more than 75%
of the US grid-connected PV market. In 2008 the cumulative
installed capacity was around 1.15 GW (768 MW grid con-
nected). Production grew by 53% to 414 MW, mainly driven
by the production increase of thin-film manufacturers United
Solar (a-Si) and First Solar (CdTe). The US market share in
the thin-film market is around 28% and much higher than the
overall market share of 6%.
There is no single market for PV in the United States, but a
conglomeration of regional markets and special applications
for which PV offers the most cost-effective solution. In 2005
the cumulative installed capacity of grid-connected PV systems
surpassed that of off-grid systems. Since 2002 the grid-
connected market has been growing much faster, thanks to
a wide range of “buy-down” programmes, sponsored either
by States or utilities.
First Solar is continuing to expand its CdTe thin-film produc-
tion capacity and plans to have 1.1 GW fully operational by
the end of 2009 and more than 1.3 GW in 2011 [Fir 2009].
However, most of the production capacity is placed outside
the US (790 MW Malaysia, 198 MW Germany, >100 MW
France). United Solar has decided to expand its production
capacity to 300 MW by 2010 and 1 GW in 2012 [Ecd 2008].
After the acquisition of the manufacturing assets of Shell
Solar in 2006, SolarWorld AG acquired the Komatsu silicon
wafer production facility in Hillsboro (OR) in 2007 and start-
ed to convert it into a wafer and solar cell manufacturing
plant with up to 500 MW capacity. The new Hillsboro facility
came on line in the autumn 2008 and ramp up is foreseen
for 2009. Evergreen Solar is ramping up production as well
and announced that they have secured enough silicon to
increase production to 850 MW in 2012 [Eve 2008].
After years of political deadlock and negotiations concerning
the support of renewable energies in the USA, things started
to move in 2005. The main breakthrough was reached, when
the 2005 Energy Bill was passed by the Senate on 29 July
2005 and signed by President Bush on 8 August 2005.
The Bill’s main support mechanisms are:
■ Increase of the permanent 10% business energy credit
for solar to 30% for two years. Eligible technologies
include Photovoltaics, solar water heaters, concentrat-
ing solar power, and solar hybrid lighting. The credit
reverts back to the permanent 10% level after two years.
■ Establish a 30% residential energy credit for solar
for two years (until the end of 2008). For residential
systems, the tax credit is capped at $ 2,000.](https://image.slidesharecdn.com/pvindustrystatusreport2009-110903042424-phpapp02/85/Pv-industry-status-report-2009-53-320.jpg)
![52 | PV Status Report 2009
The second milestone was the final approval of the Califor- for solar and other renewable energies. On 3 October 2008,
nian “Million Solar Roofs Plan” or Senate Bill 1 (SB1), by the Congress approved and the President signed into law the
Californian Senate on 14 August 2006, and the signature “Energy Improvement and Extension Act of 2008” as part
by Governor Schwarzenegger on 21 August 2006. The Gover- of H.R. 1424, the “Emergency Economic Stabilization Act
nor's Office expects that the plan will lead to one million of 2008”.
solar roofs, with at least 3 GW installed Photovoltaic electric-
ity generating capacity in 2018. On 17 February 2009 President Obama signed the American
Recovery and Reinvestment Act (ARRA) into law. The main
Already in January 2006, the California Public Utilities solar provisions that are included in this bill are:
Commission (CPUC) put the major piece of the plan into
effect when it created the 10-year, $ 2.9 billion (€ 2.32 billion) ■ The creation of a Department of Treasury (DOT) Grant
“California Solar Initiative” to offer rebates on solar Programme.
Photovoltaic systems. However, because the CPUC only
has authority over investor-owned utilities, the rebates were ■ Improvement to the investment tax credit by eliminating
funded by the customers of those utilities and only avail- ITC penalties for subsidised energy financing.
able to those customers. SB 1 expanded the programme to
municipal utilities such as the Sacramento Municipal Utility ■ A new DOE Loan Guarantee Programme.
District and the Los Angeles Department of Power and Water
and allows the total cost of the programme to increase to as ■ Create tax incentives for manufacturing by offering
much as $ 3.35 billion (€ 2.39 billion). It also increases the accelerated depreciation and a 30% refundable tax
cap on the number of utility customers that can sell their credit for the purchase of manufacturing equipment
excess solar power generation back to the utility. That used to produce solar material and components for
number was previously capped at 0.5% of the utility's all solar technologies.
customers, but is now capped at 2.5% of the customers.
Starting in 2011, SB 1 requires developments of more than Clean Renewable Energy Bonds (CREBs) were created under
50 new single-family homes to offer solar energy systems as the Energy Tax Incentives Act of 200512, for funding State,
an option. It is believed that these Bills, together with other local, tribal, public utility and electric cooperative projects.
initiatives by individual States, will increase the demand for The Energy Improvement and Extension Act of 2008 exten-
Photovoltaic solar systems in the USA by large. ded the CREB programme and changed some programme
rules. The American Recovery and Reinvestment Act of 2009
On 23 September 2008, after more than a year of political expanded funding to $ 2.4 billion (€ 1.7 billion) of new allo-
debate the US Senate finally voted to extend the tax credits cations. Of this amount, $ 800 million (€ 571.4 million) is
12
added Section 54 to the Internal Revenue Code
10000
Fig. 12: One Million Roofs Target growth rate
Growth Rate necessary for One-Million Roof Target
and new estimates based on 2004 to 2007 3.5GWp
Cumulative Installed Capacity [MWp]
installations. One-Million Roof Target
29%
1000
New Growth Rate
40%
100
Old Growth Rate
18% Possible Installations
10 with new Growth Rate
2.2 GWp
1
1994
1995
1996
1997
1998
1999
2000
2001
2002
2003
2004
2005
2006
2007
2008
2009
2010](https://image.slidesharecdn.com/pvindustrystatusreport2009-110903042424-phpapp02/85/Pv-industry-status-report-2009-54-320.jpg)
![PV Status Report 2009 | 53
available for state, local, and tribal Governments; $ 800 million Figure 13 shows the nation-wide figures for the average
(€ 571.4 million) for public power providers; and $ 800 million residential electricity prices 2009 (January to April) which in-
(€ 571.4 million) for electric cooperatives (co-ops). creased in average by 7.5% from 10.49 ct/kWh to 11.28 ct/
Approved projects receive very low interest financing, some kWh. Taking these figures as a base, the US market for grid-
as low as 0.75 percent. Prior to new funds made available connected systems can be classified into four categories
in ARRA, CREBs funded a total of 573 solar projects, more where, according to local electricity costs net-metering and
than half of the total 922 projects covered by $ 1.2 billion market incentives, a listed turn-key price for a PV system
(€ 857.1 million) distributed in the first two rounds of allows for competitive PV electricity production.
funding authorised in 2005. The Energy Improvement and
Extension Act of 2008 extended the CREB programme and Although the majority of US States are in the category in
changed some programme rules. The IRS accepted applica- which significant incentives are required, one quarter of the
tions for new CREBs until 4 August 2009. US population lives in the five best market States for PV.
In those States, PV is cost-effective at an installed cost of
On 27 May 2009, President Obama announced to spend $ 6/Wp (assuming long-term financing as in a mortgage).
over $ 467 million (€ 333.6 million) from the ARRA to These five States also belong to those with the highest
expand and accelerate the development, deployment, and economic potentials.
use of geothermal and solar energy throughout the United
States. The DOE will provide $ 117.6 million (€ 84 million) The Energy Bill, the California SB 1 and other State Pro-
in Recovery Act funding to accelerate the widespread com- grammes are helping to accelerate the implementation of
mercialisation of solar energy technologies across America. solar electricity. Whether or not the new support measures
$ 51.5 million (€ 36.8 million) will go directly for Photovoltaic are sufficient and when they finally take effect to stimulate
Technology Development and $ 40.5 million (€ 28.9 million) the necessary growth in US installations still has to be seen.
will be spent on Solar Energy Deployment, where projects
will focus on non-technical barriers to solar energy deploy- In September 2004, the US Photovoltaic Industry published
ment. their PV Roadmap through to 2030 and beyond “Our Solar
Power Future” [Sei 2004]. The main goal of this Roadmap
Despite the increase of grid-connected Photovoltaic system is: “Solar provides half of all new US electricity generation by
installations during the last years, with growth rates of 2025”. The Industry Association advocated effective policies
around 40%, much still needs to be done to reach the targets sustained over time to increase solar power production and
of the “One Million Roofs” Initiative (Fig. 12). implementation in the US. Recommended actions were split
into two sections:
Fig. 13: Average residential electricity prices
(US¢/kWh) for 2009 [Eia 2009].
VT NH
WA
14.76 16.55 ME
7.66 ND
MT 15.63 MA: 17.84
6.87 MN
Best markets: (red) OR 8.55 NY R I: 16.23
ID 9.83 WY MI
above 6 $/Wp; 10 States: 8.53 SD 17.4
7.2 11.99 11.04 C T: 19.93
California, Connecticut, Colorado, Delaware, WY 7.83
8.05 IA PA NJ: 15.91
Hawaii, Nevada, New Jersey, New York, NE OH
9.46 IL
NV 7.45 IN 9.96 11.12 DE: 13.52
Rhode Island, Texas 12.58
UT 11.38
9.15
8.09 CO KS WV V A MD: 14.66
MO KT
CA 9.42 9.12 7.64 10.26
Cost effective markets: (orange) 7.5 8.26 DC: 12.82
14.51 TN NC
between 4 $/Wp and 6 $/Wp; 9 States + DC OK
AZ: NM AR 9.49 9.85
8.56 SC
Arizona, Florida, Maine, Massachusetts, Illinois, 9.94 9.81 9.3 MS AL G A
Ohio, Oregon, Utah, Vermont, Washington DC 10.13
AK 9.96 10.47 9.68
17.10 TX LA
Emerging markets: (green) 12.96 8.91 FL
between 2.5 $/Wp and 4 $/Wp; 8 States 12.48
Alaska, Georgia, Maryland, Minnesota, Montana,
New Hampshire, New Mexico, Oklahoma HI: 23.3
Significant incentives needed: (blue)
below 2.5 $/Wp; 23 States](https://image.slidesharecdn.com/pvindustrystatusreport2009-110903042424-phpapp02/85/Pv-industry-status-report-2009-55-320.jpg)
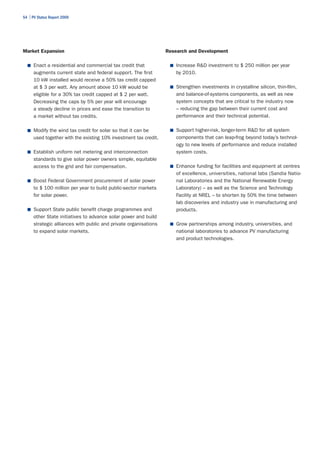
![PV Status Report 2009 | 55
6.1 Incentives supporting PV Many State and Federal policies and programmes have been
adopted to encourage the development of markets for PV
Due to the political situation in the US, there are no uniform and other renewable technologies. These consist of direct
implementation incentives for Photovoltaics. The “One Million legislative mandates (such as renewable content require-
Solar Roof” Initiative signed by President Clinton in 1997 ments) and financial incentives13 (such as tax credits). Finan-
lacks a dedicated budget and the Department of Energy cial incentives typically involve appropriations or other public
(DoE) can only support measures for the removal of market funding, whereas direct mandates typically do not. In both
barriers or the development of local promotion programmes. cases, these programmes provide important market develop-
The goal of the Initiative is practical and market-driven: to ment support for PV. The types of incentives are described
facilitate the sale and installation of one million “solar roofs” below. Amongst them, investment rebates, loans and grants
by 2010. Eligible technologies include Photovoltaics (PV), are the most commonly used – at least 39 States in all
solar water heating, transpired solar collectors, solar space regions of the country, have such programmes in place.
heating and cooling and pool heating. Most common mechanisms are:
After years of political negotiations, the Federal 2005 Energy ■ personal tax exemptions
Bill went into effect. The main incentive is the increase of (Federal Government, 21 States + Puerto Rico)
the permanent 10% business energy credit for solar to 30%
for two years. In addition, it established a 30% residential ■ corporate tax exemptions
energy credit for solar for two years. For residential systems, (Federal Government, 24 States + Puerto Rico)
the tax credit is capped at $ 2,000. The extension of the tax
credits until 2016 was finally approved by the U.S. Senate ■ sales tax exemptions for renewable investments
in September 2008 and signed into law on 3 October 2008. (27 States + Puerto Rico)
The Californian SB 1 went into force on 8 August 2006 and ■ property tax exemptions
the California Public Utilities Commission (PUC) adopted (35 States + Puerto Rico)
performance-based incentives for the California Solar Initia-
tive on 24 August 2006. Since 1 January 2007, the PUC ■ buy-down programmes
offers performance-based incentives for solar energy systems (19 States + District of Columbia, Virgin Islands,
greater than 100 KWp in size, installed in businesses and 234 utilities, 8 local)
other large facilities. For systems smaller than 100 KWp,
incentives for residential and small businesses will be based ■ loan programmes and grants
on each system’s estimated future performance. Both mech- (Federal Gov., 40 States + Virgin Islands; 69 utilities,
anisms reward the selection and proper installation of high 17 local, 7 private)
quality solar systems. This decision implements the first
phase of the California Solar Initiative, which was adopted ■ industry support and production incentives
by the PUC in January 2006. The goal of the Solar Initiative (Federal Government, 24 States + Puerto Rico,
is to increase the amount of installed solar capacity in Cali- 33 Utilities, 9 private)
fornia by 3,000 MW by 2017.
One of the most comprehensive databases about the differ-
From 1 January 2007, residential and small commercial ent support schemes in the US is maintained by the Solar
systems receive incentives of $ 2.50 per watt and will be Centre of the State University of North Carolina. The Data-
eligible for additional federal tax credits. Government and base of State Incentives for Renewable Energy (DSIRE) is
non-profit organisations will receive $ 3.25 per watt (€ 2.32) a comprehensive source of information on State, local,
to compensate for their lack of access to the federal tax utility, and selected federal incentives that promote renew-
credit. For systems larger than 100 kWp, incentive payments able energy [Dsi 2009]. All different support schemes are
over the first five years of operation will be 0.39 $/kWh described there and it is highly recommended to visit the
(0.279 €/kWh) of output for taxable entities and 0.50 $/ DSIRE web-site http://www.dsireusa.org/ and the correspon-
kWh (0.357 €/kWh) of output for Government/non-profit ding interactive tables and maps for more details.
organisations.
13
DOE has defined a financial incentive as one that: (1) transfers economic resources by the
Government to the buyer or seller of goods or a service that has the effect of reducing the
price paid or increasing the price received; (2) reduces the cost of producing the goods or
service; and/or (3) creates or expands a market for producers [Gie 2000].](https://image.slidesharecdn.com/pvindustrystatusreport2009-110903042424-phpapp02/85/Pv-industry-status-report-2009-57-320.jpg)
![56 | PV Status Report 2009
Table 3: Financial Incentives for Renewable Energy [DSIRE]
Personal Corporate Sales Property Industry Production
State/Territory Tax Tax Tax
Rebates Grants Loans
Recruit.
Bonds
Incentive*
Tax
Federal Gov. 3 4 3 5 1 1
Alabama 1-S 2-U 1-S 1-S, 1-U 1-U
Alaska 1-S 2-S 1-U
Arizona 3-S 1-S 1-S 2-S 6-U 2-U
Arkansas
California 2-S 6-S, 36-U, 3-L 1-S 1-U, 2-S, 4-L 1-S, 2-U
Colorado 2-S, 1-L 2-S 7-U, 1-L 1-S, 1-L, 2-P 1-S, 3-U, 2-L
Connecticut 2-S 1-S 2-S, 2-U 3-S 2-S 2-S
Delaware 1-S 2-S
Florida 2-S 2-S 1-S 1-S, 8-U, 1-L 1-S 5-U 1-L 2-U
Georgia 1-S 1-S 1-S 8-U 1-U 2-U
Hawaii 1-S 1-S 2-U 1-S, 2-U, 1-L 1-S
Idaho 1-S 1-S 1-S 1-P 1-S 1-S 1-P
Illinois 1-S 2-S 1-S 2-S, 1-P 1-S 1-P
Indiana 1-S 5-U 1-S 1-U
Iowa 1-S 1-S 1-S 3-S 12-U 1-S 2-S, 1-U
Kansas 1-S 2-U 1-S
Kentucky 1-S 2-S 1-S 7-U 1-P, 1-L, 1-U 1-U
Louisiana 1-S 1-S 2-S 2-S
Maine 1-S 1-S 1-S 1-S 1-S
Maryland 3-S 3-S 2-S 5-S, 7-L 3-S, 1-L 3-S
Massachusetts 2-S 3-S 1-S 1-S 2-S, 4-U 2-S 1-U 1-S 1-P
Michigan 2-S 1-U 2-S 3-S 1-U
Minnesota 2-S 1-S 2-S, 22-U 1-S, 2-U 5-S, 3-U 1-S, 1-U
Mississippi 4-U 1-S, 2-U 1-U
Missouri 1-S 6-U 1-S, 1-U
Montana 3-S 1-S 3-S 4-U 1-U 1-S 2-S 1-P
Nebraska 1-S 2-U 1-S
Nevada 1-S 4-S 1-S 1-S
New Hampshire 1-S 1-S, 4-U 1-S
New Jersey 1-S 1-S 4-S 2-S, 1-U 1-S 1-S
New Mexico 4-S 3-S 2-S 1-S 1-S 1-S 1-S 3-U
New York 3-S 1-S 1-S 2-S, 1-L 5-S, 4-U, 1-L 2-S 2-S 2-S 1-S
North Carolina 1-S 1-S 1-S 2-S 4-U 1-S 1-S, 1-U 3-U, 1-P
North Dakota 1-S 1-S 2-S 2-U
Ohio 1-S 1-S 2-S, 1-L 5-U, 1-P 6-S 1-S, 1-U, 1-L 1-S
Oklahoma 1-S 1-S 1-U 4-S, 1-U 1-S
Oregon 1-S 1-S 2-S 7-S, 20-U 1-P, 1-S 2-S, 12-U 1-S 1-S, 1-P, 1-U
Pennsylvania 1-S 2-S, 1-L 5-S, 1-U,2-L 2-S, 5-L, 1-U 2-S
Rhode Island 1-S 1-S 1-S 2-S 1-U 1-S 1-S 1-P
South Carolina 1-S 2-S 1-S 3-U 1-S, 4-U 1-S, 1-U, 1-P
South Dakota 3-S 4-U 2-U
Tennessee 1-S 1-S 1-S 1-S 1-U
Texas 1-S 2-S 16-U 2-S 1-S 1-U
Utah 1-S 1-S 1-S 6-U 1-S
Vermont 1-S 1-S 1-S 2-S 1-S 1-S, 1-U 2-S 1-S, 2-U
Virginia 2-S 1-S 1-S 1-U
Washington 1-S 17-U 1-P, 1-L 13-U 1-S 1-S, 3-U, 1-P
West Virginia 1-S 1-S 1-S
Wisconsin 1-S 2-S 3-S, 6-U 1-S, 1-U 1-S 2-S 6-U
Wyoming 1-S 1-S, 3-U
D.C. 1-S
Palau
Guam
Puerto Rico 2-S 1-S 2-S 1-S 1-S
Virgin Islands 1-S 1-S
N. Mariana Isl.
American
TOTALS 38 38 36 74 288 59 136 29 3 52](https://image.slidesharecdn.com/pvindustrystatusreport2009-110903042424-phpapp02/85/Pv-industry-status-report-2009-58-320.jpg)
![PV Status Report 2009 | 57
Table 4: Rules, Regulations and Policies for Renewable Energy [DSIRE]
Net Inter- Extension Contractor Equipment Access Construction Green Required
State / Territory PBF RPS & Design Power Green
Metering connection Analysis or License Certifikation Laws
Standards Purchase Power
Federal 1 2 1
Alabama
Alaska 1-S
Arizona 1-S, 1-S, 3-U 1-U 1-S 1-S 1-S 1-S 3-S, 4-L 1-L
Arkansas 1-S 1-S 1-S
California 1-S 1-S 1-S 1-S 1-S 2-S, 8-L 2-S, 8-L 4-L
Colorado 1-L 1-S, 1-L 1-S 1-S 1-S 1-S, 2-L 2-S, 5-L 2-L 1-S
Connecticut 1-S 1-S 1-S 1-S 1-S 1-S 1-S, 1-L
Delaware 1-S, 2-U 1-S 1-S 1-S 1-S 1-S 2-U
Florida 1-U 1-S 1-S 1-S 1-S 1-S, 1-L 1-S
Georgia 1-S 1-S 1-S
Hawaii 1-S 1-S 1-S 1-S 1-S 2-S
Idaho 3-U 1-S
Illinois 1-S 1-S 1-S 1-S 1-S 1-S
Indiana 1-S 1-S 1-S 1-S, 1-L 1-S
Iowa 1-S 1-S 1-S 1-S 1-S
Kansas 1-S 1-S 1-S 1-S 1-L
Kentucky 1-S 1-S 1-S
Louisiana 1-S, 1-L 1-S
Maine 1-S 1-S 1-S 2-S 1-S 1-S
Maryland 1-S 1-S 1-S 1-S 1-S 1-S, 1-L
Massachusetts 2-S 1-S 1-S 1-S 1-S 3-S 1-S, 1-L
Michigan 1-S 1-S, 1-U 1-S 1-S 1-S 2-S, 1-L 3-L
Minnesota 1-S 2-S 1-S 1-S 1-S 1-S 1-S
Mississippi
Missouri 1-S, 1-L 1-S 1-S 1-S 1-S
Montana 1-S 1-S 1-S, 1-U 1-S 1-S 1-S
Nebraska 1-S 1-S 1-S
Nevada 1-S 1-S, 1-U 1-S 1-S 1-S
New Hampshire 1-S 1-S 1-S 1-S 1-L
New Jersey 1-S 1-S 1-S 1-S 2-S 2-S
New Mexico 1-S 1-S, 1-U 1-S 1-S 1-S 1-S
New York 1-S 1-S, 1-U 1-S, 1-U 1-S 1-S 1-S, 1-L 1-S, 1-L
N. Carolina 1-S 1-S 1-S 1-S, 1-L 1-S, 10-L
North Dakota 1-S 1-S 1-S
Ohio 1-S 1-S 1-S, 1-U 1-S 1-S 1-S
Oklahoma 1-S 1-S
Oregon 1-S 1-S 1-S, 1-U 1-S 1-S 1-S 1-S, 2-L 3-S, 1-L 1-L 1-S
Pennsylvania 1-S 1-S 1-S 1-S 1-S 1-S, 1-L
Rhode Island 1-S 1-S 1-S 1-S 1-S
S. Carolina 3-U 1-S 1-S 1-L
South Dakota 1-S 1-S 1-S
Tennessee 1-S
Texas 1-S, 1-L, 1-U 1-U 1-S 1-S 2-S, 5-L 4-L
Utah 1-S 1-S, 3-U 1-S 1-S 1-S 1-L 1-L
Vermont 1-S 1-S 1-S 1-S 1-S 1-S
Virginia 1-S 1-S 1-S 2-S 1-S, 1-L 1-L
Washington 1-S 1-S, 1-U 1-S 1-S 1-S, 1-L 2-L 1-S
West Virginia 1-S
Wisconsin 1-S 1-S 1-S 1-S 1-L 1-S, 1-L 1-S 1-S, 1-L
Wyoming 1-S 1-S
D.C 1-S 1-S 1-S 1-S 1-S
Palau
Guam 1-S 1-S 1-S
Puerto Rico 1-S 1-S 1-S 1-S
Virgin Islands 1-S 1-S
N. Mariana Isl.
Amer. Samoa 1-S
TOTALS 22 44 67 43 3 11 5 55 88 36 8](https://image.slidesharecdn.com/pvindustrystatusreport2009-110903042424-phpapp02/85/Pv-industry-status-report-2009-59-320.jpg)
![58 | PV Status Report 2009
A study by B.J. Rabe for the Pew Centre on Global Climate The benefits at State level do not only include the signifi-
Change looks into the expanding role of US State Renewable cant reduction of green-house gas emissions, but they are
Portfolio Standards [Rab 2006]. One of the key messages is: also an effective means to diversify energy supply sources,
increase energy security and create local jobs and economic
States are compelled to enact or expand RPSs for multiple benefits. The later reasons are probably behind the fact that
reasons, and greenhouse gas emissions may or may not be a number of States have recently revisited and significantly
central factors in prompting adoption. Instead, States consist- increased or accelerated their annual requirements.
ently anticipate significant economic development benefits
from promoting renewables, particularly given the promise Most of these capacities will be wind, but Photovoltaic elec-
of developing home-grown energy sources that could lead tricity is seen more and more as an option as well. There-
to instate job creation. In turn, States are also attracted to fore, it is interesting that 10 other States have followed the
RPSs by the prospect of greater reliability of electricity Colorado RPS with a specific target for solar electricity. In
supply in coming decades and the prospect of reducing addition, a number of States have provisions in their RPS
conventional air pollutants through a shift toward expanded which counts electricity from PV systems with a higher
use of renewables. multiplier. The RPS laws in California and New York create
the two largest markets for new renewable energy growth
In August 2009, 29 States, the District of Columbia and in the short term.
Guam had Renewable Portfolio Standards, five additional
States have State Goals and in Florida one utility has agreed In December 2007, Ken Zweibel, James Mason and Vasilis
on a RPS (Fig. 14). In 14 States and the District of Columbia Fthenakis published their vision “A Solar Grand Plan” for the
the RPS include minimum solar or distributed generation U.S. in Scientific America [Zwe 2007]. The paper describes
(DG) provisions (Fig. 15). how Photovoltaic technology could provide almost 3,000
GW of power by 2050. According to the authors, solar must
Another very important measure for Photovoltaics is the become competitive at the mass-production level in a first
grid access. In August 2009, 42 US States, Washington DC, phase from now until 2020. In order realise this, about
Guam, Puero Rico the Virgin Islands and American Samoa 84 GW of Photovoltaics and concentrated solar power plants
had implemented a net metering policy (Fig. 16). In Idaho, would have to be built by 2020. In parallel, it would be
South Carolina and Texas some utilities have agreed on necessary to lay the foundation of the necessary High Volt-
voluntary net metering. age Direct Current (HVDC) transmission system.
The Union of Concerned Scientists predicts that State RPS The realisation of such a plan would drastically change the
and Renewable Energy Funds could lead to the development market situation, as well as the production and technology
of 76,750 MW of new renewable production capacity by 2025. base in the U.S.
This would be an increase of more than 570% compared
to the total US RE capacity in 1997 (excluding hydro) [Uni
2009]. The commitment to increase renewable energy use
at the State level will have a significant impact on reducing
CO2 emissions. By 2025, these State RPSs will reduce total
annual CO2 emissions by more than 183 million tons CO2
which is the equivalent of taking 30 million cars off the road.
Legend for table 3 and 4, pages 56/57:
S = State/Territory L = Local U = Utility P = Private
Source: North Carolina Solar Centre, North Carolina State University research based on
information in the Database of State Incentives for Renewable Energy (DSIRE) (2009).
http://www.dsireusa.org
* In addition, some private renewable energy credit (REC) marketers provide production-
based incentives to renewable energy project owners.
For more info see:
http://www.eere.energy.gov/greenpower/markets/certificates.shtml?page=2](https://image.slidesharecdn.com/pvindustrystatusreport2009-110903042424-phpapp02/85/Pv-industry-status-report-2009-60-320.jpg)
![PV Status Report 2009 | 59
R enewRenewableortfolio Standards
able P Portfolio Standards
Fig. 14: States with Renewable Portfolio
Standards in the US (August 2009); W A: 15% by 2020* VT: (1) RE meets any increase M E: 30% by 2000
New R E: 1 0% by 20 17
Figure © DSIRE [Dsi 2009]. M T: 15% by 2015
M N: 25% by 2025 in retail sales by 2012;
(Xcel: 30% by 2020) (2) 20% RE & CHP by 2017 ☼ NH: 23.8% by 2025
OR : 25% by 2025 (large utilities )
ND: 10% by 2015 M I : 10% + 1,100 M W ☼ M A: 15% by 2020
5% - 10% by 2025 (smaller utilities) by 2015* + 1% annual increase
(Class I Renewables)
SD: 10% by 2015 W I : Varies by utility; ☼ NY: 24% by 2013
10% by 2015 goal RI : 16% by 2020
☼ NV: 25% by 2025* CT: 23% by 2020
I A: 105 M W
☼ OH: 25% by 2025 †
☼ CO: 20% by 2020 (I OUs)
☼ P A: 18% by 2020 †
1 0% by 202 0 (co-ops & large m unis)*
I L: 25% by 2025 VA: 15% by 2025* ☼ NJ: 22.5% by 2021
CA: 20% by 2010 UT: 20% by 2025* K S: 20% by 2020
☼ M D: 20% by 2022
☼ M O: 1 5 % by 2021
☼ AZ: 15% by 2025 ☼ DE: 20% by 2019*
☼ NC: 12.5% by 2021 (I OUs)
10% by 20 18 ( co-ops & muni s) ☼ DC: 20% by 2020
☼ NM : 20% by 2020 (I OUs)
10% by 20 20 ( co-ops)
TX: 5,880 M W by 2015
HI : 40% by 2030 29 states & DC
have an RPS
5 states have goals
State renewable portfolio standard
☼ Minimum solar or customer-sited requirement
State renewable portfolio goal
Solar water heating eligible *
†
Extra credit for solar or custom er-sited renewables
Includes separate tier of non-renewable alternative resources
R P S P olicies w ith Solar/ DG Provisions
RPS Policies with Solar/ DG Provisions
Fig. 15: US States with RPS Policies with
Solar/DG Provisions (August 2009);
Figure © DSIRE [Dsi 2009]. W A: double credit for DG
N H: 0.3% solar-electric by 2014
M I : triple credit for solar M A: TB D
N V: 1.5% solar by 2025;
2.4 to 2.45 multiplier for PV N Y : 0.1312% custom er - ited
s
by 2013
CO: 0.8% solar-electric OH: 0 .5% solar
by 2020 N J: 2.12% solar-electric by 2021
UT: 2.4 m ultiplier by 2025
for solar
P A: 0.5% solar P V by 2020
M O: 0.3% solar-electric
by 2021 DE: 2.005% solar P V by 2019;
AZ: 4.5% DG by 2025 triple credit for PV
N C: 0 .2% solar M D: 2% solar-electric in 2022
by 2018
DC: 0.4% solar by 2020;
N M : 4% solar-electric by 2020 1.1 multiplier for solar
0.6% DG by 2020
TX: double credit for non-w ind
(Non-wind goal: 500 MW)
14 states & DC
have an RPS with
State renewable portfolio standard with solar / distributed generation (DG) provision solar/DG provisions
State renewable portfolio goal with solar / distributed generation provision
Solar water heating counts toward solar provision Note: RI requires 3 MW of solar by 2014, but this not part of the state's RPS policy.](https://image.slidesharecdn.com/pvindustrystatusreport2009-110903042424-phpapp02/85/Pv-industry-status-report-2009-61-320.jpg)
![60 | PV Status Report 2009
Fig. 16: US States with Net-metering in the US Net Metering
(August 2009) and upper limits;
Figure © DSIRE [Dsi 2009]. N et M etering
M E: 660
W A: 100 co-ops & munis: 100
M T: 50* N D: 100* VT: 250
OR: 25/ 2,000* M N : 40 M I : 150* N H: 100
M A: 60/ 1,000/ 2,000*
W Y : 25* W I : 20*
RI : 1,650/ 2,250/ 3,500*
I A: 500* I N : 10* CT: 2,000*
N V: 1,000* CO: 2,000 N E: 25 OH: no lim it* N Y : 25/ 500/ 2,000*
co-ops & munis: 10/25 I L: 40*
P A: 50/ 3,000/ 5,000*
UT: 25/ 2,000* W V: 25
K S: 25/ 200* N J: 2,000*
M O: 100 K Y : 30*
CA: 1,000* N C: 1,000* DE: 25/ 500/ 2,000*
N M : 80,000* OK : 100*
M D: 2,000
AZ: no lim it* AR: 25/ 300 DC: 1,000
GA: 10/ 100 VA: 20/ 500*
LA: 25/ 300
FL: 2,000*
HI : 100
KIUC: 50
42 states & DC
State policy have adopted a
Voluntary utility program(s) only net metering policy
* State policy applies to certain utility types only (e.g., investor-owned utilities)
Note: Numbers indicate system capacity limit in kW. Some state limits vary by customer type, technology and/or system application.Other limits might also apply.](https://image.slidesharecdn.com/pvindustrystatusreport2009-110903042424-phpapp02/85/Pv-industry-status-report-2009-62-320.jpg)
![PV Status Report 2009 | 61
6.2 Solar Energy Technologies Programme 4. Eliminating city and state level technical and regulatory
barriers to solar technology deployment.
The aim of the US Solar Energy Technologies Programme
(SETP or Solar Programme) is to develop cost-competitive 5. Improving the ability of DOE and its laboratories and
solar energy systems for America. The current Multiannual partners to quickly and effectively transfer R&D concepts
work-programme runs from 2008 to 2012 [DOE 2008]. from basic to applied science and then to the marketplace.
More than $ 170 million (€ 121.4 million) are spent each
year for research and development on the two solar electric 6. Exploring and developing the next generation of PV
technologies which are considered to have the greatest po- technologies that will reach consumers beyond the SAI
tential to reach cost competitiveness by 2015: photovoltaics timeframe (post-2015).
and concentrating solar power. The programme names
as the greatest R&D challenges the reduction of costs, 7. Assisting U.S. industry in regaining its leadership role
improvement of system performance, and the search for new in the global solar marketplace.
ways to generate and store energy captured from the sun.
8. Promoting increased understanding of environmental
The Solar Programme also aims to ensure that the new and organisational safety across all Solar Programme
technologies are accepted in the marketplace. Work is done activities by all participants.
to remove many non-technical market barriers, such as
updating codes and standards that aren't applicable to new The Solar Programme goals support the DOE 2006 Strate-
technologies, improving interconnection agreements among gic Plan [DOE 2006], which identified five strategic themes
utilities and consumers, and analyzing utility value capacity amongst them energy security, which is a key driver of the
credits for utilities. Such activities should help consumers, Solar Programme activities supported by the DOE. In addi-
businesses, and utilities to make more informed decisions tion, the Programme supports the research and development
when considering renewable energy, and they also facilitate provisions and broad energy goals outlined in the National
the purchase of solar energy. Energy Policy Act 2005 (EPAct 2005) and the Energy Inde-
pendence and Security Act (EISA). In both acts, Congress
The Solar Programme conducts its key activities through expressed strong support for decreasing dependence on
four sub-programmes: foreign energy sources and decreasing the cost of renewable
energy generation and delivery. Support from Congress and
■ Photovoltaics state Governments and the availability of financial incentives
are important for achieving the Solar Programme goals.
■ Concentrated Solar Power
The Solar Programme lists economic targets for PV (Table 5),
■ Systems Integration which were determined by an analysis of key markets. They
were set based on assessments of the Levelised Costs of
■ Market Transformation. Energy (LCOE) for solar technologies to be competitive in
these markets.
According to the Solar Programme, the residential and com-
The 2008-2012 timeframe emphasizes the following areas: mercial price targets are based on current retail electricity
prices and take into consideration the rather optimistic
1. Fully incorporating concentrating solar power (CSP) projection of the Energy Information Administration (EIA) that
efforts into the Solar America Initiative (SAI). electricity prices will remain fairly constant (in real terms)
through 2025. With these assumptions, the Programme
2. Improving storage technologies for both CSP and predicts that meeting the solar market cost goals will result
PV technologies. in 5-10 GW of PV installed by 2015 and 70-100 GW by 2030
in the U.S.
3. Better integrating solar technologies into the electric
grid, in both distributed and centralised generation appli-
cations.](https://image.slidesharecdn.com/pvindustrystatusreport2009-110903042424-phpapp02/85/Pv-industry-status-report-2009-63-320.jpg)
![62 | PV Status Report 2009
Table 5: Solar Programme Cost Targets
Market Sector Current U.S. Levelised Cost of Energy (US¢/kWh)
Market Price Range
for Conventional
Electricity (US¢/kWh) Benchmark Target
2005 2010 2015
Utility 4.0-7.6
13–22 13–18 5–7
2.6 – 24.5 b
Commercial a 5.4-15.0 c
16–22 9–12 6–8
6.09 - 20.89 d
Residential 5.8-16.7 c
23–32 13–18 8–10
7.5 - 23.3 d
a) In many commercial applications, utility costs are tax deductible. In these cases, the cost
of solar energy should be compared to the effective market price, considering tax effects.
b) 2009 (January – July) Wholesale Day Ahead Prices at Selected Hubs, Peak on ICE platform
[Eia 2009].
c) Electricity costs cited in the Solar Programme.
d) Electricity costs in 2009 (January to April) [Eia 2009].
Ten Photovoltaic technology roadmaps were developed in 6.2.1.1 New Devices and Processes
2007 by staff at NREL, Sandia National Laboratories, DOE, The emphasis of the Solar Energy Technologies Programme
and experts from universities and private industry [DOE 2008a]. photovoltaic research in new devices is to develop novel PV
This work was done, in part, to support activities within the devices and processes with potentially significant perform-
Solar America Initiative. These technology roadmaps sum- ance and/or cost advantages.
marise the current status and future goals for the specific
technologies. The Roadmaps for Intermediate-Band PV, The proposed research targets the following
Multiple-Exciton-Generation PV and Nano-Architecture PV photovoltaic areas:
are still in a draft stage.
■ Design, development, and preliminary degradation
6.2.1 Solar Technology Research Plan testing of lab-scale device prototypes
The U.S. strategy for overcoming the challenges and barriers
to massive manufacturing, sales, and installation of PV ■ Completion of process demonstrations in lab-scale
technology is to achieve challenging targets throughout evaluations
the development pipeline. Multiple technologies are being
pursued that are at differing stages of maturity. With an ■ Preliminary science investigations or literature review
effective combination of the talents in industry, university, without component or system prototype development
and national laboratories, the needed cost, performance and
reliability goals should be achieved. Specific PV R&D efforts ■ Assessment of initial technical and market product
toward achieving these goals include: or process technology concepts using laboratory
investigations
1. PV Systems & Module Development
2. PV Materials & Cell Technologies ■ Physics-based modelling
3. Testing & Evaluation
4. Grid / Building Integration ■ Parametric estimation
The PV sub-programme's R&D activities are divided into the ■ Other relevant analytical methods.
following three categories:](https://image.slidesharecdn.com/pvindustrystatusreport2009-110903042424-phpapp02/85/Pv-industry-status-report-2009-64-320.jpg)
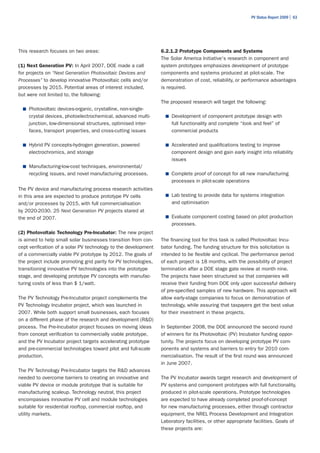
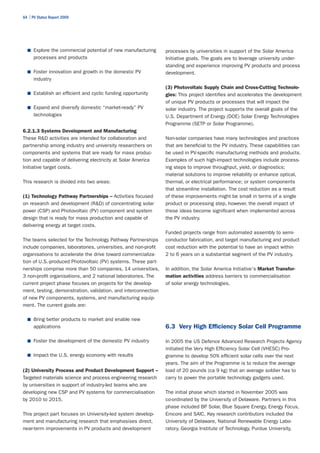
![PV Status Report 2009 | 65
University of Rochester, Massachusetts Institute of Technol- 6.4 The US PV-Industry Roadmap
ogy, University of California Santa Barbara, Optical Research
Associates and the Australian National University. To meet the challenge of the expanding PV markets the
US-based PV industry has developed a PV Roadmap as a
During the initial phase the co-design of optics and solar guide for building their industry in 2001 and updated it in
cell architectures enabling ultra-high efficiency and low cost 2004 [Sol 2001, Sei 2004]. In 2001 the main issues were
manufacture was investigated. The relevant topics were: concerned with ensuring US technology ownership and im-
plementing a sound commercialisation strategy that should
■ Lateral solar cell architecture – this expands material yield significant benefits at minimal cost. To do so they call
choice (no lattice/current mismatch), increases for “reasonable and consistent co-investment by our industry
performance and Government in research and technology development”.
Despite the high investments needed, the environmental and
■ Substrate is high performance, low-cost silicon direct economic benefits, together with the additional energy
solar cell independently-contacted vertical solar cell security, will by far exceed the investments.
architecture
- expands material choice In the 2004 update the US Industry states that their original
- monolithic structure with low materials and analysis on cost reduction and market development was
fabrication costs right, but that the necessary investments to achieve the
- no tunnel junctions goals were not made in the US but in Japan and Germany.
It is highlighted that California is one of the shining stars
■ Low cost multijunction solar cell in the US regarding PV implementation. The success there
- New structures based on existing high efficiency cannot substitute a national commitment to develop the
materials markets. The conclusion drawn is: “Effective policies
- Parallel paths and materials for high, mid and low sustained over time increase solar power production, make
energy photons markets grow dramatically, improve technology and reduce
costs.”
■ High performance substrate, low-cost silicon solar cell
In the 2004 update, the industry showed two scenarios.
■ Quantum dot solar cells The first one, Business as Usual and the more ambiguous
- optimised solar cell structures selective energy “Roadmap” scenario, where the target figures are increased
contacts compared to 2001. Under the Roadmap scenario, PV should
- closely spaced QD arrays provide half of all new US electricity generation by 2025 and
produce approximately 7% of the national electricity com-
In July 2007 DARPA announced the start of the second pared to 1% in the BAU case. Within the next 25 years the
phase of the programme by funding the newly formed PV Industry expects to employ more than 260,000 people
DuPont-University of Delaware VHESC Consortium to transi- (59,000 in case of BAU) in the US. To reach these goals
tion the lab-scale work to an engineering and manufacturing the PV Industry argues that market leadership has to be
prototype model. For this purpose, DARPA awarded the con- reclaimed and technology ownership has to be maintained.
sortium $ 12.2 million as part of a three-year, multi-phase The following measures are supposed to do so, by the
programme that could total up to $ 100 million. DuPont is American PV Industry in their Roadmap.
managing the consortium of proposed companies and
scientific institutions dedicated to the optimisation of the Reclaim Market Leadership
VHESC solar cells for efficiency and cost.
■ Create Incentives for Market Leadership – Implement
tax credits for residential and commercial installations
that augment current state and federal support. The
first 10 kWp installed should receive a 50% tax credit
capped at $ 3 per watt. Any amount above 10 kWp
would be eligible for a 30% tax credit capped at $ 2 per
watt. Decreasing the caps by 5% per year will encour-
age a steady decline in prices and ease the transition
to a market without tax credits. The wind production
tax credit for solar power should also be expanded in](https://image.slidesharecdn.com/pvindustrystatusreport2009-110903042424-phpapp02/85/Pv-industry-status-report-2009-67-320.jpg)
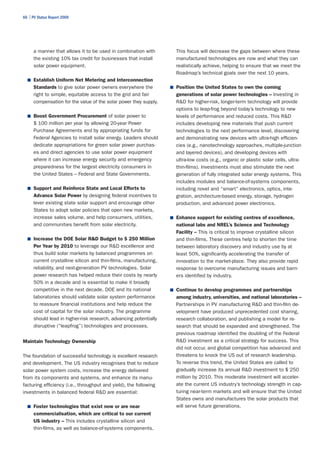
![PV Status Report 2009 | 67
Fig 17
Fig. 17 US PV-Industry Roadmap [Sei 2004] 1000,00 100,00
Installed (BAU)
Cumulative Installed Capacity [GWp]
Installed (Roadmap)
Shipments (BAU)
Annual Shipments [GWp]
100,00
Shipments (Roadmap)
10,00
10,00
Fig
1,00
1,00
0,10 0,10
2004 2010 2015 2020 2030
Year
Page 1
Compared to the 2001 scenario, the new update empha- BP Solar operates joint ventures in India, Malaysia, Saudi
sises the importance of a strong home market in order to Arabia, South Africa, Thailand and Indonesia. According to
develop the local industry in the long term. This is in con- the company, production capacity in 2007 was 228 MW with
trast to the earlier assumption that US PV-Industry Roadmap an additional 700 MW under construction. The production
could depend on 70% export rate of their annual production. capacity at the Homebush Bay Plant, Australia was 50 MW,
A strong home market like in Japan, where it accelerated the but the plant was closed at the end of March 2009.
expansion of production capacities, is still missing in the
United States. This might be one of the reasons why it lost In 2007, BP announced the expansion of production capaci-
its market leader position, held for many years, and is now ties. At that time it was planned to increase capacity at
at fourth place behind Japan, Europe and China. the Frederick Plant to 150 MW, but with space for further
enlargements of the manufacturing capacity to 400+ MW
in its casting, sizing, and wafering processes [Bps 2007].
Construction was slated for completion by the end of 2009.
6.5 Solar Companies
In 2008 Tata BP Solar announced that they had secured
In the following chapter most of the current cell manufactur- funding for their 128 MW capacity expansion, which is a
ers in the U.S. are described briefly. This listing does not crucial step to realise the expansion to 300 MW [Tat 2008].
claim to be complete, especially due to the fact that for
some companies, information or data were very fragmented. In March 2009 BP announced to refocus its manufacturing
Data were collected from the companies’ web-sites. A lot of activities, and as a result module assembly in Frederick will
start-up companies are missing due to sparse and some- be phased out and its cell manufacturing and module as-
times contradictory information. sembly facilities in Spain will close [Bps 2009]. Silicon cast-
ing, wafering, sizing and solar cell production in Frederick will
6.5.1 BP Solar continue. This announcement is in line with the supply deals
BP Solar has its headquarters in Linthicum, MD, and has BP Solar signed in 2008 with a number of wafer suppliers
various factories world-wide. BP Solar moved from third place and cell manufacturers to supplement its own manufacturing
in 2004, with 85 MW to number 16 in 2008 with 156 MW. capacity.
BP Solar had 4 solar cell plants located in Madrid, Spain
(Tres Cantos: 27.7 MW, c-Si Saturn solar cells), Sydney- 6.5.2 Evergreen Solar
Homebush Bay, Australia (28.8 MW, mc-Si and c-Si Saturn Evergreen Solar, founded in 1994, develops, manufactures
solar cells), Bangalore (joint venture with Tata), India and sells solar power products, primarily solar panels.
(80 MW, mc-Si), and Frederick, Maryland (19.8 MW mc-Si). The company serves three markets: wireless power, rural](https://image.slidesharecdn.com/pvindustrystatusreport2009-110903042424-phpapp02/85/Pv-industry-status-report-2009-69-320.jpg)
![68 | PV Status Report 2009
electrification and grid-connected applications. The company In 2006, German module manufacturer, SOLON AG, acquired
uses its String Ribbon wafer production to produce distinc- a 19% stake in Global Solar Energy Inc. The remaining 81%
tive products, to reduce manufacturing costs through lower are owned by a European venture capital investor. The
materials use and streamlined processes, and to manufac- company is producing thin-film Photovoltaic CIGS solar cells
ture internationally for global market penetration. Production for use in solar products, as well as installing and managing
in 2008 was 26.5 MW [Pvn 2009]. According to the compa- large solar Photovoltaic systems. According to the com-
ny, the first 80 MW phase of their new facility in Devens was pany, the new 40 MW plant was opened in March 2008 and
opened in June 2008, with the second 80 MW planned to 35 MW plant in Germany opened in the autumn of 2008.
become operational in 2009. The company has announced With plans to expand production capacity by an additional
that it has secured enough silicon feedstock to grow to 100 MW in 2009, GSE aims for 175 MW production capacity
850 MW production in 2012. in 2010 [Glo 2008]. In 2008, 7 MW production was reported
[Pvn 2009].
On 30 July 2009 Evergreen announced the signing of a
manufacturing agreement with Jiawei Solar, PRC [Eve 2009]. 6.5.5 United Solar Systems
Under the agreement, Evergreen will manufacture String United Solar Systems Corp. is a subsidiary of Energy Conver-
Ribbon wafers in at Jiawei's facility in China and Jiawei will sion Devices, Inc. (ECD). The first 25 MW manufacturing
then use the wafers to manufacture Evergreen Solar-branded facility of the flexible a-Si triple junction solar cell is located
modules. The initial capacity of the factory will be 100 MW in Auburn Hills (MI) and was inaugurated in 2002. The plant
and should be fully operational in 2010. A further expansion is fully automated and allows simultaneous processing of
to 500 MW is intended to be realised by 2012. six rolls of stainless steel, each 1 ½ miles long, during
deposition of the a-Si layers.
Evergreen Solar has a joint venture Sovello with Q-cells,
Germany, and Renewable Energy Corporation ASA (REC), According to the company, production capacity will expand to
Norway in Thalheim, Germany, which is located approximately 320 MW by 2010 and 720 MW in 2011. In 2008 financing
80 miles from Berlin. In June 2007 the second production deals were closed which would allow an expansion to 1 GW
line started operation, bringing the total capacity of EverQ to in 2012 [Ecd 2008]. The current nameplate capacity in Au-
100 MW. Production in 2008 was 94 MW. According to the burn Hills is quoted with 58 MW and in Greenville, Michigan
company, production capacity in 2009 will reach 180 MW. 120 MW. Additional expansion is planned in China where a
joint venture with Tianjin Jinneng Investment Company (TJIC)
6.5.3 First Solar LLC. will build a 30 MW module plant in Tianjin. Production in
First Solar LLC is one of the companies world-wide to pro- 2008 increased to 113 MW [Pvn 2009].
duce CdTe-Thin-film modules. First Solar has developed a
solar module product platform that is manufactured using 6.5.6 SunPower Corporation
a unique and proprietary Vapour Transport Deposition (VTD) SunPower was founded in 1988 by Richard Swanson and
process. The VTD process optimises the cost and production Robert Lorenzini to commercialise proprietary high-efficiency
through-put of thin-film PV modules. The process deposits silicon solar cell technology. The company went public in
semiconductor material while the glass remains in motion, November 2005. SunPower designs and manufactures high-
completing deposition of stable, non-soluble compound performance silicon solar cells, based on an interdigitated
semiconductor materials. rear-contact design for commercial use. The initial products,
introduced in 1992, were high-concentration solar cells with
First Solar is continuing to expand its CdTe thin-film produc- an efficiency of 26%. SunPower also manufactures a 22%
tion capacity massively. The latest announcement was made efficient solar cell called Pegasus that is designed for non-
in July 2009 to build a new factory in a joint venture with concentrating applications.
EdF Nuovelles in France with at least 100 MW capacity [Fir
2009]. The company has currently four manufacturing plants SunPower conducts its main R&D activity in Sunnyvale,
in Perrysburg (U.S.A.), Frankfurt/Oder (Germany) and two California and has its cell manufacturing plant outside of
in Kulim (Malaysia), which will have a combined capacity of Manila in the Philippines. Fab. No 1 has a nameplate capac-
1.1 GW at the end of 2009. In 2008 the company produced ity of 108 MW. Fab. No 2 was fully operational at the end
503 MW and currently sets the production cost benchmark of 2008 with a capacity of 306 MW. For 2009 a capacity
with 0.86 $/Wp (0.62 €/Wp) in the second quarter of 2009. increase to 574 MW is foreseen. According to their Annual
Report 2008, the company started the construction of a
6.5.4 Global Solar Energy Inc. 1 GW solar cell factory in Malaysia. Production in 2008 was
GSE is located in Tucson and was established in 1996. quoted with 237 MW [Pvn 2009].](https://image.slidesharecdn.com/pvindustrystatusreport2009-110903042424-phpapp02/85/Pv-industry-status-report-2009-70-320.jpg)
![PV Status Report 2009 | 69
6.5.7 Additional Solar Cell Companies lines in its Santa Clara facility. In July 2008 the company
announced that NREL has measured their modules
■ Abound Solar, Inc. (formerly AVA Solar) was founded in based on their flexible cells encapsulated in a glass/
2007 to commercialise the manufacturing of cadmium glass construction with more than 10% efficiency
telluride (CdTe) thin-film Photovoltaic modules. On 14 [Mia 2008].
April 209 the company announced the start of commer-
cial production at their factory in Longmount (CO), which ■ Nanosolar was founded in 2001 and is based in
will have a capacity of 200 MW, if fully operational. Palo Alto. It is a privately held company with financial-
backing of private-technology-investors. According to
■ Ascent Solar Technologies Incorporated was estab- the company, Nanosolar developed nanotechnology
lished in 2005 to manufacture CIGS thin-film solar and high-yield high-throughput process technology for
modules with a roll-to-roll process. According to the a proven thin-film solar device technology based on
company, it is on track to commence full scale produc- GIGS. The company made headlines when it announced
tion on their 1.5 MW pilot line by the end of 2008. on 21 June 2006 that it has secured $ 100 million in
A 30 MW production line is planned to be completed funding and intends to build a 430 MW thin-film factory
in 2009 and for 2012 the company plans to increase [Nan 2006].
production capacity to 110 MW.
■ Power Films Inc. was founded in 1988 to develop and
■ DayStar Technologies was founded in 1997 and con- manufacture thin-film silicon solar cells. The company
ducted an Initial Public Offering in February of 2004. announced in its 2008 first half year report that it
Products are: LightFoil™ and TerraFoil™ thin-film solar continues to make progress with its strategic objective
cells based on CIGS. In addition, DayStar has its patent- of achieving 10 MW production capacity by the end of
ed ConcentraTIR™ (Total Internal Reflection) PV module 2009 and 24 MW of capacity by the end of 2010.
which has been designed to incorporate a variety of cell
material components, including wafer-Si, Spheral Si, ■ Signet Solar Inc. was incorporated in 2006. Since
thin-film CIGS and a-Si. November 2008 Signet Solar is producing PV panels
near Dresden, Germany, using a fully-integrated thin-
■ EPV SOLAR Inc. (EPV) is a solar energy company that film solar production line from Applied Materials. The
designs, develops, manufactures, and markets amorphous company plans to expand capacity in Germany to 130
silicon thin-film photovoltaic solar modules. On 1 Dec- MW by 2011 and is also planning to establish manu-
ember 2008 the company announced that EPV SOLAR facturing facilities in New Mexico USA (expected produc-
Germany GmbH started production at their 30 MW tion by early 2011). Signet India was founded in 2007
Senftenberg factory, increasing total capacity to 55 MW. and it is planned to start production there in 2010.
■ GE Energy acquired the US business assets of Astro- ■ Solo Power Inc., founded in 2006, is a California-based
Power in March 2004 for about $ 19 million [Gee 2004]. manufacturer of thin-film solar photovoltaic cells and
GE Energy (www.gepower.com) is one of the world’s modules based on CIGS. In June 2009 the company
leading suppliers of power generation and energy deliv- received certification under ANSI/UL 1703 standard.
ery technology based in Atlanta (GA). AstroPower began According to the company, they started to ramp up their
as a division of Astrosystems Inc., founded in 1983 20+ MW facility in 2008.
as an outgrowth of semiconductor work initiated at
the University of Delaware. In 1989, the company was ■ Solyndra was founded in 2005 and produces PV mod-
incorporated in Delaware. The company went bankrupt ules using their proprietary cylindrical CIGS modules
in 2003 and sales dropped from 29.7 MW in 2002 and thin-film technology. The company operates a state-
to 17 MW in 2003 and GE Energy sales recovered to of-the-art 300,000 square foot factory, which would
22 MW in 2006. For 2008 no significant production was allow production of up to 100 MW.
reported. In June 2008, GE Energy became the larg-
est shareholder in the thin-film solar start-up company ■ Suniva Inc. was founded in 2007 by Dr. Ajeet Rohatgi,
PrimeStar Solar. Director of Georgia Tech’s University Center of Excel-
lence for Photovoltaic Research and Education. On
■ Miasolé was formed in 2001 and produces flexible 4 November 2008 the company announced the start of
CIGS solar cells on a continuous, roll-to-roll production production at their 32 MW factory in Norcross (GA).
line. The company has installed two 20MW production For 2009, an expansion to 96 MW is planned.](https://image.slidesharecdn.com/pvindustrystatusreport2009-110903042424-phpapp02/85/Pv-industry-status-report-2009-71-320.jpg)
![70 | PV Status Report 2009
■ Xunlight Corporation is a technology spin-off from the flouride (SAF). MEMC's production capacity in 2008 was
University of Toledo (OH) to develop and manufacture increased to 8000 tons [Mem 2009]. The company plans
flexible and lightweight thin-film silicon solar modules. to increase capacity further to 15,000 tons in 2010
On 22 June 2009 the company announced that it [Mem 2008].
has successfully completed the installation of its first
25 MW roll-to-roll photovoltaic manufacturing equip-
ment.
6.5.8 AE Polysilicon
AE Polysilicon was founded in 2006 to manufacture polysili-
con for the solar industry. On 19 February 2008 the com-
pany broke ground on its production facility at its site at the
Keystone Industrial Port Complex (KIPC) in Fairless Hills (PA).
The initial 1,800 ton facility scheduled to start test produc-
tion in late 2008 and commercial production in 2009.
6.5.9 Hemlock Semiconductor Corporation
Hemlock Semiconductor Corporation is based in Hemlock,
Michigan. The corporation is a joint venture of Dow Corning
Corporation (63.25 %) and two Japanese firms, Shin-Etsu
Handotai Company, Ltd. (24.5 %) and Mitsubishi Materials
Corporation (12.25 %). The company is the leading provider
of polycrystalline silicon and other silicon-based products
used in the semiconductor and solar industry.
In 2007 the company had an annual production capacity of
10,000 tons of polycrystalline silicon and production at the
expanded Hemlock site (19,000 tons) started in June 2008.
A further expansion at the Hemlock site as well as a new
factory in Clarksville, Tennessee, was started in 2008 and
should bring total production capacity to 34,000 tons in 2010.
6.5.10 Hoku Scientific, Inc.
Hoku Scientific is a material science company founded in
2001 and based in Kapolei, Hawaii. The company has
three business units: Hoku Fuel Cells, Hoku Solar and Hoku
Materials.
In September 2008 Hoku Materials announced that they
hade adjusted their planning for the polysilicon manufactur-
ing plant located in Pocatello (ID) to 3,500 tons in order to
meet customer demand [Hok 2008]. Reactor demonstra-
tion was planned for the first quarter of 2009 and the plant
should become operational at full capacity in 2010. Due to
the changed economic conditions, the timeline has been
changed in June 2009.
6.5.11 MEMC Electronic Materials Inc.
MEMC Electronic Materials Inc. has its headquarters in
St. Peters, Missouri. It started operations in 1959 and the
company's products are Semiconductor-grade Wafers,
Granular Polysilicon, Ultra-high purity Silane, Trichlorosilane
(TCS), Silicon Tetraflouride (SiF4), Sodium Aluminum Tetra-](https://image.slidesharecdn.com/pvindustrystatusreport2009-110903042424-phpapp02/85/Pv-industry-status-report-2009-72-320.jpg)
![PV Status Report 2009 | 71
7. The European Union The political structure of the European Union, with 27
Member States is quite diverse and there is no unified ap-
proach towards renewable energies yet. However, during the
European Council Meeting in Brussels on 8-9 March 2007,
the Council endorsed a binding target of a 20% share of
renewable energies in the overall EU energy consumption
by 2020 and a 10% binding minimum target to be achieved
by all Member States for the share of Biofuels in overall EU
transport petrol and diesel consumption [CEU 2007].
In order to meet the new targets, the European Council
called for an overall coherent framework for renewable ener-
gies, which resulted in the Directive on the “Promotion of
the Use of Energy from Renewable Sources” [EC 2009].
This new Directive 2009/28/EC, which went into force on 25
June 2009 amends and subsequently repeals the Directives
2001/77/EC and 2003/30/EC [EC 2001, EC 2003].
The main points of the new Directive are:
■ Mandatory national overall targets and measures for
the use of energy from renewable sources, as well as
an indicative trajectory how to reach the targets;
■ National Action Plans containing targets for transport,
electricity and heating and cooling in 2020;
■ Member States shall provide for either priority access
or guaranteed access to the grid-system for electricity
produced from renewable energy sources;
■ Each Member State has to submit a report to the Com-
mission on progress in the promotion and use of energy
from renewable energy sources by 31 December 2011,
and every two years thereafter. The sixth report to be
delivered on 31 December 2021;
■ Criteria and provisions to ensure sustainable production
and use of Bioenergy and to avoid conflicts between dif-
ferent uses of biomass.
This Directive exceeds the targets set within the White
Paper “Energy for the Future: Renewable Sources of Energy”
[EC 1997] and the Green Paper “Towards a European
Strategy for the Security of Energy Supply” [EC 2000].
The goals were that renewable energies should provide 12%
of the total and 21% of electric energy in the European Union
by 2010, in order to meet the obligations of CO2-reductions
pledged in the Kyoto Protocol and to lower the dependence
on energy imports.](https://image.slidesharecdn.com/pvindustrystatusreport2009-110903042424-phpapp02/85/Pv-industry-status-report-2009-73-320.jpg)
![72 | PV Status Report 2009
The White Paper target for the cumulative Photovoltaic different current systems have to be analysed and monitored,
systems capacity installed in the European Union by 2010 also notably for the medium to longer term development.”
was 3,000 MW, or a 100-fold increase of the capacity in
1995. It was assumed that electricity generation from these “The Commission considers a co-ordinated approach to sup-
PV systems would then be in the order of 2.4 to 3.5 TWh, port schemes for renewable energy sources to be appropriate,
depending under which climatic conditions these systems based on two pillars: co-operation between countries and
are installed. The target was already achieved in 2006 and optimisation of the impact of national schemes.”
the cumulative installed capacity at the end of 2008 was
9.5 GW, more than 3 times the original target. The progress towards the 2010 targets is shown in Figure 18.
In the autumn of 2005, the Commission presented a second The new Directive indicated the overall percentage of renew-
report on the Directive 2001/77/EC containing experiences able energies for the different Member States (Fig. 19)
gained with the application and co-existence of the different as well as the indicative trajectory (Fig. 20) how to reach it
support mechanisms [EC 2005]. The report concluded that [EC 2009]. The decision on what kind of technologies to
it is too early to harmonise the support schemes for renew- utilise in order to reach the national targets is left to the
able electricity and that a co-ordinated approach should be Member States. By 30 June 2010 the Member States have
followed in order to reach the 2010 targets. to notify the Commission about their National Renewable
Energy Action Plans.
“Due to widely varying potentials and developments in differ-
ent Member States regarding renewable energies, a harmo-
nisation seems to be very difficult to achieve in the short
term. In addition, short term changes to the system might
potentially disrupt certain markets and make it more difficult
for Member States to meet their targets. Nevertheless, the
advantages and disadvantages of harmonisation towards the
Fig. 18: Electricity genera- AT
tion in TWh from renewable BE
energies in the European Union BG
Production in 2005
(Status 2005) CY Goal for share in 2010
CZ
DE
DK
EE
EL
ES
FI
FR
HU
IE
IT
LV Electricity from Wind in Germany 2008: 40.4 TWh
LT
Electricity Generation of a Nuclear Power
LU ant with 1.3 GW capacity: 9.1 TWh
MT
NL Electricitry from PV in EU 27 2008: 6.5
PL
PT
RO
SE
SK
SI
UK
0 10 20 30 40 50 60 70 80 90 100
[TWh]](https://image.slidesharecdn.com/pvindustrystatusreport2009-110903042424-phpapp02/85/Pv-industry-status-report-2009-74-320.jpg)
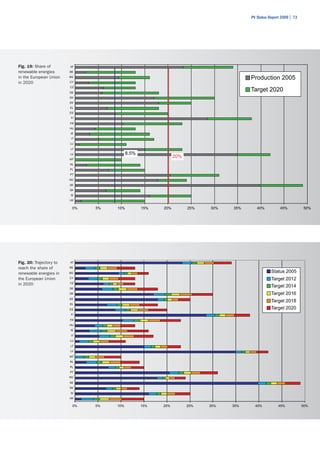
![74 | PV Status Report 2009
7.1 Market and Implementation The reason for the drastic market expansion between 2006
in the European Union and 2008 was the Spanish Government's approval of the
Plan de Energías Renovables en España (PER) for 2005 –
The market conditions for Photovoltaics differ substantially 2010 in August 2005. The objectives were to cover 12.1%
from country to country. This is due to different energy poli- of Spain's overall energy needs and 30.3% of total electricity
cies and public support programmes for renewable energies consumption with renewable energy sources by 2010. The
and especially Photovoltaics, as well as the varying grades generous feed-in tariffs set by the Royal Decree 436/2004,
of liberalisation of domestic electricity markets. Between dated 12 March 2004, started the development of the Span-
2001 and 2008, installations of Photovoltaic systems in the ish PV market. In 2007 the Royal Decree 661/2007 was
European Union increased more than ten times and reached passed with an increased cap of 1.200 MW for PV installa-
9.5 GW cumulative installed capacity at the end of 2008 tions and triggered a run on permits to install multi-mega-
(Fig. 21) [Sys 2009]. watt free-field solar Photovoltaic electricity systems. This
development led to the revision of the solar PV legislation
A total of about 24 GW of new power capacity was con- in 2008, and the new Royal Decree 1758/2008 which was
structed in the EU last year (Fig. 22) [Ewe 2009]. Out of this, approved on 26 September 2008. The new decree sets
8,480 MW (35%) was wind power; 6,930 MW (29%) gas considerably lower feed-in tariffs for new systems and limits
fired power stations; 4,590 MW (19%) PV; 2,490 MW (10%) the annual market to 500 MW with the provision that two
oil; 760 (3%) MW coal fired power stations; 470 (2%) MW thirds are rooftop mounted and no longer free field systems.
hydro, 160 MW (0.7%) biomass14, 100 MW (0.4%) CSP and
60 MW (0.3%) nuclear power capacity. The renewable share Germany was the second largest single market, with around
of new power installations was 57% in 2008. 1.5 GW. Since 2005 the market date are only estimates, as
no plant registrar exists so far. Such a registrar was finally
In 2008, Spain was the biggest market due to the almost introduced for new installations from the beginning of 2009,
five-fold increase from 560 MW in 2007 to about 2.7 GW in as the new feed-in tariffs under the 2008 revision of the
2008 [Epi 2009, Sys 2009]. This was more than twice the “Erneuerbare-Energien-Gesetz” (EEG) are now coupled to the
expected capacity and was due to an exceptional race to market size of the year before. This led to significant discrep-
install systems before the Spanish Government introduced a ancies of different estimates, which arise from the different
cap of 500 MW on the yearly installations in the autumn of data collection methods, ranging from installer surveys to
2008. grid operator surveys and inverter sales statistics. Therefore,
14
Estimated from the linear extrapolation of AEBIOM, H. Kopetz, Bioenergy markets in Europe,
Presenation at the European Union Sustainable Energy Weeks, 9 – 13 February 2009
500
Fig. 21: Cumulative installed
grid-connected PV capacity in 2,5
2008:
EU + CC. 450
Note that capacities do not
DE: 5.3 GW 2001
ES: 3.4 GW
seem to correlate with solar 400
2 2008
resources.
Cummulative installed [MW]
350 1,5
[MW]
300
1
250
0,5
200
150 0
CY SI PL IE HU RO BU MA SK LT EE LV HR TR
100
50
0
DE ES IT FR PT NL BE CZ AT LU UK EL SE FI DK CY SI PL IE HU RO BU MA SK LT EE LV HR TR](https://image.slidesharecdn.com/pvindustrystatusreport2009-110903042424-phpapp02/85/Pv-industry-status-report-2009-76-320.jpg)
![PV Status Report 2009 | 75
Fig. 22: New Nominal Capacity of the 9
different electricity generating energy
technologies installed in 2008 8
Installed Nominal Capacity [GW]
7
6
5
4
3
2
1
0
Wind Gas PV Oil Coal Hydro Biomass CSP Nuclear
it is difficult to verify the different numbers. However, it is Gestore del Sistema Elettrico (GRTN SpA.), 2.6 times more
clear that more than 50% of the EU 27 PV installations are than the 500 MW cap up to 2012. The actual installations
in Germany (Fig. 21). in 2006 were only 12.5 MW, far less than the 50 to 80 MW
predicted. On 19 February 2007 a Decreto Interministeriale
The annual statement of the German Federal Energy and was issued, which changed the national target for cumulative
Water Association (Bundesverband der Energie- und Wasser- installed PV systems from 2,000 MW in 2015 to 3,000 MW
wirtschaft – BDEW) on the kWhs actually produced report in 2016 [Gaz 2007]. This led to a steep growth in PV instal-
for 2008 4.4 TWh electricity produced by photovoltaic solar lations and 50.2 MW were installed in 2007 and 127 MW
systems [Bde 2009]. The estimate for 2009 is 5.6 TWh in 2008 [Sys 2009]. On 22 June 2009 GSE (Gestore Servizi
[Bde 2008]. Elettrici) announced that more than 500 MW of PV systems
were connected to the grid [Ges 2009]. According to the ap-
As foreseen in the “Erneuerbare-Energien-Gesetz” (EEG) the plications they received, they estimed that the total installed
feed-in tariffs were reviewed and the new law was passed capacity could increase to about 900 MW in 2009.
on 6 June 2008 by the Bundestag (Parliament) and on 4 July
2008 by the Bundesrat (Federal Council) [EEG 2004, EEG Revised feed-in tariffs in France went into force on 26 July
2009]. In the revised law, the feed-in tariffs were reduced by 2006 and resulted in a moderate growth of the French PV
more than 12% from 2008 to 2009 and the degression for market. In 2006 and 2007 just 7.6 MW and 12.8 MW were
new systems increases from 5% resp. 6.5% to 8 and 10% installed, [Sys 2008], despite the rather attractive and cost
in 2010 and 9% in 2011 and after. To limit the monetary competitive feed-in tariff for PV installations integrated in a
effects of the feed-in regime to consumers without introduc- building. Finally in 2008 installation volume picked up and
ing a cap, the law has an additional provision to increase or new systems with 44.3 MW were added [Sys 2009].
decrease the degression rate if the market growth is above
or below a certain volume in 2009, 2010 and 2011 (details In November 2009, the French Government announced a
see Table 8). new programme to substantially increase the role of renew-
able energy in France [MEE 2008]. The French Minister for
The Italian feed-in tariffs, agreed in July 2005, led to a steep Energy and the Environment, Jean-Louise Borloo stated
rise in applications in the second half of 2005 and the first that France intends to increase the use of solar generated
half of 2006, but only a moderate increase in the amount electricity 400 times by 2020 to a total installed capacity
of new systems capacity could be observed in 2006. After of 5.4 GW. The general tariff remains 0.30 €/kWh (0.40 €/
the end of the first quarter of 2006, applications with more kWh in Overseas Departments and Corsica) for 20 years.
than 1.3 GW were submitted to the “implementing body” For building-integrated PV installations, there is a supplement](https://image.slidesharecdn.com/pvindustrystatusreport2009-110903042424-phpapp02/85/Pv-industry-status-report-2009-77-320.jpg)
![76 | PV Status Report 2009
of 0.25 €/kWh (0.15 €/kWh in Overseas Departments and 2009. The new programme covers rooftop PV systems up
Corsica). However, a new tariff category for commercial build- to 10 kWp (both for residential users and small companies).
ings (0.45 €/kWh) was created and there is no size limita- The new FIT is set at 0.55 €/kWh and is guaranteed for 25
tion for commercial rooftop projects that qualify for the tariff. years, as well as being adjusted annually for inflation (25%
In addition, 50% of the investment costs for residential in- of last year’s Consumer Price Index). An annual degression
stallations are tax deductible (max. € 8,000 for singles and of 5% is foreseen for newcomers as of 2012.
€ 16,000 for couples) and a lower VAT of 5.5% on material
and installation costs is applied. Accelerated depreciation In addition to the feed-in-tariff, small residential applications
of PV systems is possible for enterprises. Regional support are eligible for a 20% tax deduction capped at € 700 per
is still possible. These tariffs remain valid until 2012 when system. Residential users do not have to be registered as
they will be revisited in the framework of a normal review “business” with the tax authorities and are exempted from
process. any tax (with the exception of the 19% VAT paid for the initial
investment). Small companies are also exempted from any
At the end of 2008 there was still a huge backlog of approx. tax as long as they keep the income from PV as untaxed re-
400 MW of applications that were awaiting connection. To serves. It is important to note that in order to be eligible for
simplify interconnection procedure of solar PV systems with this FIT, a residence has to cover part of its hot water needs
Electricté de France (EdF), the Government implemented an by some other renewable source (e.g. solar thermal). The
internet registration procedure for projects up to 450 kW. programme was only approved for the mainland grid areas.
Islands with autonomous grids will enter the programme in
The second amendment of the Ökostromgesetz (Eco electri- a second phase as soon as an extra rooftop solar capacity
city law) in Austria finally passed the Parliament on 1 August is set for each island. A “small works permit” by the build-
2008. It is foreseen that Photovoltaic electricity systems ing authorities is the only license needed before installing
with a capacity larger than 5 kW are eligible for an invest- the system. PV façades are not eligible for the new support
ment subsidy, but the total amount is limited to € 2.1 million. scheme. However, a PV façade on a commercial building
The provisions of the first amendment in 2006, stating that can still benefit from the old FIT regime (i.e. 0.45 €/kWh
electricity from all renewable energy sources is supported for 20 years).
with € 17 million per year and 10% are earmarked for PV,
were not changed. It is hoped that these measures will finally spur the Greek
PV market which has been sluggish over the last years
For 2009 € 18 million are available to support new PV systems with just 18.5 MW installed capacity at the end of 2008
with a capacity > 5 kW through the Climate & Energy Fund. [Sys 2009].
Applications can be submitted between 4 August 2009 and
30 November 2009 and the system has to be ready by 31 On 29 July 2009, the new legislation supporting renewable
July 2010 at the latest. The support is given as a lump sum energy sources and efficient co-production of heat and power
of € 2,500 per kWp for free field and roof-added systems was published in Slovakia’s Law Code [Zbi 2009]. Under this
and € 3,200 per kWp for building integrated systems. law energy companies that generate electrical energy from
renewable sources will enjoy a price guarantee for fifteen
Greece introduced a new feed-in-tariff scheme on 15 January years. The defined guarantee involves purchase prices set
2009. The tariffs will remain unchanged until August 2010 by the Regulatory Office for Network Industries (ÚRSO) and
and are guaranteed for 20 years. However, if a grid connec- obligatory purchase of this energy for the electrical energy
tion agreement is signed before that date, the unchanged transmission grid. ÚRSO determines the price for electri-
FIT will be applied if the system is finalised within the next city produced from renewable energy sources by taking into
18 months. consideration the type of the renewable energy source, the
technology used, the date of launching of the facility and
Already filed applications for permits (> 3 GW) will be served the installed capacity of the facility.
until the end of 2009. The regime for new applications is
not yet known. From then on the degression of the tariffs for In Slovenia, a new system of feed-in tariffs is under discus-
new systems will be 5% each half year. A 40% grant will still sion to be implemented in 2009. The main changes for
be available on top of the new FITs for most of the systems photovoltaics are the introduction of different tariffs for
(minimum investment eligible for grants is € 100,000). different plant sizes, as well as a differentiation in ground
mounted systems, building integrated systems and systems
In addition, a new incentives programme, without a cap added to buildings. In addition, it is planned to increase the
for small rooftop PV, was introduced in Greece on 4 June duration of the guaranteed tariffs from 10 to 15 years, as](https://image.slidesharecdn.com/pvindustrystatusreport2009-110903042424-phpapp02/85/Pv-industry-status-report-2009-78-320.jpg)
![PV Status Report 2009 | 77
Table 6: Proposed Slovenian Feed-In tariffs in €/kWh
Category < 50 kW 10 – < 1,000 kW 1 MW – < 10MW 10 MW – < 125 MW
On Building 0,415 0,380 0,315 0,281
Building Integrated 0,478 0,437 0,363 0,323
Ground mounted 0,390 0,360 0,290 0,268
Table 7: Proposed UK Feed-in tariffs in
< 4 kW < 4 kW 4 – 10 kW 10 – 100 kW 100 kW – 5 MW
(new build) retrofit & stand alone systems of all
0.31 £/kWh 0.365 £/kWh 0.31 £/kWh 0.28 £/kWh 0.26 £/kWh
0.365 €/kWh 0.429 €/kWh 0.365 €/kWh 0.329 €/kWh 0.306 €/kWh
well as to introduce a yearly degression rate of 7% for new ■ In addition, generators will benefit because they will
systems until 2013. A regular review of the technology costs have the opportunity to use that electricity on-site to
is foreseen every five years. offset some or all of the electricity they would otherwise
have had to buy.
In the UK, the Energy Act 2008 contains powers for the in-
troduction of Feed-in Tariffs for renewable electricity installa- In Table 7 the proposed UK FITs are shown. An annual
tions up to a maximum capacity of 5 MW [UKE 2008]. degression of 7% of the tariffs for new systems is foreseen.
It is planned that a feed-in tariff for renewable microgenera-
tion – this includes PV systems – will be implemented to Despite the fact that the European PV production grew again
work in conjunction with the existing scheme of Renewable by almost 60% and reached 1.9 GW, the exceptional Spanish
Obligation Certificates (ROCs) in 2010. In July 2009, the market growth and the stable large German market demand
Department of Energy & Climate Change has launched a did not change the role of Europe as a net importer of solar
“Consultation on renewable Electricity Financial Incentives cells and/or modules. Further capacity expansions and tech-
2009”. The following structure for the FITs was proposed: nology progress are necessary to change this in the future
and to secure a leading role of the European PV industry.
■ A fixed payment from the electricity supplier for every
kilowatt hour (kWh) generated (the “generation tariff”). The support measures for Photovoltaics in the European
Union Member States and Switzerland are listed in Table 8.
■ Another payment additional to the generation tariff
for every kWh exported to the wider energy market
(the “export tariff”). Generators will be guaranteed
a market for their exports at a long-term guaranteed
price. The generator may choose whether to sell
exported electricity to the supplier at this guaranteed
export tariff, or negotiate a price for exported electricity
in the open market.](https://image.slidesharecdn.com/pvindustrystatusreport2009-110903042424-phpapp02/85/Pv-industry-status-report-2009-79-320.jpg)
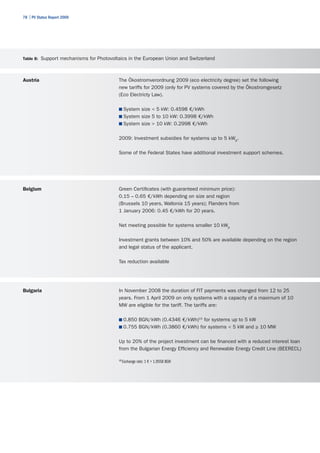
![PV Status Report 2009 | 79
Cyprus Investment grants for households, other entities and organisations, not engaged
in economic activities are limited to a maximum 55% of the eligible costs and
the maximum grant is 16.5 k€ (CY£ 9.500). For enterprises, the grant is 40% of
eligible costs and the maximum amount of the grant is 12 k€ (CY£ 7.000).
Since 2007 feed-in tariffs guaranteed for 15 years for systems up to
20 kW capacity:
Without investment subsidy
■ 0.224CYP£/kWh (0.415 €/kWh)16 for households
■ 0.196CYP£/kWh (0.363 €/kWh) for enterprises.
With investment subsidy
■ 0.12CYP£/kWh (0.222 €/kWh).
16
Exchange rate: 1 € = 0.5401 CYP
Czech Republic Feed-in tariff for 20 years. Annual prices are set by the Energy Regulator.
Producers of electricity can choose from two support schemes:
■ Fixed feed-in tariff 2009 [Cze 2008]:
Systems commissioned after 01/01/09:
≤ 30 kW: 12.890 CZK/kWh (0.497 €/kWh)17
> 30 kW: 12.790 CZK/kWh (0. 493 €/kWh
Systems commissioned in 2008: 13.730 CZK/kWh (0.530 €/kWh)
Systems commissioned between 01/01/06 and 31/12/07:
14.080 CZK/kWh (0.543 €/kWh)
Systems commissioned before 01/01/06: 6.71 CZK/kWh (0.259 €/kWh)
■ Market price + Green Bonus; Green Bonus 2009
Systems commissioned after 01/01/09:
≤ 30 kW: 11.910 CZK/kWh (0.459 €/kWh)
> 30 kW: 11.810 CZK/kWh (0.456 €/kWh
Systems commissioned in 2008: 12.750 CZK/kWh (0.492 €/kWh)
Systems commissioned between 01/01/06 and 31/12/07:
13.100 CZK/kWh (0.505 €/kWh)
Systems commissioned before 01/01/06: 5.73 CZK/kWh (0.221 €/kWh)
Income is exempt from taxes (Act No. 589/1992 on income tax)
Operators may receive subsidies under the European Structural Funds or
national programmes.
17
Exchange rate: 1 € = 25.92 CZK](https://image.slidesharecdn.com/pvindustrystatusreport2009-110903042424-phpapp02/85/Pv-industry-status-report-2009-81-320.jpg)
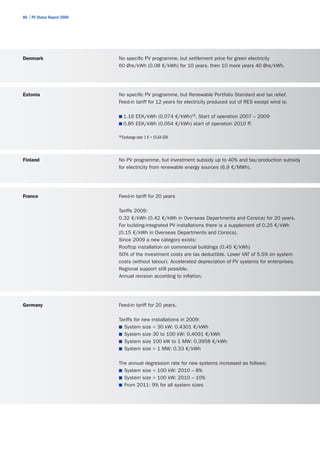
![PV Status Report 2009 | 81
Germany In addition, there is an automatic increase or decrease of the degression rate if
the installed capacity is above or below certain values in the year before. In order
to monitor this, all new systems which become operational after 1 January 2009
have to be registered in a central PV system register.
■ Increase of degression rate by 1% the following year if the following installed
capacity is exceeded:
2009: 1,500 MW, 2010: 1,700 MW, 2011: 1,900 MW
■ Decrease of degression rate by 1% the following year if the following installed
capacities are not reached:
2009: 1,000 MW, 2010: 1,100 MW, 2011: 1,200 MW
The former façade integration bonus is cancelled.
Greece In January 2009 a new feed-in-tariff regime was introduced in Greece. The tariffs
will remain unchanged until August 2010 and are guaranteed for 20 years.
However, if a grid connection agreement is signed before that date, the unchanged
FIT will be applied if the system is finalised within the next 18 months.
Already filed applications for permits (> 3 GW) will be served until the end of
2009. The regime for new applications is not yet known.
Feed-in tariff [€/kWh]:
Start of operation Mainland Grid Autonomous island grids
> 100 kWp ≤ 100 kWp > 100 kWp ≤ 100 kWp
February 2009: 0.40 0.45 0.45 0.50
August 2009: 0.40 0.45 0.45 0.50
February 2010: 0.40 0.45 0.45 0.50
August 2010: 0.392 0.441 0.441 0.49
From then on the degression of the tariffs for new systems will be 5% each
half year.
A 40% grant will still be available on top of the new FITs for most of the systems
(minimum investment eligible for grant is € 100,000).
New since 4 June 2009:
Rooftop PV systems up to 10 kWp (both for residential users and small
companies) receive 0.55 €/kWh.
Annual degression of 5% is foreseen for newcomers as of 2012.
Hungary Support for RES is regulated through the Electricity Act, which entered into force
on 1 January 2003.
From January 2008 onwards the feed-in tariff for PV is: 26.46 HUF/kWh
(0,10 €19)
19
Exchange rate: 1 € = 265 HUF](https://image.slidesharecdn.com/pvindustrystatusreport2009-110903042424-phpapp02/85/Pv-industry-status-report-2009-83-320.jpg)
![82 | PV Status Report 2009
Ireland The Alternative Energy Requirement (AER) Tender Scheme was replaced by
a new Renewable Energy Feed in Tariff (ReFIT) scheme in 2006. However, PV
is not included.
Italy Feed-in tariff guaranteed for 20 years. 2% decrease for new systems each year.
National target of 2,000 MW for 2015 was changed to 3,000 MW in 2016
[Gaz 2007].
2009 Tariffs:
Nominal Power not integrated partly integrated building integrated
1 – 3 kWp 0.392 €/kWh 0.431 €/kWh 0.480 €/kWh
3 – 20 kWp 0.372 €/kWh 0.412 €/kWh 0.451 €/kWh
> 20 kWp 0.353 €/kWh 0.392 €/kWh 0.431 €/kWh
The following additions exist:
■ 5% bonus if in the case of a non-integrated system 70% of the electricity is
used by the producer.
■ 5% bonus for all systems on schools and public health buildings, as well as for
all public buildings of communities with less than 5,000 inhabitants.
■ 5% bonus for integrated systems on farms and if cladding of asbestos cement
is substituted.
■ Reduction VAT from 20% to 10%
Latvia Feed-in tariff for RES, but not PV specific:
Licensed before 01.06.2001: double the average sales price (~ 0.101 €/kWh)
for eight years, then reduction to normal sales price.
Licensed after 01.06.2001: Regulator sets the price
The feed in system has been amended through Regulation No. 503 on Electricity
Production from RES (in force since August 2007), but without PV provisions.
A national investment programme for RES has been running since 2002.
Lithuania No specific PV support. National Control Commission for Prices and Energy
approves long-term purchase prices for renewable electricity, and grid operators
must give priority to its transport.](https://image.slidesharecdn.com/pvindustrystatusreport2009-110903042424-phpapp02/85/Pv-industry-status-report-2009-84-320.jpg)
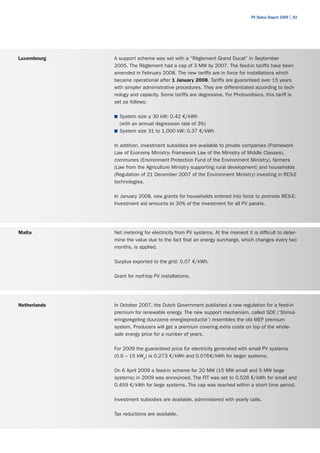
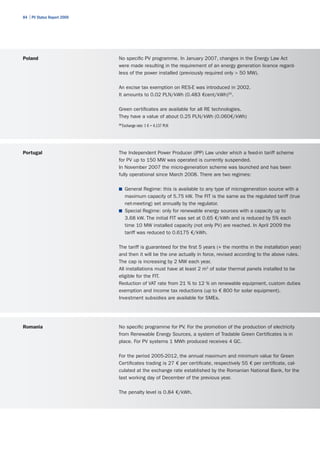
![PV Status Report 2009 | 85
Slovakia Feed-in tariff set by Regulator each year.
The new feed-in tariff for 2009 is 13.2 SKK/kWh (0.434 €/kWh21)
guaranteed for 12 years.
In addition, PV, like all other RES, qualifies for investment subsidies under the
framework of the EU Structural funds.
21
Exchange rate: 1 € = 30.396 SKK
Slovenia Feed-in tariff: either fixed-price or electricity price (3.36 €cent/kWh) + premium.
The plant size limit was removed in June 2006.
Uniform annual price Uniform annual premium
0.377 €/kWh 0.343 €/kWh
Spain New feed-in tariff with cap of 400 MW + 100 MW (addition for ground based
systems) were decided on September 2008, with a provision that two thirds of
the 400 MW installations will be on roof-tops. Current tariffs are:
■ 0.34 €/kWh < 20 kWp; building integrated and rooftop
■ 0.32 €/kWh > 20 kWp; building integrated and rooftop, max. 2 MW
■ 0.32 €/kWh ground mounted systems up to a maximum size of 10 MW
Sweden No specific PV programme. Energy tax exemption.
Switzerland New feed-in tariff in 2008 for new PV systems and those which became opera-
tional after 1 January 2006 (Current Budget cap: CHF 16 million or € 10 million).
Tariff guaranteed for 25 years. Tariff degression for new plants of 8% from 2010:
Nominal Power Ground mounted Rooftop Building integrated
[CHF/kWh (€/kWh)]22
< 10 kWp 0.65 (0.406) 0.75 (0.469) 0.90 (0.563)
10 – 30 kWp 0.54 (0.338) 0.65 (0.406) 0.74 (0.463)
30 – 100 kWp 0.51 (0.319) 0.62 (0.389) 0.67 (0.419)
> 100 kWp 0.49 (0.306) 0.60 (0.375) 0.62 (0.389)
22
Exchange rate: 1 € = 1.60 CHF
United Kingdom Investment subsidies in the framework of a PV demonstration programme.
Reduced VAT. Renewable Obligation, but not PV specific.](https://image.slidesharecdn.com/pvindustrystatusreport2009-110903042424-phpapp02/85/Pv-industry-status-report-2009-87-320.jpg)
![86 | PV Status Report 2009
As depicted in Table 8, 17 out of 27 Member States and solar resources, in some States with up to 1,600 kWh/kWp
Switzerland have already introduced feed-in tariffs. However, (Cyprus, Malta, Romania, Bulgaria, and South-East Hungary).
the efficiency of this measure to increasingly exploit these Even in the Baltic States yearly average values of more than
countries’ PV-potential varies considerably in function of the 800 kWh per year are possible for a 1 kWp system, which is
details in each national regulation. In those States where comparable to Northern Germany [Sur 2004].
the tariff does not cover the expenses, impact is very lim-
ited. In some other States there is a motivating tariff, but An important advantage for feed-in tariffs comes to light
its effectiveness is limited due to when analysing the effectiveness with which individuals
are motivated – i.e. hundreds and thousands of private
■ fulfilling the cap too early, (domestic) investors, who have relatively easy access to grid
connection, standardised accountability and last but not
■ too short a period of validity for the guaranteed least, neighbourhood pride – an ideal situation for intrinsi-
increased tariff, or cally decentralised PV-energy. Where local common action
(at village or town level) or “locally centralised” investment
■ administrative requirements being too complicated gives better revenue, the market automatically plays its
or even obstructive. efficiency-enhancing role. Developments threatening electri-
cal grid stability in terms of demand (e.g., large increase
Only in those countries in which the tariff has been high of air conditioning units in the Mediterranean EU) could be
enough to recuperate the investment cost in a reasonable compensated much more economically, ecologically and
time, and a set cap realistic enough, have PV installations in- socially balanced by decentralised generation and injection
creased and competition in production and trade developed – partly avoiding expensive grid reinforcements. In addition,
substantially. From the socio-economic data at hand, feed-in jobs would be created regionally in installation and mainte-
tariffs should be designed to potentially enable a pay-back nance businesses.
of the initial investment within 10 to 12 years and should be
combined with a built-in “sun-set”. Such a decrease of the Stable political and socio-economically viable frame condi-
guaranteed tariff by a certain percentage each year compen- tions do not only convince private and commercial investors
sates early technology users, enforces realistic price reduc- to install Photovoltaic power plants, but also stimulate the
tions, if well designed, and offers a long-term perspective for investment in new production capacities for solar cells and
investors and producers of solar systems. modules. Especially in Germany and Spain, the most dynamic
markets in Europe, the production capacities for solar cells
The New Member States and Candidate Countries still have and modules have increased faster than in the other Euro-
much lower installation figures, despite good to very good pean countries (Fig. 21). It is interesting to note that with
600
Fig. 23: 2008 annual production 2000 2005 2006 2007 2008
of the 10 largest PV manufacturers
in Europe 500
Annual Production [MW]
[Pvn 2009]
400
300
200
100
0
Photovoltech (BE)
Sovello (DE)
First Solar (DE)
ErSol (DE)
Isophoton (ES)
Solland (NE)
Q-Cells (DE)
Schott Solar (DE)
Deutsche Cell
Scancells (NW)
Others
(DE)](https://image.slidesharecdn.com/pvindustrystatusreport2009-110903042424-phpapp02/85/Pv-industry-status-report-2009-88-320.jpg)
![PV Status Report 2009 | 87
the expansion of the Italian, French and Czech markets, [Ere 2005]. In order to maintain this role, the EU needs to
also the number of solar manufacturing companies in these continue to expand the deployment of renewable energy
countries increased. technologies in the EU. Studies vary in their estimates of
the GDP impact of increasing the use of renewable energy,
Since 1999, the majority of investments in solar cell produc- some suggesting a small increase (of the order of 0.5%), and
tion facilities in Europe were made in Germany and Spain others a small decrease. Studies also suggest that support for
– the two countries that offered so far the most stable and renewable energy will lead to a small net increase in employ-
realistic legal framework conditions for citizens investing in ment. Much of the economic activity generated by support
a PV system. Only two of the current top-ten European manu- for renewable energy is located in agricultural areas, often in
facturers hold this position since 2000. peripheral regions.
Based on information provided by the industry, Greenpeace The European Council of Lisbon of March 2000 agreed in its Conclusions on a
23
and EPIA have assumed in their new study “Solar Genera- “new strategic goal for the next decade: to become the most competitive and dynamic
tion V – 2008” that 10 jobs are created per MW during knowledge-based economy in the world, capable of sustainable economic growth with
production and about 33 jobs per MW during the process more and better jobs and greater social cohesion”.
of installation [Gre 2008]. Wholesaling of the systems and
indirect supply (for example in the production process) Crude oil prices went up from US$ 26/bbl (June 2003) and spiked at US$ 147.27/
25
bbl (July 2008), source: Oil report IEA
each create 3-4 jobs per MW. Research adds another 1-2
jobs per MW. Based on this data the employment figures in
Photovoltaics for the European Union was estimated to be This is well in line with various studies about the job and
well above 100,000 in 2008. This corresponds quite well local wealth creation effect of Renewable Energies [Epi 2004,
with figures reported from 48,000 jobs [Bsw 2009] reported Ere 2004, Ike 2005]. Also the German Solar Industry As-
for Germany and 41,700 (15.400 permanent and 26,300 sociation reported that despite the fact that a significant
temporaries) for Spain [Aso 2009]. However, the Spanish amount of the solar cells installed in PV systems in Germany
Photovoltaic Industry Association estimates that the employ- are imported, more than 65% of the added value stays within
ment numbers in Spain will drop to 13,900 (11,300 perma- the German economy [Bsw 2009].
nent and 2,600 temporaries) due to the installation cap to
500 MW. For 2009 the employment figures in Photovoltaics Electricity generated with Photovoltaic systems has additio-
for the European Union were estimated to be in the range of nal positive benefits for the European economy in the long run.
85,000 to 90,000. First, with increasing installations of Photovoltaic systems,
the electricity generated can help to reduce the import
In January 2007, the European Commission published a dependency of the European Union on energy imports. The
Communication to the Council and the European Parliament results of an impact assessment of the European Commis-
entitled “Renewable Energy Road Map – Renewable Energies sion on the effectiveness of support measures for renewable
in the 21st Century: Building a More Sustainable Future” energies in the European Union quoted state [EC 2005]:
[EC 2007]. In this communication the progress of the
Member States towards achieving the Renewable Electricity Rising oil prices and the concomitant general increase in
Directive 2001/77/EC was cited as: energy prices reveals the vulnerability and dependency on en-
ergy imports of most economies. The European Commission’s
The European Union has made most progress in the electric- DG ECFIN predicts that a $ 10/bbl oil price increase from $
ity sector. Here, with policies and measures currently in place, 50 to $ 60/bbl would cost the EU about 0.3% growth and the
the European Union will probably achieve a share of 19% in US 0.35% [EC 2005a]. For the European Union, the negative
2010. However, progress has been uneven across the EU, with GDP effect would be in the order of € 41.9 billion from 2005
Member States with a stable regulatory framework performing to 2007.
best.
It is obvious that further price increases worsened the situa-
Concerning the impacts of Renewable Energy use the tion and some economic analysts claim that the 2008/2009
communication states: economic crisis could be attributed to the rapid increase
of the oil prices since 2003 and the spike in July 200825
The European Council in March 2006 decided to refocus [IEA 2008].
the Lisbon Strategy23 on jobs and growth24. The renewable
energy sector in the EU has achieved global leadership and
has a turnover of € 20 billion and employs 300 000 people
24
Presidency Conclusions of the European Council of 24 March 2006.](https://image.slidesharecdn.com/pvindustrystatusreport2009-110903042424-phpapp02/85/Pv-industry-status-report-2009-89-320.jpg)
![88 | PV Status Report 2009
There are several studies that examine the difficult issue of if the targets are met, and a figure of 100,000 jobs would be
quantifying the effect of the inclusion of RES in an energy realistic if export opportunities are exploited.”
portfolio and the reduction in the portfolio energy price. This
is in addition to the employment benefits and the economic A prerequisite for all such developments is that parallel to
benefits of avoided fuel costs and external costs (GHG), the public market introduction incentives, electricity gen-
money which could be spent within the economy and used erated by solar systems can be freely traded and attain
for local wealth creation [Awe 2003]. preferential grid access. As PV systems contribute to the
avoidance of climatically harmful greenhouse gases, it has
Second, electricity from Photovoltaic systems is generally to be ensured that electricity generated from solar systems
produced during times of peak demand, or economically be exempt from eco taxes, where applicable. In addition, one
speaking, when electricity is most expensive. In addition, has to enable PV system operators to sell green certificates
Photovoltaic electricity is produced at its best during those to CO2-producers.
times when, in the case of extreme heat and resulting water
shortages, thermoelectric power plants have to reduce their In 2006 the European Union already surpassed its own
output due to a lack of cooling water. During the extreme target of 3 GWp cumulative installed capacity for Renew-
heat-wave in July 2006, peak prices paid at the European able Electricity from Photovoltaics for 2010. In Figure 24
Electricity Exchange (EEX) spot market exceeded the feed-in the growth scenario is shown if the 2001 to 2007 growth
tariff paid in Germany. rate can be maintained (2008 is not considered due to the
exceptional circumstances in Spain). More than 15 TWh of
The continuous expansion of the production capacities for electricity could be generated in 2010. This would be 0.5%
solar cells is of particular importance in the light of the of the EU 27 total net production of electricity in 2005.
export markets for solar systems to the rural areas in Asia, The PV installation growth-rate curve in the European Union
Africa and South America, where about 2 billion people are exactly mirrors that of wind power, with a delay of approxi-
still without electricity. The Europeans should not lose this mately 12 years.
future market, also with respect to the possibility it offers for
the labour market. In June 2004 the European Photovoltaic The European PV Industry has to continue its impressive
Industry Association (EPIA) published its Photovoltaics Road- growth over the coming years, in order to maintain its mar-
map and stated therein: “Failure to act on the recommenda- ket position. This will only be achieved if reliable political
tions of this Roadmap will be a huge missed opportunity. framework conditions are created and maintained to enable
Europe will suffer the loss of its current strong market position return on investment for PV investors and the industry alike.
and potential major industry for the future. The PV industry Besides this political issue, targeted improvements of the
can be of great importance to Europe in terms of wealth and solar cell and system technology are still required.
employment, with 59,000 PV related jobs in the EU in 2010
Fig. 24: PV growth in the European Union 100000
and 2010 extrapolated from 2001 to 2007 Installed Capacity if 2001 to 2007
installations. growth rates can be maintained
> 15 GWp
Cumulative Installed Capacity [MWp]
10000
1000
White Book Target
3GWp
100
10
1
1995
1996
1997
1998
1999
2000
2001
2002
2003
2004
2005
2006
2007
2008
2009
2010](https://image.slidesharecdn.com/pvindustrystatusreport2009-110903042424-phpapp02/85/Pv-industry-status-report-2009-90-320.jpg)
![PV Status Report 2009 | 89
7.2 PV Research in Europe (FP7-ENERGY-2007-1-RTD) and on 28 June for those managed
by DG TREN (FP7-ENERGY-2007-2-TREN).
In addition to the 27 national programmes for market
implementation, research and development, the European The call motivated the research topics for Photovoltaics as
Union has been funding research (DG RTD) and demon- follows: Photovoltaics is the most capital-intensive renewable
stration projects (DG TREN) with the Research Framework source of electricity. Currently, the generation costs of grid-
Programmes since 1980. Compared to the combined connected PV electricity in Europe range from 0.25 €/kWh
national budgets, the EU budget is rather small, but it to 0.65 €/kWh, depending on both local solar irradiation and
plays an important role in creating a European Photovoltaic market conditions. The work will include the development and
Research Area. This is of particular interest and importance, demonstration of new processes for Photovoltaic equipment
as research for Photovoltaics in a number of Member States manufacturing, standardised and tested building components
is closely linked to EU funds. A large number of research and the demonstration of the multiple additional benefits of
institutions from small University groups to large research Photovoltaic electricity. Longer term strategies for next genera-
centres, covering everything from basic material research to tion Photovoltaics (both high-efficiency and low-cost routes)
industry process optimisation, are involved and contribute to will also be supported. The content of this Area takes into
the progress of Photovoltaics. In the following, only activities consideration the Strategic Research Agenda (SRA) developed
on the European level are listed, as the national or regional within the European Photovoltaic Technology Platform.
activities are too manifold to be covered in such a report.
The Commission expects the following impacts from the
The European Commission’s Research and Development research activities: Through technological improvements and
activities are organised in multi-annual Framework Program- economies of scale, the cost of grid-connected PV electricity
mes (FP), with a duration of 4 years. Support for Photovoltaic in Europe is expected to be lowered to a figure in the range of
Research Projects started in 1980. In FP4 (1994 – 1998) 0.10-0.25 €/kWh by 2020. Research and development should
85 projects were supported with a budget of € 84 million. lead to reduced material consumption, higher efficiencies and
In FP5 (1998 to 2002) the budget was increased to around improved manufacturing processes, based on environmentally
€ 120 million. In the demonstration part, around 40 projects sound processes and cycles.
were supported with € 54 million and within the research
budget 62 projects were funded with € 66 million. In FP 6 The following Projects were selected:
(2002 to 2006) the budget for PV projects fell to € 107.5
million. FP7-ENERGY-2007-1-RTD
In addition to these technology-oriented research projects, ■ APPOLON: Multi-approach for high efficiency integrated
there were Marie Curie Fellow-ships and the “Intelligent and intelligent concentrating PV modules (systems).
Energy - Europe” (EIE) Programme. The CONCERTO Initiative The project aims at the optimisation and development
launched by the European Commission was a Europe-wide of Point focus and Mirror Based Spectra Splitting Pho-
initiative proactively addressing the challenges of creating tovoltaic concentrating (CPV) systems (multi-approach).
a more sustainable future for Europe’s energy needs. MJ solar cells will be manufactured by using new materi-
CONCERTO is supervised by DG Energy and Transport and als and deposition technologies. New concepts will be
made available € 14 million for solar related projects. applied for Mirror-based spectra splitting systems which
will allow eliminating the cooling needs. Both the opti-
During the 6th Framework Programme, the PV Technology mised and the new technologies will be properly tested
Platform was established [Pho 2007]. The aim of the in order achieve reliable long life-time CPV systems
Platform is to mobilise all the actors sharing a long-term The project started on 1 July 2008 and has a duration
European vision for Photovoltaics. The Platform developed of 60 months.
the European Strategic Research Agenda for PV for the next Coordinator: CESI Ricerca Spa., Italy
decade(s) and gives recommendations for its implementa-
tion to ensure that Europe maintains industrial leadership ■ HETSI: Heterojunction solar cells based on a-Si c-Si
[Pho 2007a]. The project aims to design, develop and test novel a-
Si/c-Si hetero-junction solar cell structure concepts with
For the first time, the 7th EC Framework Programme for high efficiency.
Research, Technological Development has a duration of 7 The project covers all aspects of the value chain, from
years and runs from 2007 to 2013. The first call for projects upstream research of layer growth and deposition,
closed on 3 May 2007 for the DG RTD managed projects to module process and cell interconnection, down to](https://image.slidesharecdn.com/pvindustrystatusreport2009-110903042424-phpapp02/85/Pv-industry-status-report-2009-91-320.jpg)
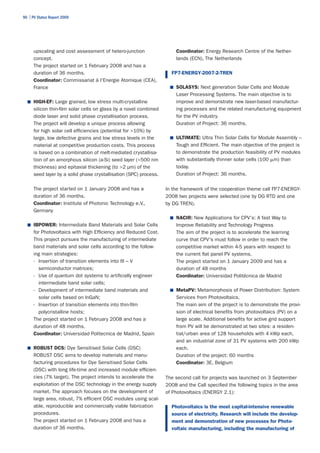
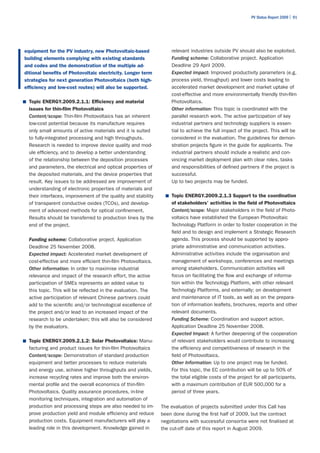
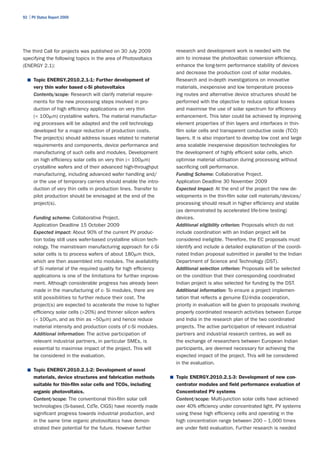
![PV Status Report 2009 | 93
to improve first the optical efficiency of the systems 7.2.1 The Strategic Energy Technology Plan
and the tracking system performance; and second to
assess the reliability and efficiency of the module as- On 22 November 2007 the European Commission unveiled
sembly in terms of electrical insulation and, stability the European Strategic Energy Technology Plan (SET-PLAN)
and durability of materials. At the end of the project the [EC 2007a]. The SET-Plan will focus, strengthen and give
overall module efficiency should be improved to 30-35 coherence to the overall effort in Europe, with the objective of
% with the aim to further reduce the cost of electric- accelerating innovation in cutting edge European low carbon
ity generation from Concentrated PV (CPV) systems. technologies. In doing so, it will facilitate the achievement of
Research and in-depth investigations on primary and the 2020 targets and the 2050 vision of the Energy Policy
secondary optics, efficient heat dissipation techniques for Europe. The Communication on the SET-Plan states:
and improved and cost effective tracking arrangements
should be performed in the project. New materials Europe needs to act now, together, to deliver sustainable,
and new concepts should be explored. In parallel to secure and competitive energy. The inter-related challenges
these development two systems of at least 25 – 50kW of climate change, security of energy supply and competitive-
capacity each should be designed and installed in an ness are multifaceted and require a coordinated response.
appropriate location in India and in Europe respectively. We are piecing together a far-reaching jigsaw of policies and
Module indoor rating as well as system’s field perform- measures: binding targets for 2020 to reduce greenhouse
ance evaluation and comparison should be carried out. gas emissions by 20% and ensure 20% of renewable energy
Modelling of the system’s technical performance should sources in the EU energy mix; a plan to reduce EU global
help the development of good practice techniques for primary energy use by 20% by 2020; carbon pricing through
CPV with special attention to the spectral effects and the Emissions Trading Scheme and energy taxation; a com-
device temperature on the average energy production. petitive Internal Energy Market; an international energy
Funding Scheme: Collaborative Project. Application policy. And now, we need a dedicated policy to accelerate the
Deadline 30 November 2009 development and deployment of cost-effective low carbon
Expected Impact: At the end of the project a new mod- technologies.
ule and CPV system should be developed and demon-
strate the required reliability according to the current Within the SET-Plan, Photovoltaics was identified as one of
qualification standards. The targeted efficiency should the key technologies and the SET-Plan calls for six differ-
be demonstrated by the system installed in India and ent European initiatives, one of them being solar. The Solar
Europe. The project should also deliver a manufacturing Europe Initiative will focus on large-scale demonstration for
cost analysis and the generation cost assessment for Photovoltaics and concentrated solar power. The draft of the
the 50 kWp systems. Solar Initiative was presented in spring 2009 and is now
Additional eligibility criterion: Proposals which do not under further negotiations.
include coordination with an Indian project will be
considered ineligible. Therefore, the EC proposals must During the 23rd European Photovoltaic Solar Energy Confer-
identify and include a detailed explanation of the coor- ence and Exhibition from 1 to 5 September 2008, the new
dinated Indian proposal submitted in parallel to Indian vision of the European Photovoltaic Industry Association
Department of Science and Technology (DST). for 2020 was presented. With the help of the SET-Plan, the
Additional selection criterion: Proposals will be selected Association aims to develop the sector in such a way that
on the condition that their corresponding coordinated up to 12% of European electricity should then be gener-
Indian project is also selected for funding by the DST. ated with Photovoltaic systems. This would correspond to
Additional information: To ensure a project implemen- up to 420 TWh of electricity or 350 GWp installed capac-
tation that reflects a genuine EU-India cooperation, ity of Photovoltaic electricity systems. To realise this new
priority in evaluation will be given to proposals involving vision, around 340 GW of new capacity have to be installed
properly coordinated research activities between Europe between 2009 and 2020. Installations of new Photovoltaic
and India in the research plan of the two coordinated systems would have to increase from around 1.6 GW per
projects. The active participation of relevant industrial annum in 2007 to 4 GW per annum in 2010 and 80 GW per
partners and industrial research centres, as well as annum in 2020. This corresponds to a CAGR of 37% over
the exchange of researchers between European Indian the next 12 years. At the same time, electricity generation
participants, are deemed necessary for achieving the costs with Photovoltaic systems will have reached grid parity
expected impact of the project. This will be considered in most of Europe by then.
in the evaluation.](https://image.slidesharecdn.com/pvindustrystatusreport2009-110903042424-phpapp02/85/Pv-industry-status-report-2009-95-320.jpg)
![94 | PV Status Report 2009
In June 2009 the European Photovoltaic Industry Associa- This list is not yet complete, but the basis for further stake-
tion published its study “SET for 2020 – Solar photovoltaic holder consultations. In addition to the research needs,
Electricty: A mainstream power source in Europe by 2020”. other issues concerning the necessary policy framework,
The study explores different deployment scenarios ranging securing human resources and a general awareness cam-
between 4 and 12%. paign were presented. A list of prerequisites included:
The intention of the SET-Plan Initiatives is that they are ■ Co-operation with other RES technologies
industry led and for this reason the European Photovoltaic
Industry Association (EPIA) is developing an outline of the ■ Interaction with utilities and grid operators
necessary measures for Photovoltaics. During a Workshop
held in Brussels on 25 September 2008, it was agreed that ■ Internalisation of external costs
all the necessary research has to be influenced by industry
needs, but that certain research topics have to be led by ■ Liberalised utility market
either industry or academia [Epi 2008]. The following catego-
risation was done: ■ Fair and transparent electricity rate structure
■ Split the responsibilities between industry and One of the boundary conditions to reach the 12% target is a
academic research favourable political framework (EU and national) in the Pre-
Industry-Lead competitive phase, as well as in the phase when Grid parity
- Upscaling is reached and beyond. The following necessary supportive
- Cost Reduction in the realm of currently national policies for the pre-competitive phase were listed:
commercialised technologies:
•modules, •BOS, •Storage (including utilities) ■ Reasonable-feed in tariffs (7-8% ROI)
- Material availability
Academia Lead ■ No caps
- Grid Integration + control and Smart Grid;
storage solutions (mainly industry lead and cooperation ■ Investment security
with utilities) this topic must be in both areas
- Next Generation technologies: high efficiency si-TF, ■ Waive of administrative barriers /simplification
organics TF, breakthrough of c-Si (tbd) (one-stop-shop)
- Material fundamentals
- Radically new manufacturing processes? ■ Priority access to the grid
(other industries)
■ Support of building codes
■ Short Term research issues
- Grid Integration and stability (BOS), Smart Grid and Supportive national policies for the grid parity phase
Storage and beyond:
- Solutions for scarce materials hindering the growth
targets (e.g. Silver, Indium, Telluride) ■ Investment security
- BIPV (as a construction element)
- Definition of Life-time, how to measure it (accurately), ■ Waive of administrative barriers/simplification
how to certify
- Macro economic model “Power Generation” ■ Priority access to the grid and grid regulation
■ Medium/ Long Term research issues ■ Support of Building codes
- Fundamental Material Research
- Next Generation PV Technology (e.g. MC-cells,
22% 50 µm )
- Focus on “expandable technologies“,
e.g. Si Thin-films –> going to high efficiency solutions
- Radically new mass production processes (e.g. print
vs. vacuum deposition; wafers without kerf loss)
- Module Lifetimes > 35 years](https://image.slidesharecdn.com/pvindustrystatusreport2009-110903042424-phpapp02/85/Pv-industry-status-report-2009-96-320.jpg)
![PV Status Report 2009 | 95
7.3 Solar Companies the United States to be operational 2011 or 2012.
Besides silicon solar cells and modules, Isofotón is very
In the following, some European solar cell manufacturers are active in developing flat-panel concentrator systems based
described briefly. This listing does not claim to be complete, on GaAs solar cells. This kind of system is favourable for
especially concerning the great number of start-up compa- areas with a high proportion of direct sunlight and for large-
nies. In addition, it has to be noted that information or data scale solar plants.
for some companies are very fragmented and limited. A lot
of the data were collected from the companies’ web-sites. 7.3.3 Photowatt
Photowatt was set up in 1979 and relocated to Bourgoin-Jallieu
7.3.1 ErSol Solar Energy AG in 1991, where the company converts silicon waste into
ErSol Solar Energy AG Erfurt, Germany was founded in 1997 the raw material used for the manufacturing of solar energy
and is a producer of polycrystalline solar cells and modules. cells. At the beginning of 1997, Matrix Solar Technologies, a
The company went public on 30 September 2005 and was subsidiary of the Canadian company, ATS (Automation Tool-
acquired by the Robert Bosch GmbH in 2008. The ErSol ing Systems), acquired Photowatt International and started
Group manufactures and distributes Photovoltaic crystal- to expand the production capacities. According to the mother
line and thin-film silicon products. In 2008 the company company ATS Automation, Photowatt has currently a pro-
had a production of 143 MW [Pvn 2009]. According to the duction capacity of 60 MW and an expansion of 25 MW is
company, production capacity at the end of 2009 will be: underway [Ats 2009]. Further expansions in the 100 MW
280 MW wafers, 280 MW crystalline solar cells and 40 MW range are planned. In 2008 Photowatt had a production of
thin-films. A further expansion to 830 MW (630 MW Si-cells 28 MW [Pvn 2009].
and 200 MW thin-films) is planned.
In late 2004, the ErSol Group expanded its marketing activi- 7.3.4 Photovoltech
ties in the field of solar modules, inverters and other compo- Photovoltech was set up in 2002 by Total, Electrabel, Soltech
nents and transferred them to Aimex-Solar GmbH, a 100% and IMEC for the manufacturing and world-wide marketing
owned subsidiary. Some of the modules sold are based on of Photovoltaic cells and modules. It is located in Tienen
solar cells that are manufactured by ErSol AG, others are (Belgium) and uses the most advanced IMEC technology.
based on third-party products purchased by ErSol AG. According to the company, current production capacity
A further expansion of the business is planned with the joint is 80 – 85 MW and an expansion of almost 400 MW to
venture company Shanghai Electric Solar Energy AG Co. Ltd., 500 MW is planned. The first phase of the current expansion
Shanghai, People's Republic of China (SESE Co. Ltd.), which will add at least 60 MW to be operational at the beginning
was established in 2005 and in which ErSol AG holds a 35% of 2010.
interest. The module production was officially opened on In 2008 the company had a production of 48 MW of poly-
28 February 2006 and ErSol is supplying SESE Co. Ltd. with crystalline solar cells [Pvn 2009].
solar cells for the manufacturing of solar modules.
7.3.5 Q-Cells AG
7.3.2 Isofotón Q-Cells AG was founded at the end of 1999 and is based
Isofotón, a private-owned company, was set up in Malaga to in Thalheim, Sachsen-Anhalt, Germany. Solar cell production
produce silicon solar cells by Professor Antonio Luque from started mid 2001 with a 12 MWp production line. In the
the Universidad Politécnica de Madrid. In 1985, Isofotón 2008 Annual Report, the company stated that the nominal
expanded their activities in the solar sector and also started capacity had increased to 950 MW by end 2008 and the
to fabricate solar collectors. In 2008 Isofotón had a produc- production of the 520 MW factory in Malaysia should start
tion of 96.5 MW and a production capacity of 180 MW [Pvn in the second quarter 2009 [Qce 2009]. 2008 production
2009]. was 570 MW.
Isofotón teamed up with the utility Endesa and GEA 21. Q-Cells broadened and diversified its product portfolio
Together with the Andalusian Department of Innovation, by investing in various other companies or forming joint
Science and Business, they plan to build the first polysilcon ventures. In the first half of 2009 Q-cells has sold some of
plant in Spain [Iso 2007]. The plant will be built in Los these holdings, e.g. REC or CSG Solar and has merged one
Barrios, Cadiz Province of Andalucía, Southern Spain. company – Sovello with Sunfilm AG. It now has one fully- and
An initial production capacity of 2,500 tons of solar grade two partially-owned subsidiaries, Solibro (CIGS), Calylyxo
polysilicon is planned for 2009 and a further expansion to GmbH (CdTe) (93%), Flexcell, Switzerland (58.11%), two joint
5000 tons in 2010. ventures Sovello (former EverQ; 33.33%) and Sunfilm AG
In 2007 Isofoton opened a module assembly factory in (50%), as well as holdings in Solaria Corp., USA (32%).
China and the company is planning to build another one in](https://image.slidesharecdn.com/pvindustrystatusreport2009-110903042424-phpapp02/85/Pv-industry-status-report-2009-97-320.jpg)
![96 | PV Status Report 2009
7.3.6 Renewable Energy Corporation AS Development of amorphous silicon solar cells started at
REC’s vision is to become the most cost-efficient solar MBB in 1980. Phototronics (PST) was founded in 1988.
energy company in the world, with a presence throughout In 1991 one of the world’s first large-area pilot production
the whole value chain. REC is presently pursuing an aggres- facilities for amorphous silicon was built. In January 2008
sive strategy to this end. Through its various group compa- the company started shipments of modules from its new
nies, REC is already involved in all major aspects of the PV 33 MW manufacturing facility for amorphous silicon thin-film
value chain. The company located in Høvik, Norway has five solar modules in Jena, Germany.
business activities ranging from silicon feedstock to solar In 2007 Wacker Chemie AG and Schott Solar founded a joint
system installations. venture, Wacker Schott Solar GmbH, to produce multicrystal-
In 2005, Renewable Energy Corporation AS (“REC”) took line silicon ingots and wafers.
over Komatsu’s US subsidiary, Advanced Silicon Materials
LLC (“ASiMI”) and announced the formation of its silicon 7.3.8 Solar World AG
division business area “REC Silicon Division”, comprising Since its founding in 1998, Solar World, Germany, has
the operations of REC Advanced Silicon Materials changed from a solar system and components dealer to
LLC (ASiMI) and REC Solar Grade Silicon LLC (SGS) [Rec a company covering the whole PV value chain from wafer
2005]. The company is expanding the Moses Plant by production to system installations.
adding 10,500 tons of new capacity. Plant III (6,500 tons) In February 2007, SolarWorld acquired an old computer
is currently in the ramp-up phase and plant IV (4,000 tons) factory from the Komatsu-Group in Hillsboro (OR), USA [Sol
is planned to be ramped-up in the first half of 2010. 2007]. The site will have developed into an integrated solar
According to the company about 6,240 tons were produced silicon wafer and solar cell production facility with a capac-
in 2008 and the production outlook for 2009 was revised ity of 250 MW by 2009+. As a consequence, the SolarWorld
to 9,000 tons. Group shifted its solar crystallisation activities from
Since 2004, ScanWafer has become a fully owned subsidi- Vancouver (WA), to Hillsboro. In the first stage of the produc-
ary. ScanWafer started wafer production at the end of 1997 tion increase, capacities will be expanded to 100 MW.
and has grown to become one of the world’s largest produc- Production capacities of the solar module factory at Camarillo
ers of multicrystalline wafers. In 2008, REC Wafer’s plants (CA) were renewed and will reach 150 MW in 2009. A further
produced wafers for approximately 580 MWp. Significant expansion of the silicon wafer production at Freiberg/Saxony
expansion projects at Herøya, Glomfjord and Singapore are to 1 GW by 2010 is on track. Solar cell production in 2008
underway and if the current expansion projects are com- was 220 MW (160 MW Germany, 61 MW U.S.) [Pvn 2009].
pleted in 2010, total production capacity should be 1.7 GW In December 2008, the joint venture between Solarworld and
[Rec 2009]. SolarPark Engineering Co. Ltd. opened its module factory, in
REC ScanCell is located in Narvik, producing solar cells. Jeonju, South Korea. The factory has a capacity of 150 MW
From the start-up in 2003, the factory has been continuously and can be expanded to 1 GW at its present location.
expanding. According to the company, production of solar In 2003 the Solar World Group was the first company world-
cells was 132 MW with a capacity at year end of 225 MWp wide to implement silicon solar cell recycling. The Solar
in 2008. Further expansion is under way in Singapore with World subsidiary, Deutsche Solar AG, commissioned a pilot
the ramp-up phase for the 550 MW facility planned for 2010 plant for the reprocessing of crystalline cells and modules.
[Rec 2009].
7.3.9 Solland Solar Energy BV
7.3.7 Schott Solar AG Solland Solar is a Dutch-German company and was regis-
Schott Solar AG is a fully owned subsidiary of Schott AG, tered in 2003. At the end of 2004 the construction of the
Mainz since 2005 when Schott took over the former joint factory went underway and start-up of production was in
venture RWE-Schott Solar, except the Space Solar Cells Divi- September 2005. At the end of 2007, production capacity
sion in Heilbronn. Schott Solar's portfolio comprises crystal- was 60 MW and increased to 170 MW in the first half year
line wafers, cells, modules and systems for grid-connected of 2008. In addition, the company is planning to expand it
power and stand-alone applications, as well as a wide range to 500 MW in 2010. Solland had a production of 52 MW in
of ASI® thin-film solar cells and modules. In 2008, the com- 2007 [Pvn 2009].
pany had a production of 145 MW (134 MW from Germany,
11 MW from US) [Pvn 2009]. For 2008 the production 7.3.10 Sovello
capacity is 220 MW. Sovello (former EverQ GmbH) is a joint venture between Q-
Schott Solar uses silicon wafers grown by Edge-Defined, Cells AG (Thalheim, Saxony-Anhalt), REC (Oslo, Norway) and
Film-Fed Growth (EFG) developed by Tyco Laboratories and Evergreen Solar Inc. (Marlboro, MA USA). In June 2006 the
the Mobil Corporation. first factory to produce 30 MW String-Ribbon™ wafers, solar](https://image.slidesharecdn.com/pvindustrystatusreport2009-110903042424-phpapp02/85/Pv-industry-status-report-2009-98-320.jpg)
![PV Status Report 2009 | 97
cells and solar modules in Thalheim, Germany, was opened. was October 2008.
The second factory with 60 MW capacity was then opened
on 19 June 2007 and in January 2008 the company laid the ■ Calyxo GmbH is a subsidiary of Q-Cells AG located in
cornerstone for a third production plant with 80 MW, bring- Wolfen, Saxony-Anhalt. The company plans to manu-
ing the total capacity to 180 MW in 2009. From 2012 the facture CdTe thin-film solar cells. The pilot plant has a
company plans to produce 600 MW. In 2008 Sovello had a production capacity of 25 MW. In 2008 the company
production of 94 MW. started a 60 MW expansion project, which is 2009 in
its ramp-up phase.
7.3.11 Sunfilm AG
Sunfilm AG was founded at the end of 2006 located in ■ Concentrix Solar GmbH was founded in 2005 as a
Großröhrsdorf, Germany. In July 2009 the company formally spin-off company of Fraunhofer Institute for Solar Energy
merged with Sontor, a subsidiary of Q-Cells. With this merger, Systems and is located in Freiburg/Breisgau. Under the
the company becomes the largest thin-film company in brand name FLATCON®, complete, turnkey concentra-
Europe using amorphous and amorphous/microcrystalline tor photovoltaic power plants on the commercial level
silicon technology with 145 MW. 85 MW are already online are offered. From 2006 until August 2008, the com-
(25 MW at the former Sontor site in Thalheim and 60 MW pany manufactured its concentrator modules on a pilot
in Großröhrsdorf). Another 60 MW are currently ramped-up production line before a commercial production line with
at Großröhrsdorf. 25 MW capacity started operation in September 2008.
7.3.12 Sunways AG ■ CSG Solar AG was founded in June 2004 by former em-
Sunways AG was incorporated in 1993 in Konstanz, Germany, ployees of Pacific Solar, together with Q-Cells and other
and went public in 2001. Sunways produces polycrystalline investors. Based in Thalheim, Germany, the company
solar cells, transparent solar cells and inverters for PV aims to produce “Crystalline Silicon on Glass” (CSG)
systems. In 2008 the company produced 33 MW. solar modules. The ownership of the CSG technology
Sunways opened its second production facility with a produc- has been acquired from Pacific Solar Pty Ltd. A pilot-line
tion capacity of 30 MW in Arnstadt, Germany on 9 September team has been developing the CSG technology since
2005. With this expansion, total production capacity rose 1995, first as part of Pacific Solar Pty Ltd, Australia,
to 46 MW. The new production facility can be expanded to and now as CSG Solar Pty Ltd., a wholly-owned subsidi-
80 MW in the future. ary of CSG Solar AG. The first factory for CSG Solar AG
opened on 15 March 2006 [Csg 2006]. Initial CSG-1
7.3.13 Würth Solar GmbH production capacity was 10 MW, but the plant was de-
Würth Solar GmbH & Co. KG was founded in 1999 with the signed for 25 MW. In April 2007 the company expanded
aim of building up Europe’s first commercial production of its work-force and moved to 24/7 operation. Current
CIS solar modules. The company is a joint venture between production capacity is given by the company as 13 MW/
Würth Electronic GmbH & Co KG and the Centre for Solar annum.
and Hydrogen Research (ZSW). Pilot production started in
the second half of the year 2000, a second pilot factory fol- ■ G24 Innovations Limited (G24i), headquartered in
lowed in 2003 increasing the production capacity to 1.3 MW. Cardiff, Wales, manufactures and designs solar
The Copper Indium Selenide (CIS) thin layer technology was modules based on Dye Sensitised Thin-film (DSTF)
perfected in a former power station to facilitate industrial- technology. In 2007 production of dye sensitised
scale manufacture. solar cells with a roll-to-roll process started.
In August 2008 the company announced the successful
ramp-up of their production facilities to 30 MW [Wür 2008]. ■ Helios Technologies located in Carmignano di Brenta
A further expansion to at least 40 MW in 2009 is planned. (PD), Italy, was established 1981 and manufactures
For 2008 a production volume of 20 MW is estimated. solar cells, modules and Photovoltaic systems. The
company produced around 5 MW solar cells in 2006
7.3.14 Additional Solar Cell Companies [Pvn 2007]. According to the company it is expanding
its production facility by 30 MW to become operational
■ AVANCIS GmbH & Co KG is a joint venture between in 2009.
Shell and Saint-Gobain. The company plans to produce
CIS thin-film solar modules in a new factory to be ■ Inventux Technologies AG was founded in spring 2007
built in Torgau, Germany. The initial annual capacity is to manufacture amorphous/microcrystalline thin-film
20 MW and the official start of commercial production silicon solar modules and broke ground for its 33 MWp](https://image.slidesharecdn.com/pvindustrystatusreport2009-110903042424-phpapp02/85/Pv-industry-status-report-2009-99-320.jpg)
![98 | PV Status Report 2009
factory in Berlin, Germany in September 2007. ■ Solibro GmbH was established early 2007 as a joint
Commercial production started at the end of 2008. venture between Q-Cells AG (67.5%) and the Swedish
Solibro AB (32.5%). In 2009 the company became a
■ Johanna Solar Technology GmbH: In June 2006 the 100% subsidiary of Q-Cells. The company develops
company started to build a factory for copper indium thin-film modules based on a Copper Indium Gallium
gallium sulphur selenide (CIGSSE) thin-film technology Diselenide (CIGS) technology. A first production line
in Brandenburg/Havel, Germany. The technology was in Thalheim, Germany, with a capacity of 30 MWp,
developed by Prof. Vivian Alberts at the University of started test production in April 2008. The ramp up of
Johannesburg. The company build up a production line the expansion to 45 MW is planned for the second half
with a nominal capacity of 30 MW. In March 2008 the of 2009. A second line, with 90 MW, is already under
company granted a license to the Chinese company construction and the start of production is planned for
Shandong Sunvim Solar Technology Co. Ltd. for the con- the end of 2009. Solibro produced 4 MW in 2008.
struction of a thin-film solar module production plant. In
November 2008 the solar cell production started and in ■ Solterra Fotovoltaico SA is located in Chiasso, Switzer-
August 2009, the Robert Bosch GmbH purchased the land and is a private company established in August
company. 1994 as a Research and Development company
focused on the development of new technologies in
■ Odersun AG was founded in 2002 and developed a renewable energy. The company produces monocrystal-
unique thin-film technology for the production of copper line solar cells.
indium sulphide based solar cells. The main investor
is Doughty Hanson Technology Ventures, London, and ■ Sulfurcell Solartechnik GmbH was incorporated in June
the company has signed an agreement with Advanced 2001 and is jointly owned by its founders and investing
Technology & Materials Co. Ltd., which is listed on partners. In 2004, the company set up a pilot plant to
the Shenzhen Stock Exchange to co-operate in August scale up the copper indium sulphide (CIS) technology
2004. The first production line was inaugurated on developed at the Hahn-Meitner-Institut, Berlin. First
19 April 2007. On 26 March 2008 the company laid prototypes were presented at the 20th PVSEC in Barce-
the cornerstone for its 30 MW expansion project. lona in 2005. Production of CIS modules started in
December 2005 and in 2006 the company had sales of
■ Pramac Ecopower is a division of the Pramac SpA 0.2 MW. For 2007, a production increase to 1 MW and
Group located in Balerna (Chiasso), Switzerland. 2008 to 5 MW was planned. It is foreseen to open the
The company manufactures mono- and polycrystalline new production site which can be expanded to 75 MW
modules and started with the production of amorphous/ in October 2009.
microcrystalline thin-film solar modules at their 30 MW
factory in July 2009. The equipment was supplied by ■ T-Solar Global, S.A. (T-Solar) was founded in October
Oerlikon Solar. 2006. In October 2009 a factory with an initial produc-
tion capacity of 40 MW was inaugurated in Ourense,
■ Scheuten Solar took over the assets of Flabeg Solar, Spain. The production plant is based on technology
Gelsenkirchen, in 2003 and is producing standard from Applied Materials and the company plans to ex-
glass-tedlar PV modules (Multisol® and custom made
) pand the capacity to 65 MW without a date set.
glass-glass PV modules (Optisol® The company is
).
developing a spheral copper indium selenide based ■ VHF Technologies SA, is located in Yverdon-les-Bains
solar cell. The pilot plant opened on 21 June 2007 and in Switzerland and produces amorphous silicon flexible
it was announced to build an industrial production plant modules on plastic film under the brand name „Flex-
with a capacity of 250 MW in 2009 [Sch 2007]. cell“. Q-Cells AG has a 57.1% share in the company.
The first production line on an industrial scale of 25
■ SOLARTEC was established in 1993 and is located in MW became operational in 2008 and is being ramped-
the industrial area of Roznov pod Radhostem, in the up in 2009.
eastern part of the Czech Republic. The company is a
producer of solar cells and modules, as well as a PV 7.3.15 Leybold Optics Solar
system integrator. In 2006 the company had a produc- Leybold Optics is one of the leading providers of vacuum
tion capacity of about 30 MW. technology, headquartered in Alzenau, Germany. Since
2001 the company has been owned by the Private Equity
Fund EQT. Leybold Optics Solar designs, manufactures and](https://image.slidesharecdn.com/pvindustrystatusreport2009-110903042424-phpapp02/85/Pv-industry-status-report-2009-100-320.jpg)
![PV Status Report 2009 | 99
installs complete production systems for the manufacturing production capacity of polysilicon at the initial plant will be
of thin-film single junction a-Si and a-Si/µc-Si tandem solar the equivalent of 500 MW per year. Commercial production
modules, along with the total project support. In addition, is planned to commence in 2010. The site will allow for
they offer various kinds of production equipment for the subsequent expansions up to an annual production capacity
solar industry. equivalent to 2,000 MW.
NorSun holds a 29.5% stake in the thin-film company
7.3.16 PV Crystalox Solar plc Sunfilm AG.
PV Crystalox Solar plc arose from the merger of Crystalox
Ltd. in Wantage near Oxford, UK, and PV Silicon AG in Erfurt, 7.3.19 Wacker Schott Solar GmbH
Germany. The product range includes: solar grade silicon; Wacker Schott Solar GmbH, a joint venture of Wacker
single crystal ingots, single crystal wafers and multicrystal- Chemie AG (Munich) and Schott Solar AG (Mainz), was
line wafers. The company went public in June 2007 and is established in 2007. In April 2008 a second factory for
listed on the London Stock Exchange. In February 2009 the the production of silicon wafers for the solar industry was
new production facility for solar-grade silicon in Bitterfeld, opened in Jena. After just six months’ construction, Wacker
Germany was opened. The annual production is expected to Schott Solar has commenced wafer production, and plans to
reach its full capacity of approximately 1,800 MT within the ramp-up the factory’s annual capacity to 50 MW by autumn
next two years. In 2008, wafer production was 230 MW. 2008. In May 2009, the company opened its new manufac-
turing building in Jena and it is expected that the full capac-
7.3.17 Elkem AS ity of 275 MW will be reached at the end of the year. Total
Elkem AS is a subsidiary of Orkla ASA, and one of Norway's solar-wafer production capacity is set to expand in stages,
largest industrial companies and the world's largest pro- reaching about 1 GW per year by 2012.
ducer of silicon metal. In 2004 Elkem acquired a 23% share
in the Renewable Energy Corporation, which was increased 7.3.20 Wacker Polysilicon
to 27.5% in 2005 and to 39.73% in 2007. Elkem Solar is Wacker Polysilicon, Burghausen, Germany is one of the
developing a cost-effective metallurgical process to produce world’s leading manufacturers of hyper-pure polysilicon for
silicon metal for the solar cell industry. Elkem is industri- the semiconductor and Photovoltaic industry, chlorosilanes
alising its proprietary solar grade silicon production line at and fumed silica. In 2008 Wacker increased its capacity to
Fiskaa in Kristiansand, Norway. According to the company, 15,000 tons and produced 11,900 tons of polysilicon.
the first plant at Fiskaa will have a capacity of 6,000 tons The company plans to increase its production capacity to
of solar grade silicon after ramp-up. 35,000 tons at the end of 2011.
7.3.18 NorSun AS 7.3.21 OERLIKON Solar
NorSun AS is a subsidiary of the technology group SCATEC The co-operation of the Institute of Microtechnology (IMT),
AS. The Norwegian start-up company was established in the University of Neuchâtel (Switzerland) and UNIAXIS, led to
2005 by Dr. Alf Bjorseth, the founder and former president of the establishment of UNAXIS Solar. In August 2006 the com-
the Renewable Energy Corporation ASA (REC). The company pany changed its name to OERLIKON Solar. UNAXIS Solar
is specialising in the production of mono-crystalline wafers started operation on 1 July 2003 with the aim to develop the
for the PV industry. According to a press release by the production technology for large-scale production of PV mod-
Finnish silicon wafer processing company, Okmetic Oyi, the ules, based on the micromorph solar cell concept developed
company signed an agreement to sell its crystal growth tech- at IMT and Unaxis’s KAI production systems.
nology to NorSun [Okm 2006]. In the meantime, Oerlikon Solar has developed into a
Ramp-up of the 185 MW facility in Årdal – Norway, has supplier of turn-key production equipment for thin-film silicon
started in autumn 2008 and full capacity is expected to be solar modules. The technology available is for amorphous
reached in 2009. In addition, NorSun has a 15 MW produc- silicon, but the amorphous/micromorph tandem cell is under
tion in Vanta, Finland and has started the building process development at the first customers.
for a 350 MW plant in Singapore in August 2008.
In January 2008, NorSun signed a joint venture agreement
with the Saudi Arabian companies Swicorp-Joussour (Swicorp)
and Chemical Development Company (CDC) [Nor 2008].
The purpose of the agreement is to establish a joint venture
company with the aim to build and operate a polysilicon
complex in the industrial city of Jubail in Saudi Arabia. The](https://image.slidesharecdn.com/pvindustrystatusreport2009-110903042424-phpapp02/85/Pv-industry-status-report-2009-101-320.jpg)

![102 | PV Status Report 2009
Before the start of the Japanese market implementation around 37 $/bbl in December 2008. However, the oil price
programme in 1997, annual growth rates of the PV markets has rebounced and is back in the 70 $/bbl range in August
were in the range of 10%, mainly driven by communication, 2009. It is obvious that the fundamental trend of increas-
industrial and stand-alone systems. Due to this programme, ing demand for oil will drive the oil price higher again. In an
the introduction of the German Feed-in Law in 1999 and the interview at the beginning of March 2009, the IEA Executive
introduction of feed-in laws all over the world the PV market Director Nobuo Tanaka warned that the next oil crisis with
has increased its growth to over 40% annually during the last oil prices at around 200 $/bbl due to a supply crunch, could
years and reached a production volume of 7.3 GWp 2008. be as close as 2013 because of lack of investments in new
oil production.
The temporary shortage in silicon feedstock, triggered by
the extremely high growth rates of the Photovoltaics industry Speculation about future oil prices range from 20 $/bbl
over the last years, resulted in the market entrance of new in the autumn of 2009 to 95 $/bbl at the end of 2010.
companies and technologies. New production plants for A Reuters poll at the end of July 2009 showed that crude
polysilicon, advanced silicon wafer production technologies, oil is expected to average around 73 $/bbl in 2010. These
thin-film solar modules and technologies, like concentrator price uncertainties are an additional risk for all our energy
concepts, were introduced into the market much faster than dependent economies and the only energy sources which
expected a few years ago. are able to reduce this risk are those which do not need
a fuel like wind or solar. Therefore, investments into solar
Even with the current economic difficulties, the increasing photovoltaic electricity systems are a bank for the future
number of market implementation programmes world-wide, and increase the attractiveness of photovoltaics.
as well as the overall rising energy prices and the pressure
to stabilise the climate, will continue to keep the demand According to investment analysts and industry prognoses,
for solar systems high. In the long-term, growth rates for solar energy will continue to grow at high rates in the coming
Photovoltaics will continue to be high, even if the economic years. The different Photovoltaic Industry Associations, as
frame conditions vary and can lead to a short-term slow- well as Greenpeace, the European Renewable Energy Council
down. This view is shared by an increasing number of finan- (EREC) and the International Energy Agency, have developed
cial institutions, which are turning towards renewables as a scenarios for the future growth of PV. The new U.S. and EPIA
sustainable and lucrative long-term investment. Increasing visions [Zwe 2007, Epi 2009] are not included, as they do
demand for energy is pushing the prices for fossil energy not have the same time horizons. Table 17 shows the differ-
resources higher and higher. Already in 2007, a number of ent scenarios of the Greenpeace/EREC study, as well as the
analysts predicted that oil prices could well hit 100 $/bbl by different 2008 IEA Energy Technology Perspectives scenarios.
the end of 2007 or early 2008 [IHT 2007]. After the spike of
oil prices in July 2008, with close to 150 $/bbl, prices have These projections show that there are huge opportunities for
decreased due to the world-wide financial crisis and hit a low Photovoltaics in the future if the right policy measures are
Table 9: Evolution of the cumulative solar electrical capacities
until 2050
[Gre 2008, IEA 2008]
Year 2000 2010 2020 2030 2050
[GW] [GW] [GW] [GW] [GW]
Greenpeace (reference scenario) 1 10 50 86 153
Greenpeace ([r]evolution scenario) 1 21 270 920 2.900
Greenpeace (advanced scenario) 1 21 290 1.500 3.800
IEA Reference Scenario 1 10 30 < 60 non competitive
IEA ACT Map 1 22 80 130 600
IEA Blue Map 1 27 130 230 1.150](https://image.slidesharecdn.com/pvindustrystatusreport2009-110903042424-phpapp02/85/Pv-industry-status-report-2009-104-320.jpg)
![PV Status Report 2009 | 103
taken, but we have to bear in mind that such a development However, the cost difference of $ 3.4 billion (€ 2.43 billion)
will not happen by itself. It will require the constant effort would just be equal on average 0.2% of annual world GDP .
and support of all stakeholders to implement the envisaged The extra cost amounts to $ 14 (€ 10) per person and year.
change to a sustainable energy supply with Photovoltaics
delivering a major part. The main barriers to such develop- The above-mentioned scenarios will only be possible if new
ments are perception, regulatory frameworks and the limita- solar cell and module design concepts can be realised, as
tions of the existing electricity transmission and distribution with current technology the demand for materials like silver
structures. would exceed the available resources within the next 30
years. Research to avoid such kind of problems is under-
The International Energy Agency’s World Energy Outlook way and it can be expected that such bottle-necks will be
2008 stated that for their current Reference Scenario, the avoided.
“Cumulative Investment in Energy-Supply Infrastructure,
2007-2030” would amount to $ 26 trillion27 (€ 18.6 trillion) The Photovoltaic industry is developing into a fully-fledged
[IEA 2008a] over $ 4 trillion (€ 2.86 million) more then pre- mass-producing industry. This development is connected to
dicted in the WEO 2007. According to this data $ 13.6 trillion an increasing industry consolidation, which presents a risk
(€ 9.7 trillion) would be needed for the electricity sector split and an opportunity at the same time. If the new large solar
roughly in equal halves for power generation and for trans- cell companies use their cost advantages to offer lower-
mission and distribution. priced products, customers will buy more solar systems and
it is expected that the PV market will show an accelerated
The new figures imply that the EU, with roughly 18.5% of the growth rate. However, this development will influence the
total world-wide electricity consumption, will have an invest- competitiveness of small and medium companies as well.
ment need of almost $ 105 billion (€ 75 billion) per year. To survive the price pressure of the big companies, made
Distributed generation of renewables can help to reduce in- possible by economies of scale that come with large produc-
vestment in transmission costs. Therefore, there is a unique tion volumes, they have to specialise in niche markets with
opportunity at the moment to use the need for an infrastruc- high value added in their products. The other possibility is to
ture overhaul to change to transmission and distribution offer technologically more advanced and cheaper solar cell
systems which will be capable of absorbing the large new concepts.
quantities of different renewable energy sources, central-
ised and decentralised all over Europe and the neighbouring Europe already reached its 2010 target in 2006 and the
countries. production volume in Europe increased again significantly.
Additional production capacities will become available over
Due to the long life-time of power plants (30 to 50 years), the next years to secure the market position. Japanese
the decisions taken now will influence the socio-economic manufacturers are increasing their capacities also consider-
and ecological key factors of our energy system in 2020 and ably, but the stagnating home market pushes them for a
beyond. In addition, the 2003 IEA study pointed out that fuel stronger export orientation where they have to compete with
costs will be in the same order of magnitude as investment the new rapidly growing PV manufacturers from China and
in infrastructure. The price development over the last five Taiwan and the new market entrants from companies located
years has exacerbated this trend and increased the scale in India, Malaysia, Philippines, Singapore, South Korea,
of the challenge, especially for developing countries. UAE, etc. Should the current trend in the field of world-wide
production capacity increase continue, Europe will only be
Two additional scenarios are shown in the World Energy able to stabilise its market share around 20%, even with a
Outlook 2008. A scenario limiting the concentration of continuation of the impressive growth rates of the last years.
Green-House Gases at 450 ppm (ACT Map) and one with At the moment it is hard to predict how the market entrance
550 ppm (Blue Map). The IEA estimates that the additional of the new players all over the world will influence future
costs for the time period from 2010 – 2030 of the ACT developments of the markets.
scenario of $ 4.1 trillion (€ 2.93 billion) are more than
covered by the fuel savings of $ 7 trillion (€ 5 trillion) dur- A lot of the future market developments, as well as production
ing the same time. In the case of the Blue Map scenario, increases, will depend on the realisation of the currently
costs of $ 9.2 trillion (€ 6.57 billion) are estimated which announced world-wide PV programmes and production
would only be compensated partially by fuel cost savings of capacity increases. During 2008 and the first half of 2009,
$ 5.8 trillion (€ 4.14 billion) due to higher electricity costs. the flood of announcements from new companies which
27
In 2007 U.S.$](https://image.slidesharecdn.com/pvindustrystatusreport2009-110903042424-phpapp02/85/Pv-industry-status-report-2009-105-320.jpg)
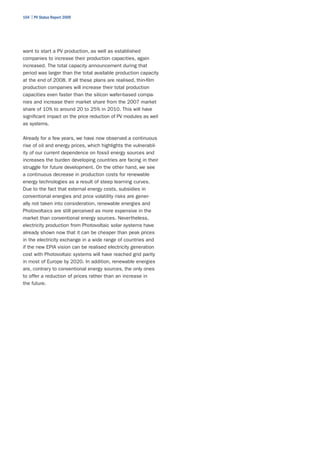


![PV Status Report 2009 | 107
10. References [Ats 2009] ATS, Annual Report 2008
[Awe 2003] Shimon Awerbuch, The True Cost of
Fossil-Fired Electricity in the EU:
A CAPM-based Approach, January 2003.
[Bde 2008] Bundesverband der Energie- und
Wasserwirtschaft,
Jahresprognose 2009, 30 September 2008
[Bde 2009] Bundesverband der Energie- und
Wasserwirtschaft,
Jahresabrechnung 2008, 27 July 2009
[Bes 2008] Best Solar Hi-Tech Company, Ltd., http://
www.bestsolarco.com/introduction.asp
[Bps 2007] BP Solar, Press Release, 16 July 2007
[Bps 2009] BP Press Release, 31 March 2009
,
[Bsw 2009] Bundesverband Solarwirtschaft, Statistische
Zahlen der deutschen Solarwirtschaft,
May 2009
[CDF 2003] China Development Forum 2003,
15 - 17 November 2003
Background Reports for China’s National
Energy Strategy 2000 to 2020
http://www.efchina.org/documents/Draft_
Natl_E_Plan0311.pdf
[CEU 2007] Council of the European Union 8 - 9 March
2007, Presidency Conclusions
7224/07, 9 March 2007
[Chi 2007] 2007 China Solar PV Report, China
Renewable Energy Industry Association,
Greenpeace China, European PV Industry
Association, and WWF,
China Environmental Science Press,
September 2007
[Cui 2007] Rong Qiang Cui, Jianqiang Wang, Qinghao Ye,
Shiquan Yan, Yang Shi, Jiabin Du,
Rapid Development of Photovoltaics in China,
2nd International Workshop on Science and
Technology of Crystalline Solar Cells, Xiamen,
China, 10 – 12 December 2007.
[Cze 2009] Czech Energy Regulator's Office, Price
Decicion 08/2008, 18 November 2008](https://image.slidesharecdn.com/pvindustrystatusreport2009-110903042424-phpapp02/85/Pv-industry-status-report-2009-109-320.jpg)
![108 | PV Status Report 2009
[Dig 2007] DigiTime, 15 August 2007 COM(2007) 723 final, {SEC(2007) 1508;
http://www.digitimes.com/news/ SEC(2007) 1509}; SEC(2007) 1510;
a20070815PD212.html SEC(2007) 1511}
[DOE 2006] U.S. DOE Strategic Plan, 2006, [EC 2009] Directive 2009/287/EC (23.04.2009);
http://www.energy.gov/about/strategicplan.htm Official Journal of the European Communities
L 140/16 (05.06.2009)
[DOE 2008] U.S. Department of Energy, April 2008,
Solar Energy Technologies Programme [Ecd 2008] Energy Conversion Devices, Press Release,
(Solar Programme): 2008-2012 Multi-Year 12 June 2008
Programme Plan
[EEG 2004] Gesetz zur Neuregelung des Rechts der
[DOE 2008a] DOE, Solar America Initiative, Erneuerbaren Energien im Strombereich
http://www1.eere.energy.gov/solar/solar_ (Erneuerbare-Energien-Gesetz – EEG);
america/publications.html#technology_ Bundesgestzblatt Jahrgang 2004 Teil I,
roadmaps Nr. 40, p.1918 (31.07.2004)
http://217.160.60.235/BGBL/bgbl1f/
[Dsi 2009] Database of State Incentives for bgbl104s1918.pdf
Renewables & Efficiency
http://www.dsireusa.org/ [EEG 2009] Gesetz zur Neuregelung des Rechts der
Erneuerbaren Energien im Strombereich
[EC 2001] Directive 2001/77/EC (27.09.2001); (Erneuerbare-Energien-Gesetz – EEG); 2009
Official Journal of the European Communities http://www.erneuerbare-energien.de/files/
L 283/42 (27.10.2001) pdfs/allgemein/application/pdf/eeg2009.pdf
[EC 2003] Directive 2003/30/EC (08.05.2003); [Eia 2009] Energy Information Administration,
Official Journal of the European Communities http://www.eia.doe.gov/fuelelectric.html
L 123/33 (17.05.2003)
[Epi 2009] European Photovoltaic Industry Association,
[EC 2005] Communication from the Commission; The Global Market Outlook for Photovoltaics until
support of electricity from renewable energy 2013, 2009
sources; COM (2005) 627 (07.12.2005),
{SEC(2005) 1571} [Epi 2004] European Photovoltaic Industry Association;
Solar Generation, October 2004
[EC 2005a] European Commission,
DG ECFIN; REP – EN – 51952. [Ere 2004] Renewable Energy Scenario to 2040 –
Half of the Global Supply from Renewables in
[EC 2007} Communication from the Commission to the 2040, EREC – European Renewable Energy
Council and the European Parliament; Council 2004
Renewable Energy Road Map – Renewable www.erec-renewables.org
energies in the 21st century: building a more
sustainable future; COM (2006) [Ere 2005] European Renewable Energy Council,
848final (07.01.2007), {SEC(2006) 1719; “Renewable Energy Targets for Europe:
SEC(2006) 1720; SEC(2007) 12} 20% by 2020”
[EC 2007a] Communication from the Commission to the [Eup 2008] EuPD Research and Ifo, Standortgutachten
Council, the European Parliament, the Photovoltaik in Deutschland,
European Economic and Social Committee Bonn – München, März 2008
and the Committee of the Regions;
A European Strategic Energy Technology Plan [Eve 2009] Evergreen Solar, Press Release, 31 July 2009
(SET-Plan) – Towards a low carbon future;
22 November 2007 [Ewe 2009] European Wind Energy Association (EWEA),
Annual Report 2008, June 2009](https://image.slidesharecdn.com/pvindustrystatusreport2009-110903042424-phpapp02/85/Pv-industry-status-report-2009-110-320.jpg)
![PV Status Report 2009 | 109
[Fir 2009] First Solar Inc., Corporate Overview Q1, 2009 [IHT 2007] International Herald Tribune, 24 July 2007
First Solar Inc., Press Release, 23 June 2009 http://www.iht.com/articles/2007/07/24/
bloomberg/bxoil.php
[Fra 2009] Stephan Franz, PV Thin-film – Will the Demand
Grow like the Supply, EuPD Research, [Ike 2005] Informationskampagne für Erneuerbare
Proceedings of the 5th OTTI User Forum Energien, Press Release, 4 July 2005,
Thin-Film Photovoltaics, Würzburg, Germany, http://www.unendlich-viel-energie.de/
January 2009, ISBN 978-3-934681-89-7 fileadmin/dokumente/Pressemitteilungen/
Pressemitteilung-050704.pdf
[Fuj 2007] Fuji Electric, Press Release, 4 October 2007 http://www.unendlich-viel-energie.de/
fileadmin/dokumente/Pressemitteilungen/
[Fuq 2003] Launching a Least-Cost Energy Development Hintergrund-Arbeitsplaetze-PK-050704.pdf
Path, Y. Fuquiang, Proceedings of the China
Development Forum 2003, [Ikk 2006] Osamu Ikki, PV Activities in Japan,
15 to 17 November 2003 Volume 12. No 7, July 2006
http://www.efchina.org/documents/
Briefing_book_031115_EN.pdf [Ikk 2009] Osamu Ikki, PV Activities in Japan,
Volume 15. No 7, July 2009
[Gaz 2007] Gazzetta Ufficiale, n. 45, 23 February 2007
[Iso 2007] Isofotón, Press Release, March 2007
[Gee 2004] GE Energy, Press Release, 31 March 2004
http://www.gepower.com/about/press/ [Jäg 2004} Arnulf Jäger-Waldau, PV Status Report 2004,
en/2004_press/033104.htm Office for Official Publications of the European
Communities,
[Ges 2009] Gestore Servizi Elettrici, Press Release, EUR 23604 EN, ISBN 92-894-8447-0
22 June 2009
http://www.gse.it/media/Comunicati [Jäg 2008] Arnulf Jäger-Waldau, PV Status Report 2008,
Stampa/Comunicati%20Stampa/ Office for Official Publications of the European
Comstampa_PV500MW.pdf Communities,
EUR 21390 EN, ISBN 978-92-79-10122-9
[Glo 2008] Global Solar Energy, Press Release,
6 March 2008 [Jap 2003] The Japan Times, 16 April 2003
http://www.japantimes.co.jp/cgi-bin/
[Gre 2008] Greenpeace International, European getarticle.pl5?nb20030416a7.htm
Renewable Energy Council (EREC), 2008,
energy [r]evolution, ISBN 9789073361898 [Jlm 2009] JLM Pacific Epoch, 14 April 2009
http://www.jlmpacificepoch.com/
[Hon 2007] Honda, Press Release, 12 November 2007 newsstories?id=145773_0_5_0_M
[Hok 2008] Hoku Scientific, Press Release, [Kan 2009] Kaneka Corporation, Press Release,
4 September 2008 8 January 2009
[IEA 2008] International Energy Agency, Oil Market [Kim 2009] Donghwan Kim, An Overview on Korean
Report, 2008 PV Market and Industry,
Proceedings of the 5th Workshop on the
[IEA 2008a] International Energy Agency, World Energy Future Direction of Photovoltaics,
Outlook 2008, 4/5 March 2009, Tokyo
ISBN-13:978 92 64 04560-6
[Kyo 2007] Kyocera Corporation, Press Release,
[IEA 2008b] International Energy Agency, 2008, 18 April 2007
Energy Technology Perspectives – Scenarios
& Strategies to 2050, ISBN 9789264041424](https://image.slidesharecdn.com/pvindustrystatusreport2009-110903042424-phpapp02/85/Pv-industry-status-report-2009-111-320.jpg)
![110 | PV Status Report 2009
[Kyo 2008] Kyocera Corporation, Press Release, [Msk 2006] MSK Corporation, Press Release,
14 November 2008 02 August 2006
http://www.msk.ne.jp/news-file/
[Kyo 2009] Kyocera Corporation, Press Release, k0000023_02.pdf
20 February 2000
[Nan 2006] Nanosolar, Press Release, 21 June 2006
[Kyo 2009a] Kyocera Corporation, Press Release, http://www.nanosolar.com/pr5-6.htm
06 March 2009
[NDR 2006] Report on the Development of the
[Mat 2007] Hiroshi Matsukawa, RTS Corporation, Photovoltaic Industry in China, China
PV Seminar at JRC Ispra, August 2007 Renewable Energy Development Project
Office, August 2006
[MEE 2008] Ministre de l’Ecologie, de l’Energie, du
Développement durable et de la Mer, [NED 2007] NEDO Brochure, Energy and Environment
Press Release, 17 November 2008 Technologies, December 2007
http://www.developpement-durable.gouv.fr/ http://www.nedo.go.jp/kankobutsu/
article.php3?id_article=3903 pamphlets/kouhou/2007gaiyo_e/
87_140.pdf
[Mem 2008] MEMC, Annual Report 2007
[New 2009] New Energy Finance, The Book of the
[Mem 2009] MEMC, Annual Report 2008 New Energy Finance Summit 2009,
May 2009
[MET 2006] METI Brochure, Energy in Japan 2006
http://www.enecho.meti.go.jp/ [New 2009a] New Energy Finance, Q2 2009 Fact Pack
energy2006E.pdf
[Nor 2008] NorSun AS, Press Release, 16 January 2008
[MET 2008] METI Press Release, 8 November 2008
http://www.meti.go.jp/english/press/data/ [Oer 2008] Oerlikon, Press Release, 14 July 2008
pdf/081111_ActionPlan.pdf
[Ohi 2009] T. Ohigashi, I. Kaizuka, H. Matsukawa,
[Mia 2008] Miasolé, Press Release, 7 July 2008 O. Ikki, Current Status and Prospects of PV
Market in Japan, Proceedings of the 5th
[Min 2009] Paula Mints, Short & Long term Prospects for Workshop on the Future Direction of
the Photovoltaic Industry during Rough Times, Photovoltaics, 4/5 March 2009, Tokyo
Global Semiconductor Forum, Macao,
12 – 14 March 2009 [Okm 2006] Okmetic Oyi, Press Release, 6 July 2006
[Mis 2005] Misawa Homes, Environmental Report 2005 [Pho 2007] PV Technology Platform;
http://www.misawa.co.jp/misawa/ http://www.eupvplatform.org/
kankyou_e/gizyutu/ayumi/2000.html
[Pho 2007a] PV Technology Platform: Strategic Research
[Mit 2008] Mitsubishi Electric Corporation, Agenda for Photovoltaic Solar Energy
Press Release, 27 August 2008 Conversion Technology, June 2007,
Luxembourg: Office for Official Publications of
[Mof 2009] Chinese Ministry of Finance, 2009 the European Communities,
http://jjs.mof.gov.cn/jinjijianshesi/ ISBN 978-92-79-05523-2
zhengwuxinxi/zhengcefagui/200903/
t20090326_126489.html [Pvn 2007] PV News 2007, April 2007
http://www.cin.gov.cn/zcfg/xgbwgz/200903/ published by The Prometheus Institute,
t20090326_187941.htm ISSN 0739-4829
[Mot 2007] Motech, http://www.motech.com.tw/
Motech_Solar.asp](https://image.slidesharecdn.com/pvindustrystatusreport2009-110903042424-phpapp02/85/Pv-industry-status-report-2009-112-320.jpg)
![PV Status Report 2009 | 111
[Pvn 2008] PV News 2008, May 2008, [Sha 2008] Sharp Corp., Press Release,
published by The Prometheus Institute, 27 November 2009
ISSN 0739-4829
[Sho 2007] Showa Shell, Press Release, 15 August 2007
[Pvn 2009] PV News 2009, April 2009,
published by The Prometheus Institute, [Sho 2008] Showa Shell Sekiyu, Press Release,
ISSN 0739-4829 17 July 2008
[Qce 2009] Q-Cells AG, Annual Report 2008 [Sic 2005] Wang Sicheng, Proceedings of the China
Renewable Energy Development Strategy
[Rab 2006] Barry G. Rabe, “Race to the Top” Workshop, 28 October 2005, Tsinghua, PRC
The Expanding Role of U.S. State Renewable
Portfolio Standards; [Sol 2001] Solar Electric Power, The US Photovoltaic
Pew Centre on Global Climate Change, Industry Roadmap, prepared by Energetics,
June 2006 Incorporated, Columbia, Maryland, under
contract to Sandia National Laboratories,
[Rec 2009] REC, Annual Report 2008 (2001)
[San 2009] Sanyo, Press Release, 16 February 2009 [Sol 2007] SolarWorld AG, Ad Hoc Message,
1 March 2007
[San 2009a] Sanyo, Press Release, 21 May 209
[Sun 2008] Suntech Power, SEC filings, 20 August 2008
[Sch 2007] Scheuten Solar, Press Release,
21 June 2007 [Sur 2004] PV Electricity Potential in EU25 Member
http://www.scheutensolar.com/media/raw/ States, M. Šúri, T. Huld, E. Dunlop, in
OpeningSunrise210607_EN_proofread.pdf “Status Report 2004 - Energy End-use
Efficiency and Electricity from Biomass,
[Sei 2004] US Photovoltaics Industry Roadmap; Wind and Photovoltaics and in The European
http://www.seia.org/ Union”,
ed. A. Jäger-Waldau, European Commission,
[Sei 2009] Solar Energy Industry Association (SEIA), DG JRC Euro Report No.
US Solar Industry Year in Review 2008, EUR 21297 EN; Luxembourg: Office for
http://www.seia.org Official Publications of the European
Communities, 2004; ISBN 92-894-8193-5
[Sem 2009] SEMI India White Paper, “The Solar PV Land-
scape in India – An Industry Perspective”, [Sys 2009] Photovoltaic Energy Barometer, Systèmes
2009, http://www.pvgroup.org/ Solaires, le journal du photovoltaique no 1 –
2009, March 2009, ISSN 0295-5873
[Sem 2009a] SEMI China White Paper, “China's Solar
Future”, 2009, http://www.pvgroup.org/ [Tat 2008] Tata BP Solar, Press Release, 17 March 2008
[Sha 2007] Sharp Corp., Press Release, 31 July 2007 [Tok 2006] Tokuyama Corporation, Fiscal 2005
Presentation, 15 May 2006
[Sha 2007a] Sharp Corp., Press Release, http://www.tokuyama.co.jp/eng/ir/report/
12 January 2007 briefing/pdf/2006mar_setsumeikai(E).pdf
[Sha 2007b] Sharp Corp., Press Release, [Tok 2008] Tokuyama Corporation, Press Release,
24 January 2007 11 September 2008
[Sha 2007c] Sharp Europe, Press Release, [UKE 2008} United Kingdom Energy Act 2008
3 September 2007 (26 November 2008), 2008 c.32](https://image.slidesharecdn.com/pvindustrystatusreport2009-110903042424-phpapp02/85/Pv-industry-status-report-2009-113-320.jpg)
![112 | PV Status Report 2009
[Ulv 2007] ULVAC Technologies, Press Release,
23 March 2007
http://www.ulvac.com/news.asp
[UNEP 2009] UNEP and New Energy Finance, 2009,
Global Trends in Sustainable Energy
Investment 2009, ISBN 978-92-807-3038
[Uni 2009] Union of Concerned Scientists, Successful
Strategies: Renewable Electricity Standards,
Fact Sheet, February 2009,
http://www.ucsusa.org/
[Wür 2008] Würth Solar GmbH, Press Release,
04 August 2008
[Yol 2008] Yole Developpment, Sample report
“Photovoltaic Report – Technology, Equipment
and Materials”, 2008
[Zwe 2007] Ken Zweibel, James Mason and Vasilis
Fthenakis, A Solar Grand Plan, Scientific
American, 16 December 2007
[Zbi 2009] Zbierka zákonov č. 309/2009
http://www.skrea.sk/fileadmin/skrea/user_
upload/dokumenty/Zakon_o_podpore_
OZE.pdf](https://image.slidesharecdn.com/pvindustrystatusreport2009-110903042424-phpapp02/85/Pv-industry-status-report-2009-114-320.jpg)
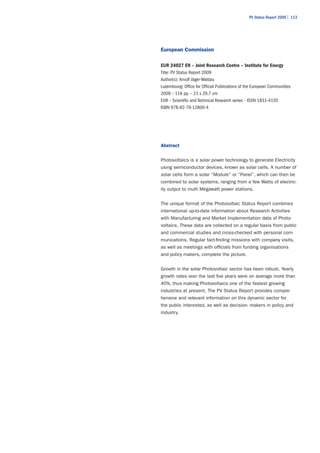

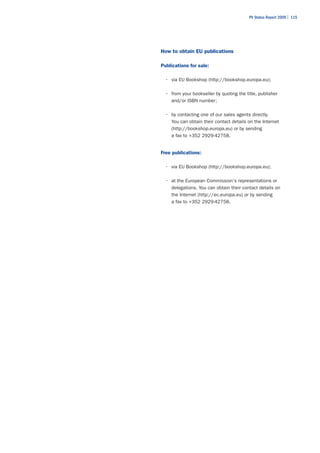

The document is a report from the Institute for Energy at the European Commission's Joint Research Centre summarizing the status of photovoltaics (PV). The Institute provides scientific and technical support for renewable energy policies and strategies. The report covers PV markets, policies, research and development, and companies in locations around the world such as Japan, China, Taiwan, the United States, and European Union countries. It aims to give an overview of current activities in PV research, manufacturing, and market implementation globally.


