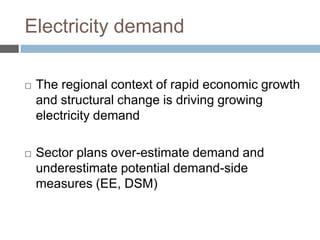
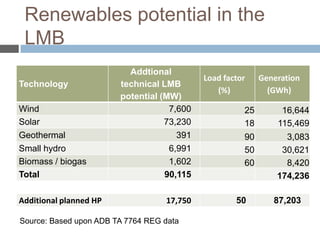
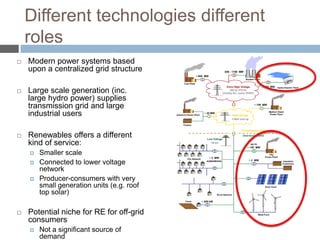
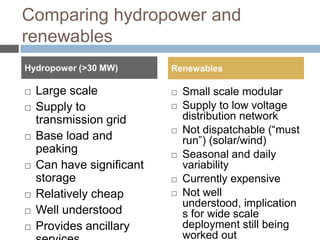
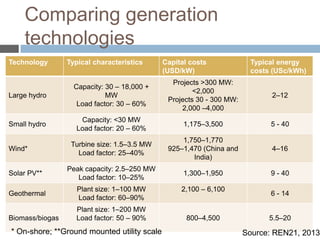
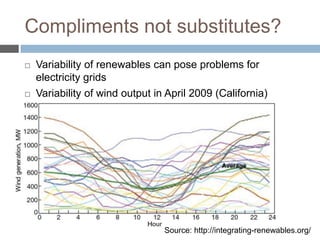
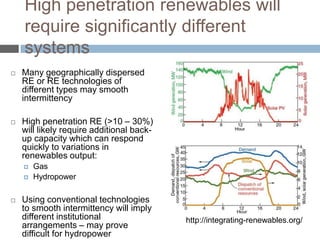
POTENTIAL FOR INCREASING
THE ROLE OF RENEWABLES IN
MEKONG POWER SUPPLY
(MK14)
CPWF Mekong Forum – Session 12, 20 November 2013

Putting hydropower and
renewables in context

John Sawdon
Contents






Part 1: Overview of the project

Part 2: Hydropower and renewables –
substitutes or complements?

Part 3: Introduction of sessions 12 and 14
Overview of the project
Project objectives


Assess the potential role of
renewables in the regional power
generation mix



Enhance the evidence base on
renewable energy potential



Identify barriers to renewable
energy having a more substantial
contribution to power supply
Scope


Project sought to build on existing work in the
region
Numerous studies of renewables policy, deployment
and potential
 More recent strategic environmental assessment of
the power sector in the GMS




Project focused upon where it was able to addvalue
Country power sector contexts extremely varied (RE
and HP capacity, available resources etc.) – facing
different challenges
 Combination of review of international
experience, secondary data collection from the region

Literature review of international experience
Renewable energy technology review

Barriers to renewable energy deployment

Case studies to „ground-truth‟ review
Cambodia

Lao PDR

Thailand

Viet Nam

Synthesis report and issues papers
Review of regional barriers to renewables
expansion and diffusion and
recommendations

Meeting energy needs: hydropower
compared with renewables
CCDE
Regional reviews and papers
Vietnam case study on
meeting peak demand with
solar PV

Cambodia study on rice
husk gasification

Project
partners
Thailand study on
current policy framework
for RE and lessons for
other countries

Lao PDR study on small
hydropower
Hydropower and renewables –
substitutes or compliments?
Technology choice in the power sector
Electricity demand


The regional context of rapid economic growth
and structural change is driving growing
electricity demand



Sector plans over-estimate demand and
underestimate potential demand-side
measures (EE, DSM)
Putting regional power
consumption growth in the global
context
Malaysia
1971 - 2011

4,500

14,000

USA
1960 - 2011

4,000

12,000

China
1971 - 2011

3,500

Korea
1971 - 2011
10,000

Thailand
1971 - 2011

kWh/capita

kWh/capita

3,000

2,500

2,000

Japan
1960 - 2011
8,000

6,000

Germany
1970 - 2011

1,500

Vietnam
1984 - 2011

4,000
1,000

2,000
500

Cambodia
1995 - 2011

0

0
0

2,000

4,000

6,000

8,000

GDP/Capita (constant 2005 USD)
Source: based on data from IEA 2013, World Bank 2013

0

10,000

20,000

30,000

40,000

GDP/Capita (constant 2005 USD)
Technology choices in the
PDPs
180

160

RE: Increase from 3.5 GW to 16.5 GW
140

Hydro: Increase from18.2 GW to 36 GW
Increase in number of plants from 69 to 16

GW

120

100

80

Could this additional 17.8 GW of hydropower
capacity be met through alternative renewab
technologies?

60

40

20

0
2012

2025

Nuclear

Coal/ lignite

Gas

Large hydro

Renewables

Cogen/others

Source: ADB TA 7764 REG
Renewables potential in the
LMB
Technology

Wind
Solar
Geothermal
Small hydro
Biomass / biogas
Total
Additional planned HP

Addtional
technical LMB
potential (MW)
7,600
73,230
391
6,991
1,602
90,115
17,750

Source: Based upon ADB TA 7764 REG data

Load factor
(%)

Generation
(GWh)

25
18

16,644
115,469

90
50
60

3,083
30,621
8,420
174,236

50

87,203
Different technologies different
roles


Modern power systems based
upon a centralized grid structure



Large scale generation (inc.
large hydro power) supplies
transmission grid and large
industrial users



Renewables offers a different
kind of service:







Smaller scale
Connected to lower voltage
network
Producer-consumers with very
small generation units (e.g. roof
top solar)

Potential niche for RE for off-grid
consumers


Not a significant source of
demand
Comparing hydropower and
renewables
Hydropower (>30 MW)











Large scale
Supply to
transmission grid
Base load and
peaking
Can have significant
storage
Relatively cheap
Well understood
Provides ancillary

Renewables










Small scale modular
Supply to low voltage
distribution network
Not dispatchable (“must
run”) (solar/wind)
Seasonal and daily
variability
Currently expensive
Not well
understood, implication
s for wide scale
deployment still being
worked out
Comparing generation
technologies
Technology

Typical characteristics

Capital costs
(USD/kW)

Typical energy
costs (USc/kWh)

Large hydro

Capacity: 30 – 18,000 +
MW
Load factor: 30 – 60%

Projects >300 MW:
<2,000
Projects 30 - 300 MW:
2,000 –4,000

2–12

Small hydro

Capacity: <30 MW
Load factor: 20 – 60%

1,175–3,500

5 - 40

Turbine size: 1.5–3.5 MW
Load factor: 25–40%

1,750–1,770
925–1,470 (China and
India)

4–16

Solar PV**

Peak capacity: 2.5–250 MW
Load factor: 10–25%

1,300–1,950

9 - 40

Geothermal

Plant size: 1–100 MW
Load factor: 60–90%

Wind*

Biomass/biogas

Plant size: 1–200 MW
Load factor: 50 – 90%

* On-shore; **Ground mounted utility scale

2,100 – 6,100

800–4,500

6 - 14

5.5–20

Source: REN21, 2013
Compliments not substitutes?




Variability of renewables can pose problems for
electricity grids
Variability of wind output in April 2009 (California)

Source: http://integrating-renewables.org/
High penetration renewables will
require significantly different
systems




Many geographically dispersed
RE or RE technologies of
different types may smooth
intermittency
High penetration RE (>10 – 30%)
will likely require additional backup capacity which can respond
quickly to variations in
renewables output:





Gas
Hydropower

Using conventional technologies
to smooth intermittency will imply
different institutional
arrangements – may prove
difficult for hydropower

http://integrating-renewables.org/
Compliments not substitutes?


Hydropower‟s flexibility in power generation can
act to smooth the variability of supply from
renewables generation – significant challenges for
the management of HP projects



Higher penetration of RE technologies may be
possible because significant hydropower capacity
in the region



This is not to say that more hydropower is
necessarily needed to enable effective integration
of renewables into grid systems - but that
synergies are likely to exist
Key messages


No simple choice exists between alternative renewables
technologies and hydropower



Medium and large hydropower projects currently fulfill different roles
in electricity systems to that which can be played by renewables



There are significant potential synergies between renewables and
hydropower – although realizing them would imply a significant
amount of work ensuring the institutional framework is in place



This may change as the economics, institutions and technologies of
regional electricity systems change



But the outcomes of these changes are far from certain – there is
still a lot to be done
Enhancing the role of
renewables










1. Technological potential and dynamic cost
considerations (Tim Suljada, ICEM)
2. Thailand‟s experience of renewable energy
policy (Jiab Tongsopit, ERI)
3. The role of solar PV in Vietnam (Nguyen
Quoc Khanh, ICEM)
4. Bridging the gap in renewables deployment
(Alex Kenny, ICEM)
5. Impacts of small hydropower on fisheries
(Garry, Thorncroft, MK15)
Thank you

Mekong Forum | 19-21 November 2013
John Sawdon (john.sawdon@gmail.com)

Putting hydropower and renewables in context

  • 1.
    POTENTIAL FOR INCREASING THEROLE OF RENEWABLES IN MEKONG POWER SUPPLY (MK14) CPWF Mekong Forum – Session 12, 20 November 2013 Putting hydropower and renewables in context John Sawdon
  • 2.
    Contents    Part 1: Overviewof the project Part 2: Hydropower and renewables – substitutes or complements? Part 3: Introduction of sessions 12 and 14
  • 3.
  • 4.
    Project objectives  Assess thepotential role of renewables in the regional power generation mix  Enhance the evidence base on renewable energy potential  Identify barriers to renewable energy having a more substantial contribution to power supply
  • 5.
    Scope  Project sought tobuild on existing work in the region Numerous studies of renewables policy, deployment and potential  More recent strategic environmental assessment of the power sector in the GMS   Project focused upon where it was able to addvalue Country power sector contexts extremely varied (RE and HP capacity, available resources etc.) – facing different challenges  Combination of review of international experience, secondary data collection from the region 
  • 6.
    Literature review ofinternational experience Renewable energy technology review Barriers to renewable energy deployment Case studies to „ground-truth‟ review Cambodia Lao PDR Thailand Viet Nam Synthesis report and issues papers Review of regional barriers to renewables expansion and diffusion and recommendations Meeting energy needs: hydropower compared with renewables
  • 7.
    CCDE Regional reviews andpapers Vietnam case study on meeting peak demand with solar PV Cambodia study on rice husk gasification Project partners Thailand study on current policy framework for RE and lessons for other countries Lao PDR study on small hydropower
  • 8.
    Hydropower and renewables– substitutes or compliments? Technology choice in the power sector
  • 9.
    Electricity demand  The regionalcontext of rapid economic growth and structural change is driving growing electricity demand  Sector plans over-estimate demand and underestimate potential demand-side measures (EE, DSM)
  • 10.
    Putting regional power consumptiongrowth in the global context Malaysia 1971 - 2011 4,500 14,000 USA 1960 - 2011 4,000 12,000 China 1971 - 2011 3,500 Korea 1971 - 2011 10,000 Thailand 1971 - 2011 kWh/capita kWh/capita 3,000 2,500 2,000 Japan 1960 - 2011 8,000 6,000 Germany 1970 - 2011 1,500 Vietnam 1984 - 2011 4,000 1,000 2,000 500 Cambodia 1995 - 2011 0 0 0 2,000 4,000 6,000 8,000 GDP/Capita (constant 2005 USD) Source: based on data from IEA 2013, World Bank 2013 0 10,000 20,000 30,000 40,000 GDP/Capita (constant 2005 USD)
  • 11.
    Technology choices inthe PDPs 180 160 RE: Increase from 3.5 GW to 16.5 GW 140 Hydro: Increase from18.2 GW to 36 GW Increase in number of plants from 69 to 16 GW 120 100 80 Could this additional 17.8 GW of hydropower capacity be met through alternative renewab technologies? 60 40 20 0 2012 2025 Nuclear Coal/ lignite Gas Large hydro Renewables Cogen/others Source: ADB TA 7764 REG
  • 12.
    Renewables potential inthe LMB Technology Wind Solar Geothermal Small hydro Biomass / biogas Total Additional planned HP Addtional technical LMB potential (MW) 7,600 73,230 391 6,991 1,602 90,115 17,750 Source: Based upon ADB TA 7764 REG data Load factor (%) Generation (GWh) 25 18 16,644 115,469 90 50 60 3,083 30,621 8,420 174,236 50 87,203
  • 13.
    Different technologies different roles  Modernpower systems based upon a centralized grid structure  Large scale generation (inc. large hydro power) supplies transmission grid and large industrial users  Renewables offers a different kind of service:     Smaller scale Connected to lower voltage network Producer-consumers with very small generation units (e.g. roof top solar) Potential niche for RE for off-grid consumers  Not a significant source of demand
  • 14.
    Comparing hydropower and renewables Hydropower(>30 MW)        Large scale Supply to transmission grid Base load and peaking Can have significant storage Relatively cheap Well understood Provides ancillary Renewables       Small scale modular Supply to low voltage distribution network Not dispatchable (“must run”) (solar/wind) Seasonal and daily variability Currently expensive Not well understood, implication s for wide scale deployment still being worked out
  • 15.
    Comparing generation technologies Technology Typical characteristics Capitalcosts (USD/kW) Typical energy costs (USc/kWh) Large hydro Capacity: 30 – 18,000 + MW Load factor: 30 – 60% Projects >300 MW: <2,000 Projects 30 - 300 MW: 2,000 –4,000 2–12 Small hydro Capacity: <30 MW Load factor: 20 – 60% 1,175–3,500 5 - 40 Turbine size: 1.5–3.5 MW Load factor: 25–40% 1,750–1,770 925–1,470 (China and India) 4–16 Solar PV** Peak capacity: 2.5–250 MW Load factor: 10–25% 1,300–1,950 9 - 40 Geothermal Plant size: 1–100 MW Load factor: 60–90% Wind* Biomass/biogas Plant size: 1–200 MW Load factor: 50 – 90% * On-shore; **Ground mounted utility scale 2,100 – 6,100 800–4,500 6 - 14 5.5–20 Source: REN21, 2013
  • 16.
    Compliments not substitutes?   Variabilityof renewables can pose problems for electricity grids Variability of wind output in April 2009 (California) Source: http://integrating-renewables.org/
  • 17.
    High penetration renewableswill require significantly different systems   Many geographically dispersed RE or RE technologies of different types may smooth intermittency High penetration RE (>10 – 30%) will likely require additional backup capacity which can respond quickly to variations in renewables output:    Gas Hydropower Using conventional technologies to smooth intermittency will imply different institutional arrangements – may prove difficult for hydropower http://integrating-renewables.org/
  • 18.
    Compliments not substitutes?  Hydropower‟sflexibility in power generation can act to smooth the variability of supply from renewables generation – significant challenges for the management of HP projects  Higher penetration of RE technologies may be possible because significant hydropower capacity in the region  This is not to say that more hydropower is necessarily needed to enable effective integration of renewables into grid systems - but that synergies are likely to exist
  • 19.
    Key messages  No simplechoice exists between alternative renewables technologies and hydropower  Medium and large hydropower projects currently fulfill different roles in electricity systems to that which can be played by renewables  There are significant potential synergies between renewables and hydropower – although realizing them would imply a significant amount of work ensuring the institutional framework is in place  This may change as the economics, institutions and technologies of regional electricity systems change  But the outcomes of these changes are far from certain – there is still a lot to be done
  • 20.
    Enhancing the roleof renewables      1. Technological potential and dynamic cost considerations (Tim Suljada, ICEM) 2. Thailand‟s experience of renewable energy policy (Jiab Tongsopit, ERI) 3. The role of solar PV in Vietnam (Nguyen Quoc Khanh, ICEM) 4. Bridging the gap in renewables deployment (Alex Kenny, ICEM) 5. Impacts of small hydropower on fisheries (Garry, Thorncroft, MK15)
  • 21.
    Thank you Mekong Forum| 19-21 November 2013 John Sawdon (john.sawdon@gmail.com)

Editor's Notes

  • #5 Research project to try to understand the potential for renewable energy in a region with abundant cheap energy generation potential through hydropower, we are asking the question: what alternatives might renewable energy offer?Aim to inform both policy makers as well as renewable energy developers and investors as well as other organisations active in the field
  • #7 Reviews of literature and documented experience on renewables internationally and in the LMBTechnology specific – technologies in use and in early stages of development internationally and potential in LMB countriesImplementation barriers – aim to answer the question: why don’t renewables comprise a higher proportion of the mix? Financial + institutionalSocial/environmental - small hydro compared to large – are impacts proportional to size of project or is it more complex than that?Case studies – each LMB country to better understand how international experience is playing out in the countries – more on next slideReports and issues paperAs well as synthesis report of all findingsPortfolio based planning, which we think may help better capture the advantages of RE because it considers fuel price and other risks into account with the aim of presenting a suite of possible scenarios with different levels of risk for planners to considerInterogate how the energy needs of the region can be met with renewable energy compared with hydropower and attempt to answer the question: to what extent can RE be a substitute for hydropower?
  • #8 Energy system based study in VietnamPolicy framework review in ThailandTwo technology based studies – in Cambodia and Lao PDR
  • #10 Sure we can bend the curve, it might be difficult, but the issue is probably more one of
  • #12 The first question to answer when considering the power sector in the region is do we need more.The short answer is yes, for the foreseeable future….
  • #13 Over 100 GW increase
  • #15 1. This shows the current and planned capacity in the four LMB countries by technology – not just MKB2. 366% increase in renewables – although it should be noted that they are only projected to meet 7% of power generated3.97% increase in HP capacity
  • #16 Of course this is technical potential, for example given that ground mounted solar would occupy approximately 2 ha per MW, that would be approximately 1465 sq.km for solar
  • #18 Costs: e.g.