Download to read offline
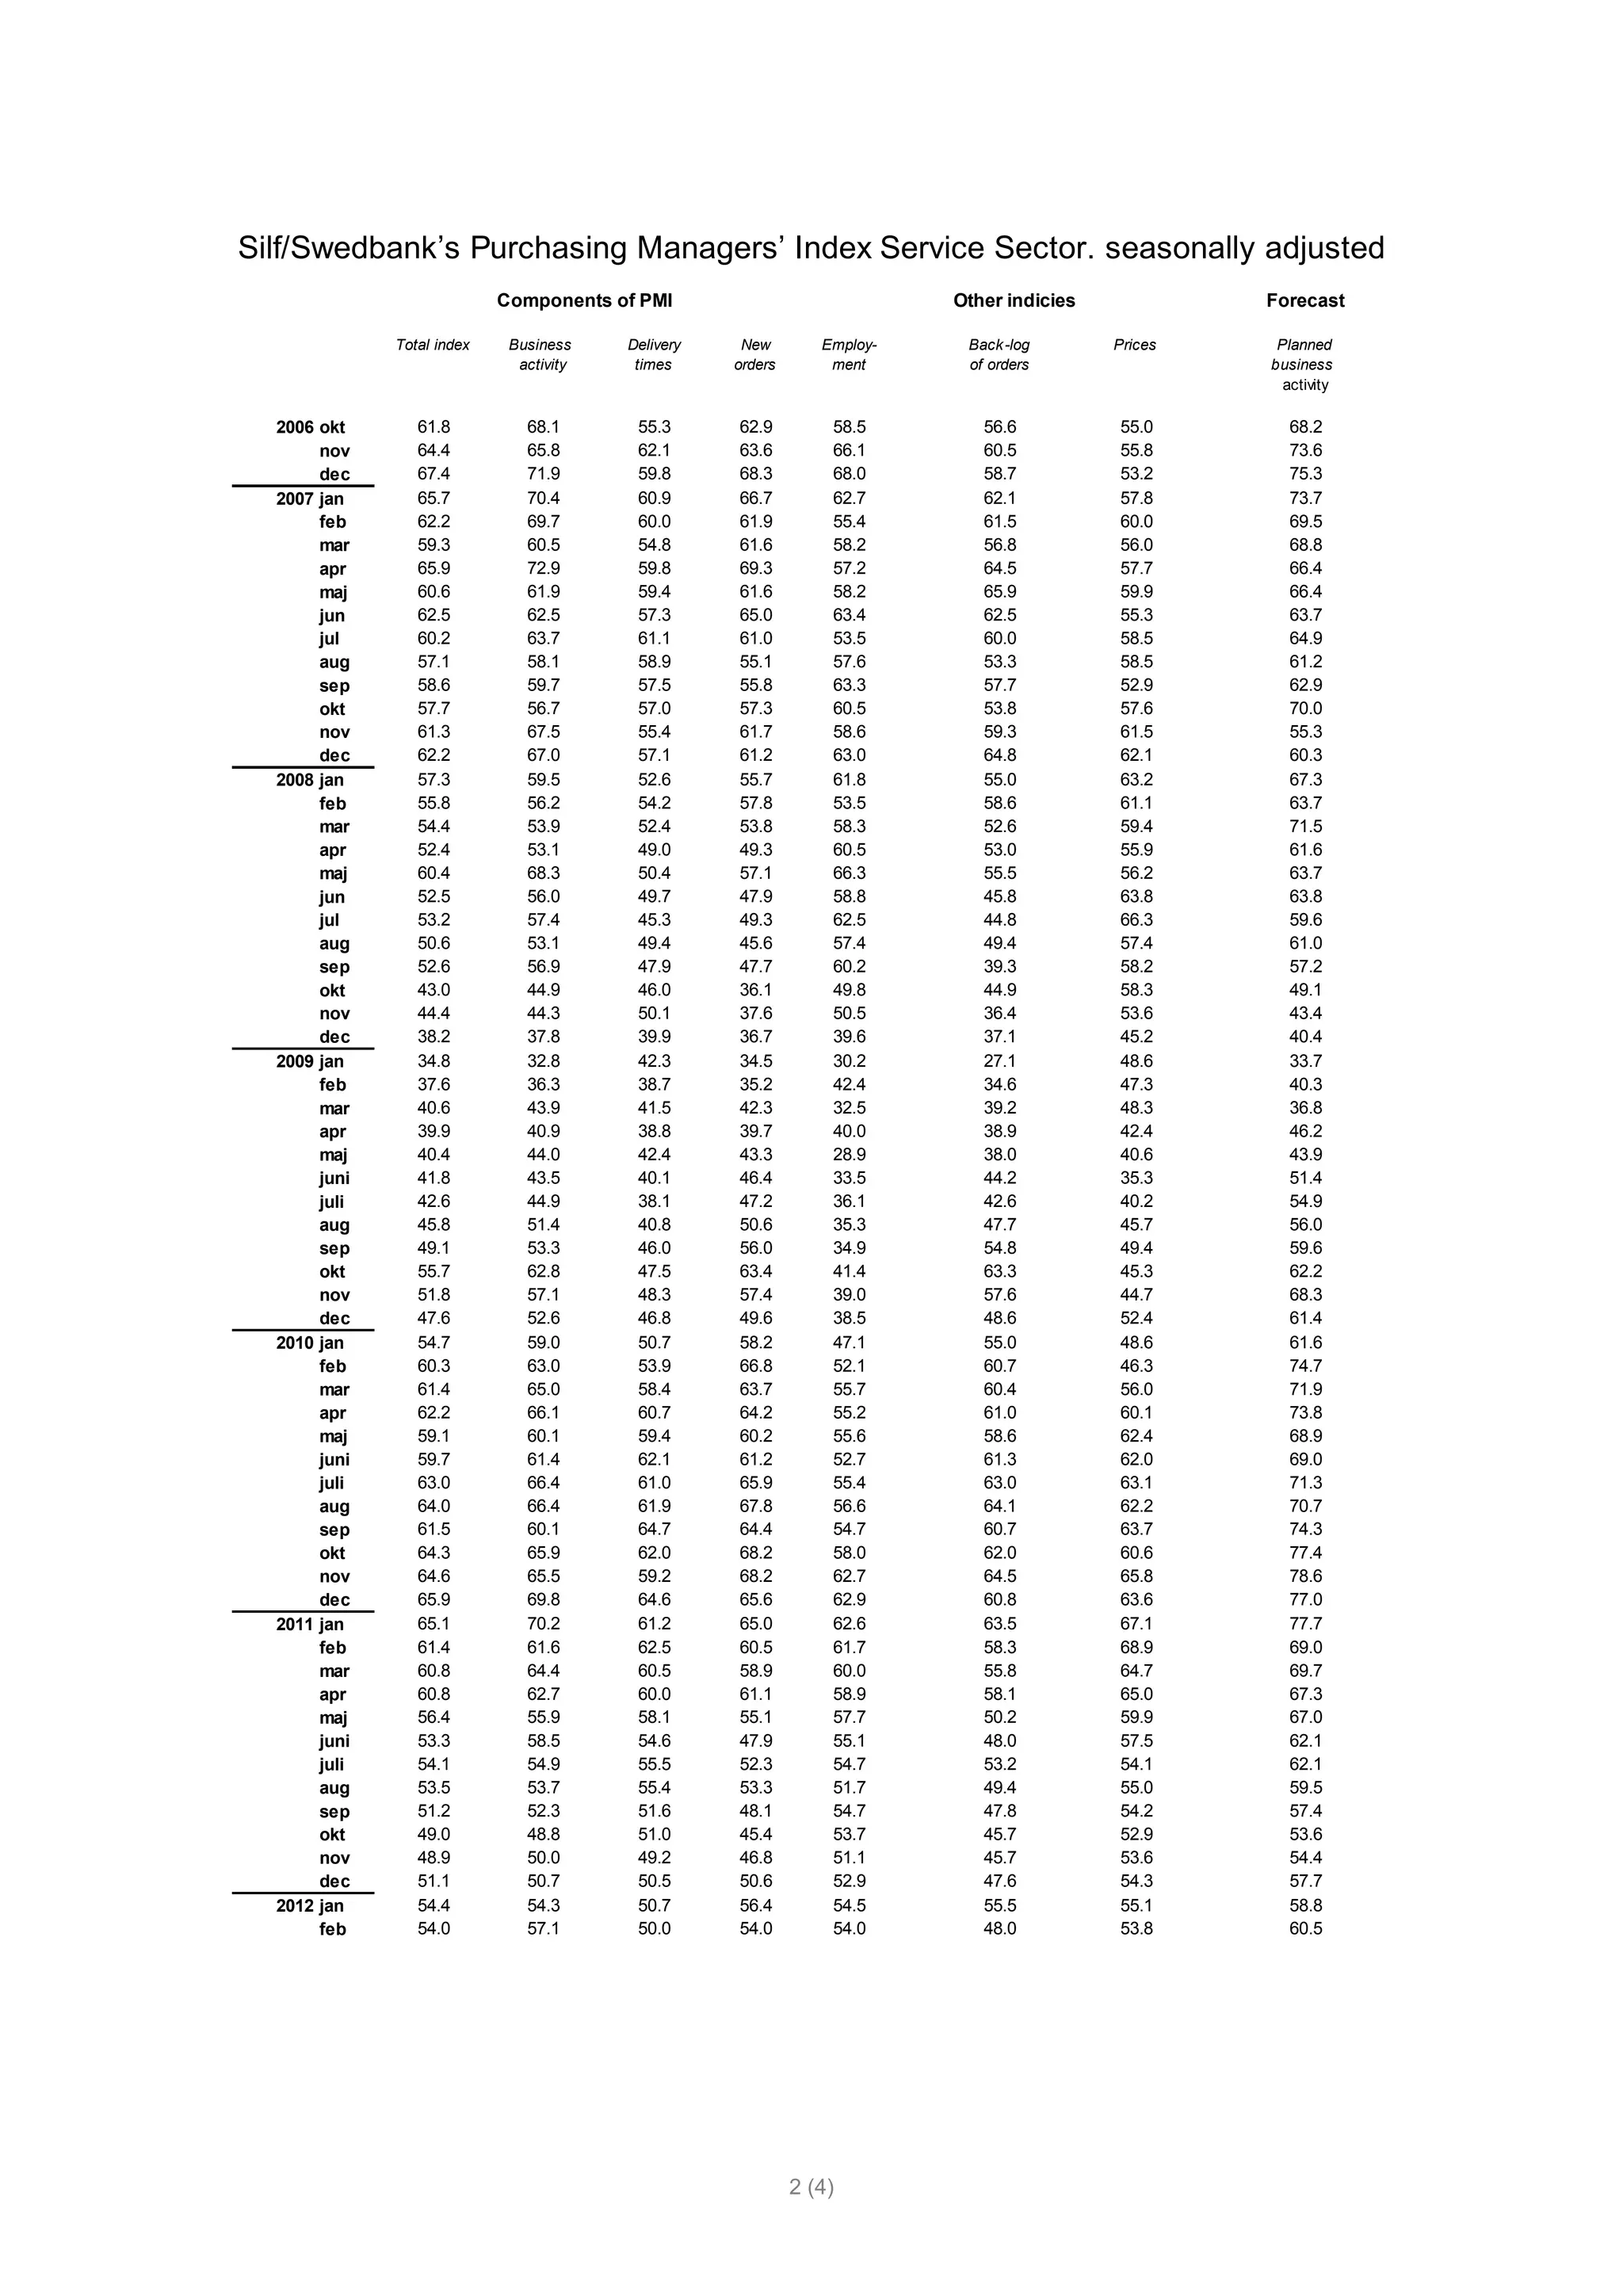
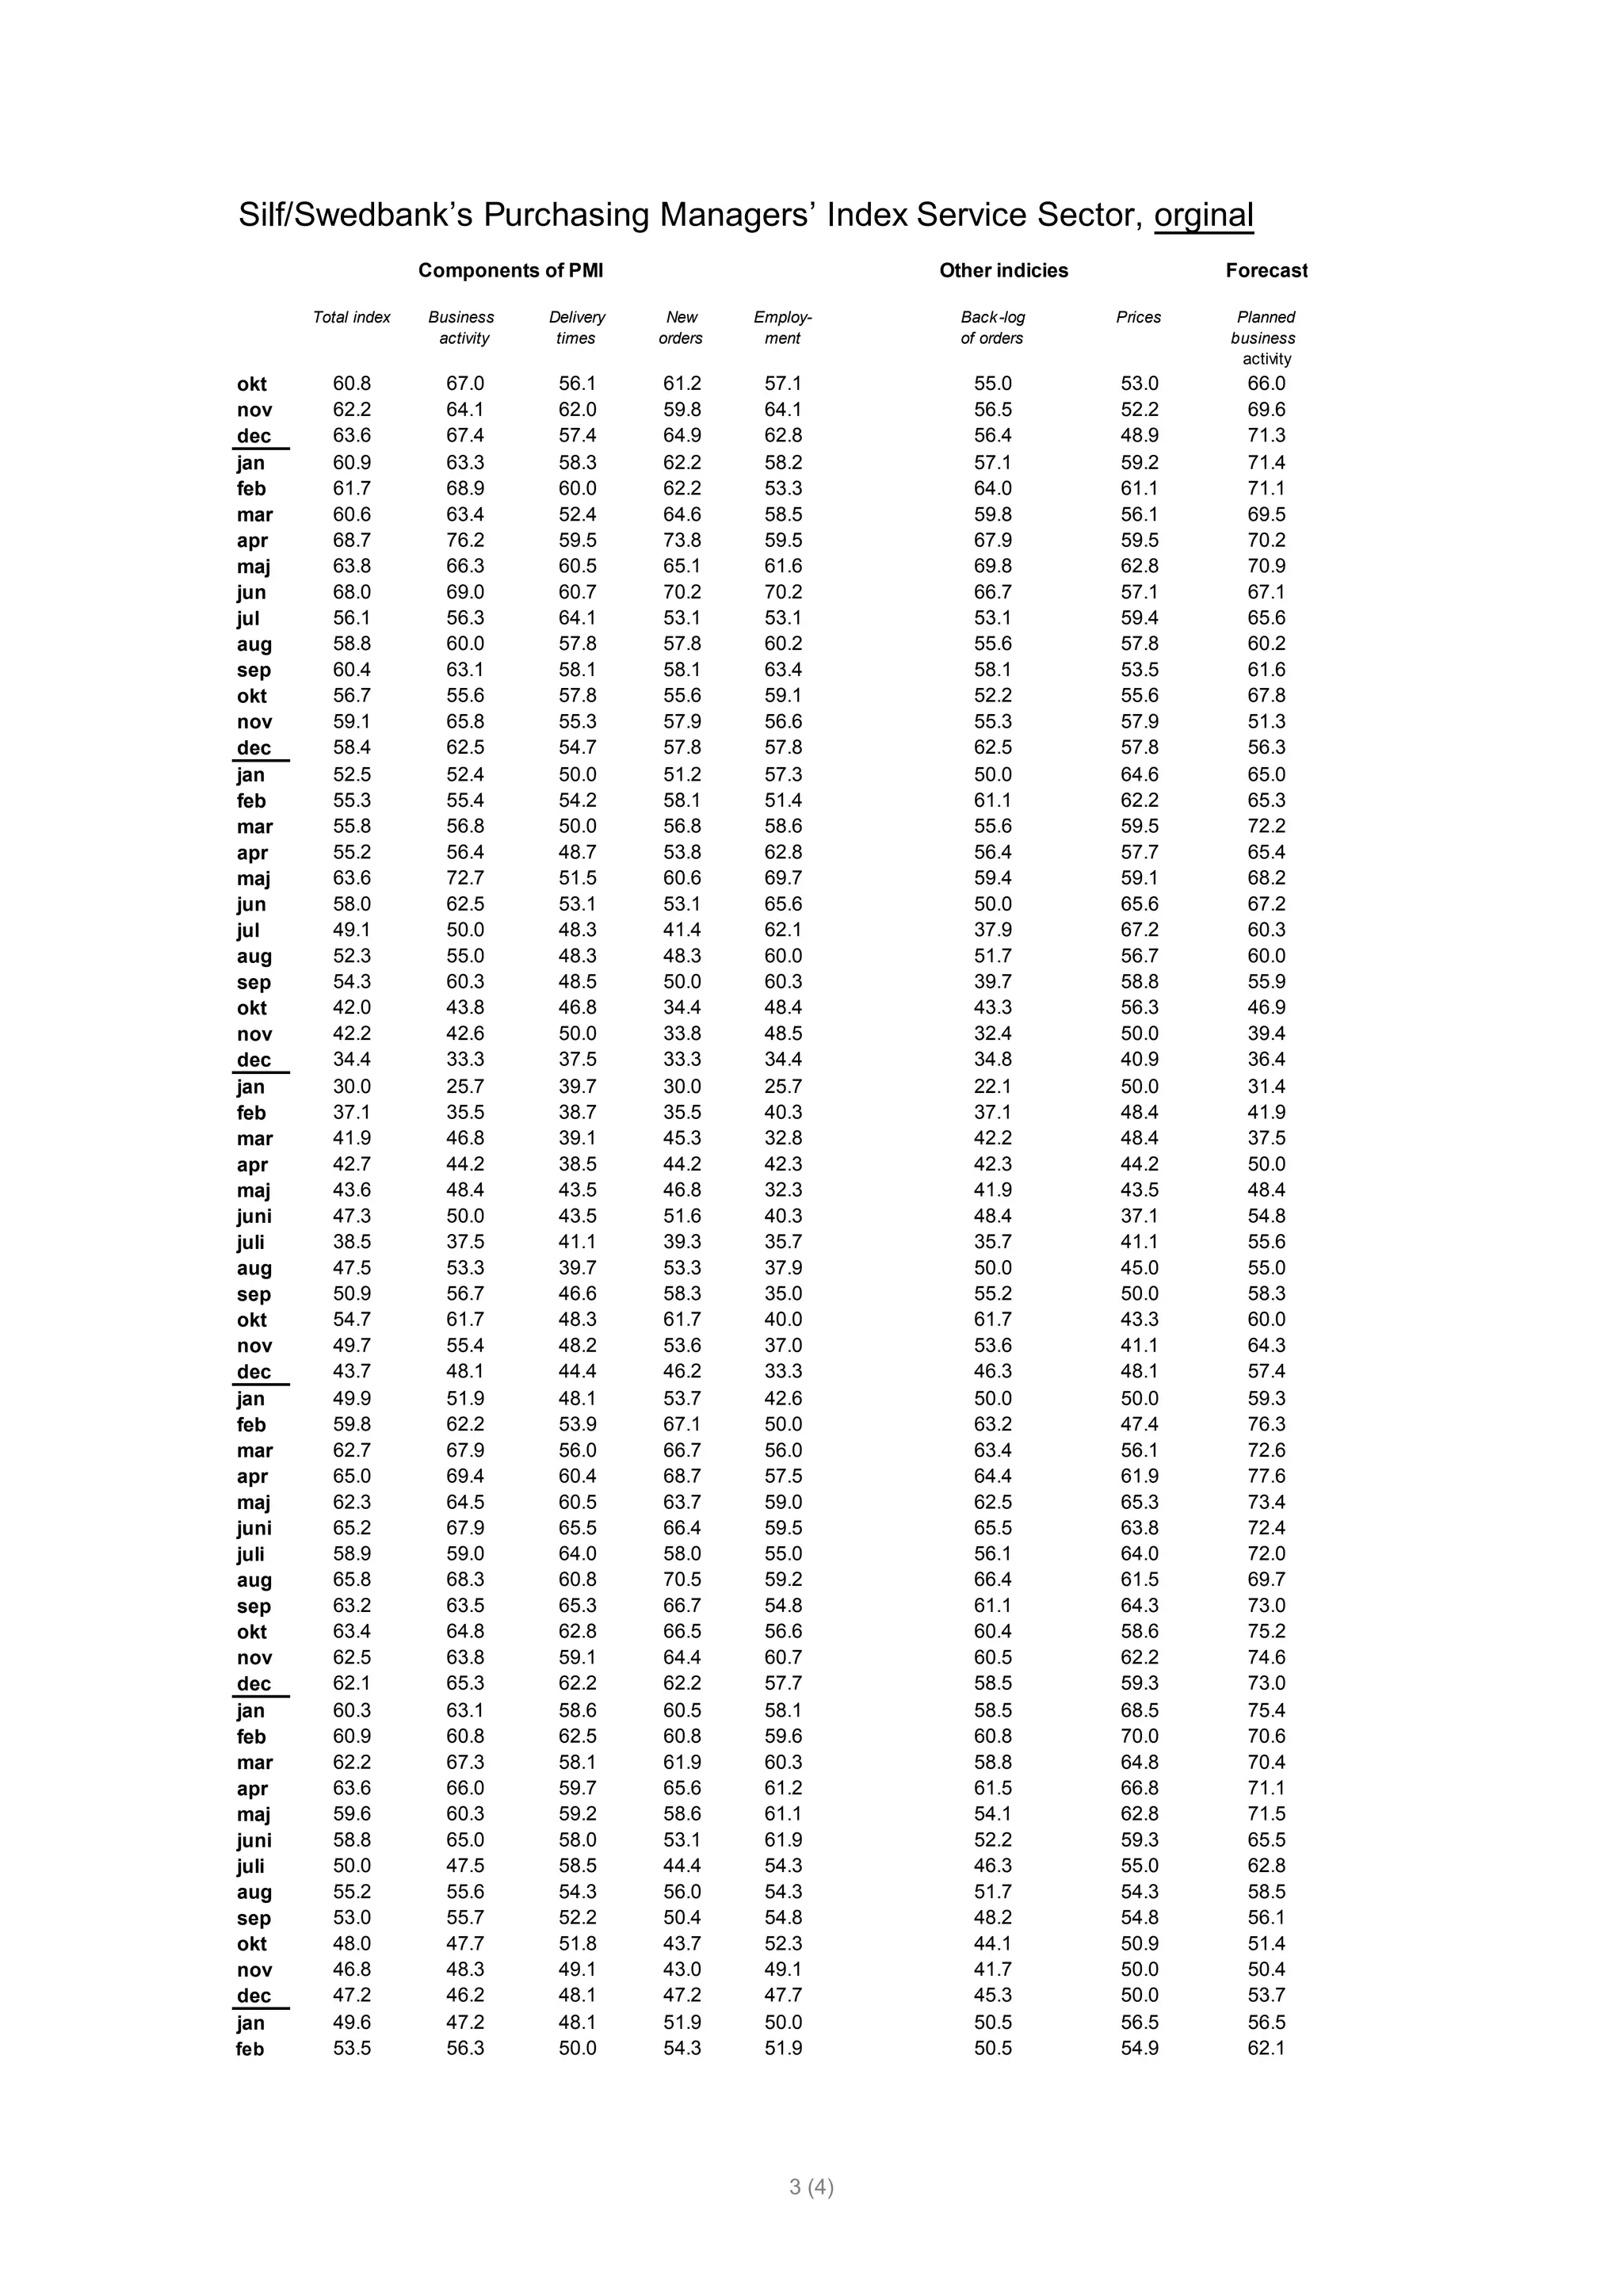

The Purchasing Managers' Index (PMI) for services decreased from 54.4 in January to 54.0 in February, indicating a slowdown in the growth of the service sector, although it remains in the expansion zone. Most component indices fell, except for business activity, which saw an increase, suggesting a positive outlook due to rising business plans. Additionally, the index for supplier prices dropped, likely influenced by a cooler overall economy and a stronger Swedish krona.


