Download as PDF, PPTX
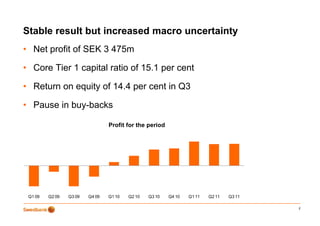
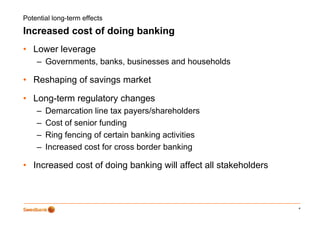
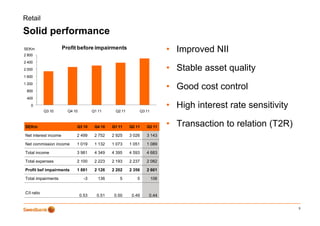
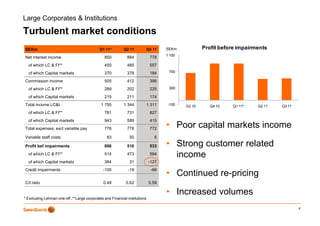
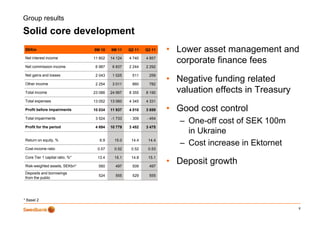
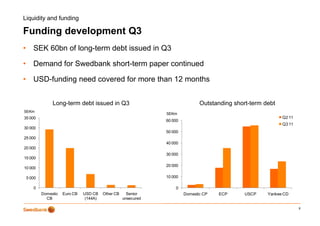
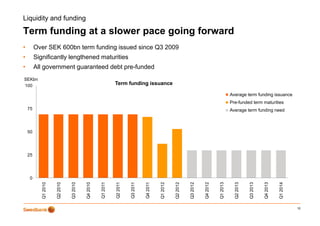
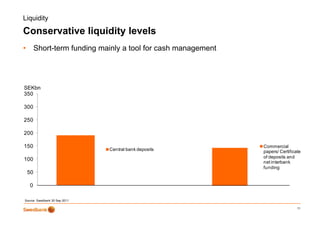
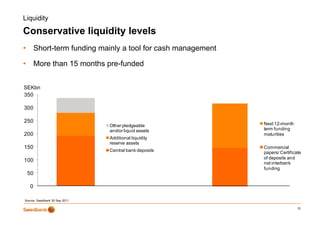
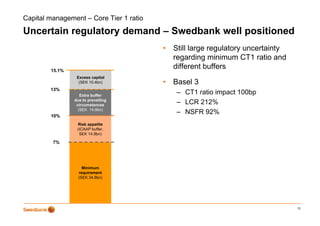
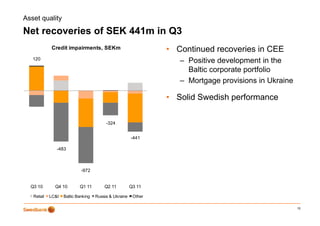
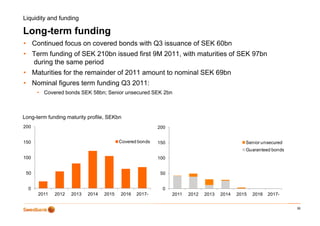

Swedbank's third quarter 2011 results showed: 1) Net profit of SEK 3.475 billion and a core Tier 1 capital ratio of 15.1%, despite increased macroeconomic uncertainty. 2) Retail banking saw a solid performance with improved net interest income, stable asset quality, good cost control, and high interest rate sensitivity. 3) The group results demonstrated solid core development, with lower fees offset by good cost control and deposit growth, despite negative treasury valuation effects. 4) Liquidity and funding remained strong, with SEK 60 billion in long-term debt issued in Q3 covering USD funding needs for over 12 months.


