The Latvian Economy - No 1, January 17, 2012
•
1 like•206 views

The Latvian Economy - No 1, January 17, 2012: Strong export-driven investment growth in 2011

Recommended
Recommended
More Related Content
What's hot
What's hot (19)
Viewers also liked
Viewers also liked (9)
Similar to The Latvian Economy - No 1, January 17, 2012
Similar to The Latvian Economy - No 1, January 17, 2012 (20)
More from Swedbank
More from Swedbank (20)
Recently uploaded
Recently uploaded (20)
The Latvian Economy - No 1, January 17, 2012
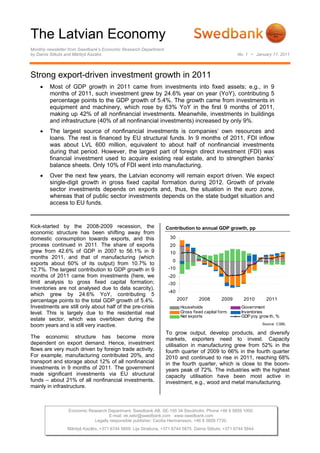
- 1. The Latvian Economy Monthly newsletter from Swedbank’s Economic Research Department by Dainis Stikuts and Mārtiņš Kazāks No. 1 • January 17, 2011 Strong export-driven investment growth in 2011 • Most of GDP growth in 2011 came from investments into fixed assets; e.g., in 9 months of 2011, such investment grew by 24.6% year on year (YoY), contributing 5 percentage points to the GDP growth of 5.4%. The growth came from investments in equipment and machinery, which rose by 63% YoY in the first 9 months of 2011, making up 42% of all nonfinancial investments. Meanwhile, investments in buildings and infrastructure (40% of all nonfinancial investments) increased by only 9%. • The largest source of nonfinancial investments is companies’ own resources and loans. The rest is financed by EU structural funds. In 9 months of 2011, FDI inflow was about LVL 600 million, equivalent to about half of nonfinancial investments during that period. However, the largest part of foreign direct investment (FDI) was financial investment used to acquire existing real estate, and to strengthen banks’ balance sheets. Only 10% of FDI went into manufacturing. • Over the next few years, the Latvian economy will remain export driven. We expect single-digit growth in gross fixed capital formation during 2012. Growth of private sector investments depends on exports and, thus, the situation in the euro zone, whereas that of public sector investments depends on the state budget situation and access to EU funds. Kick-started by the 2008-2009 recession, the Contribution to annual GDP growth, pp economic structure has been shifting away from domestic consumption towards exports, and this 30 process continued in 2011. The share of exports 20 grew from 42.6% of GDP in 2007 to 56.1% in 9 10 months 2011, and that of manufacturing (which 0 exports about 60% of its output) from 10.7% to 12.7%. The largest contribution to GDP growth in 9 -10 months of 2011 came from investments (here, we -20 limit analysis to gross fixed capital formation; -30 inventories are not analysed due to data scarcity), -40 which grew by 24.6% YoY, contributing 5 percentage points to the total GDP growth of 5.4%. 2007 2008 2009 2010 2011 Investments are still only about half of the pre-crisis Households Government level. This is largely due to the residential real Gross fixed capital form. Inventories Net exports GDP yoy grow th, % estate sector, which was overblown during the boom years and is still very inactive. Source: CSBL To grow output, develop products, and diversify The economic structure has become more markets, exporters need to invest. Capacity dependent on export demand. Hence, investment utilisation in manufacturing grew from 52% in the flows are very much driven by foreign trade activity. fourth quarter of 2009 to 66% in the fourth quarter For example, manufacturing contributed 20%, and 2010 and continued to rise in 2011, reaching 68% transport and storage about 12% of all nonfinancial in the fourth quarter, which is close to the boom- investments in 9 months of 2011. The government years peak of 72%. The industries with the highest made significant investments via EU structural capacity utilisation have been most active in funds – about 21% of all nonfinancial investments, investment, e.g., wood and metal manufacturing. mainly in infrastructure. Economic Research Department. Swedbank AB. SE-105 34 Stockholm. Phone +46 8 5859 1000. E-mail: ek.sekr@swedbank.com www.swedbank.com Legally responsible publisher: Cecilia Hermansson, +46 8 5859 7720. Mārtiņš Kazāks, +371 6744 5859. Lija Strašuna, +371 6744 5875. Dainis Stikuts, +371 6744 5844.
- 2. The Latvian Economy Monthly newsletter from Swedbank’s Economic Research Department, continued No. 1 • January 17, 2011 Where were investments directed? What is the source of investments? Swift export growth explains the dynamics and the For the corporate sector, the major financing source structure of nonfinancial investments. Investments of nonfinancial investments is own resources and in equipment and machinery increased by 63% YoY loans. Good cash flows and profit margins allowed in 9 months of 2011, amounting to 43% of all companies to build up deposits during 2010 (up by nonfinancial investments. Two-thirds of investments 36%) that had been depleted during the crisis. By in machinery and equipment were done by major late 2010, deposit stock was already 6% above its exporting sectors, such as manufacturing and pre-recession level. Despite still-good profit transport and storage. margins, deposits of resident nonfinancial corporations remained by and large flat in 2011. Thus, instead of increasing deposits, companies Nonfinancial investments, m LVL both invested in their capacity and reduced creditor Other f ixed assets 1000 120 exposures. For instance, by shifting their payment Equipment and machinery Buildings and inf rastructure dates for received deliveries from, say, the thirtieth 750 Long-term intangible assets 90 day to the first day after delivery, they obtain both Y oY growth, % (rs) discounts and liquidity buffer because, if necessary, 500 60 they could shift back to the payment on the thirtieth day and thus extend their liquidity without additional 250 30 borrowing. 0 0 Demand for new loans has increased too – they rose throughout 2011, and the total resident -250 -30 corporate loan stock has been growing month on month since summer. The rest of financing (about -500 -60 one-fifth of all nonfinancial investment) is EU 2008 2009 2010 2011 funding. Although not the largest source of Source: CSBL financing, EU funds have been instrumental in keeping up corporate investment activity as they Investments in buildings and infrastructure grew by significantly reduce the cost of private investment. 9% in 9 months of 2011, accounting for about 40% of all nonfinancial investments. In contrast to the Loans to resident nonfinancial corporations, boom years, when activity was dominated by m LVL private sector housing developments, two-thirds of investments in buildings and infrastructure in 2011 120 6000 came from public administration, i.e., state and municipalities, as well as the energy and water 90 5750 supply sector, where state-owned companies dominate. Such projects are heavily supported by EU funds and have been used to provide stimulus 60 5500 to recovering economic activity. During the recent years, the quality of investments 30 5250 has changed. For instance, manufacturers now look more for high quality investments to improve competitive advantage or to develop niche products 0 5000 instead of straight forward production volume Jan.11 Apr.11 Jul.11 Oct.11 boosting. They try to buy the most modern and, in New loans issued Loans stock (rs) some cases, unique technology. Yet, to a large Source: FCMC degree it is still buying foreign made technology and In 9 months of 2011, FDI inflow was about LVL 600 machinery rather than developing their own. We million, equivalent to about half of nonfinancial have not seen so far much of increase in investments during that period. Of course, not all expenditures for research and development (R&D), FDI ended up as nonfinancial investment to boost which were 0.22% of GDP in 2010. These the economy’s gross fixed capital – 20% of FDI exceeded the pre-crisis level but still were just went into real estate (mainly the takeover of existing about one-third of EU average. As most of Latvian real estate rather than new developments) and 32% companies are small to create their own research into financial intermediation (to strengthen the centres, cooperation and government support is banks’ balance sheets). Manufacturing got only needed to boost R&D and innovations. 10% and domestic trade 14% of FDI, most of which 2 (3)
- 3. The Latvian Economy Monthly newsletter from Swedbank’s Economic Research Department, continued No. 1 • January 17, 2011 was probably invested in fixed assets; however, FDI risk of suddenly weaker business confidence and of these two sectors represent only 12% of all investment activity in Latvia if the euro zone nonfinancial investments. situation continues to weaken. FDI inflow to Latvia in during 9 months of 2011 Confidence and nonfinancial investments 20 80 10 60 Real estate Domestic 0 40 20% trade -10 20 14% Manufac- -20 0 Financial turing -30 -20 intermed. 10% 32% -40 -40 Other -50 -60 24% Jan.06 Jan.07 Jan.08 Jan.09 Jan.10 Jan.11 Latvia's manufacturing confidence Euro zone's manufacturing confidence Source: Source: LaB Non financial investments, YoY grow th (rs) Eurostat Other factors that will weigh on investments in 2012 Outlook are (i) shrinking profit margins and less own resources due to the forecast recession in the euro Investments depend on the situation in Europe zone; (ii) higher risk premiums for loans owing to since growth in the Latvian economy in the coming more stringent banking regulatory requirements years will remain export driven (i.e. household (e.g., Basel III requirements and higher payments incomes are expected to remain rather weak). In into the deposit insurance fund after the bankruptcy other words, investments depend on confidence on of Latvijas Krājbanka late last year); and (iii) a likely what will be the demand for Latvian exports, which temporary slowdown by exporters in investments, is largely determined by the depth and length of the which were considerable during 2011. sovereign debt crisis in the euro zone. Under the base scenario, we expect single-digit As for 2012, we see the following factors driving growth in gross fixed capital formation during 2012; investment activity. Investments will be supported however, small negative quarterly growth in one or by (i) the large projects (e.g., in the energy sector, two quarters is very likely. infrastructure) that started in 2011 and will continue this year; (ii) inflow of EU funds, which is expected to be similar to that of 2011; and (iii) robust and still rather high business confidence in the beginning of Dainis Stikuts 2012. Mārtiņš Kazāks Throughout 2011, manufacturing confidence in Latvia was surprisingly stable compared with that in the euro zone and other major trade partners. This might suggest some nonlinearity in response to changes in the external environment, i.e., there is a Swedbank Economic Research Department Swedbank AB. SE-105 34 Stockholm. Swedbank’s monthly newsletter is published as a service to our customers. We believe that we have used reliable sources and methods in the preparation of the analyses reported in Legally responsible publisher this publication. However, we cannot guarantee the accuracy or completeness of the report Cecilia Hermansson, +46 8 5859 7720 and cannot be held responsible for any error or omission in the underlying material or its use. Readers are encouraged to base any (investment) decisions on other material as well. Neither Swedbank nor its employees may be held responsible for losses or damages, Martiņš Kazāks, +371 6744 5859 direct or indirect, owing to any errors or omissions in Swedbank’s monthly newsletter. Dainis Stikuts, +371 6744 5844 Lija Strašuna, +371 6744 5875 3 (3)