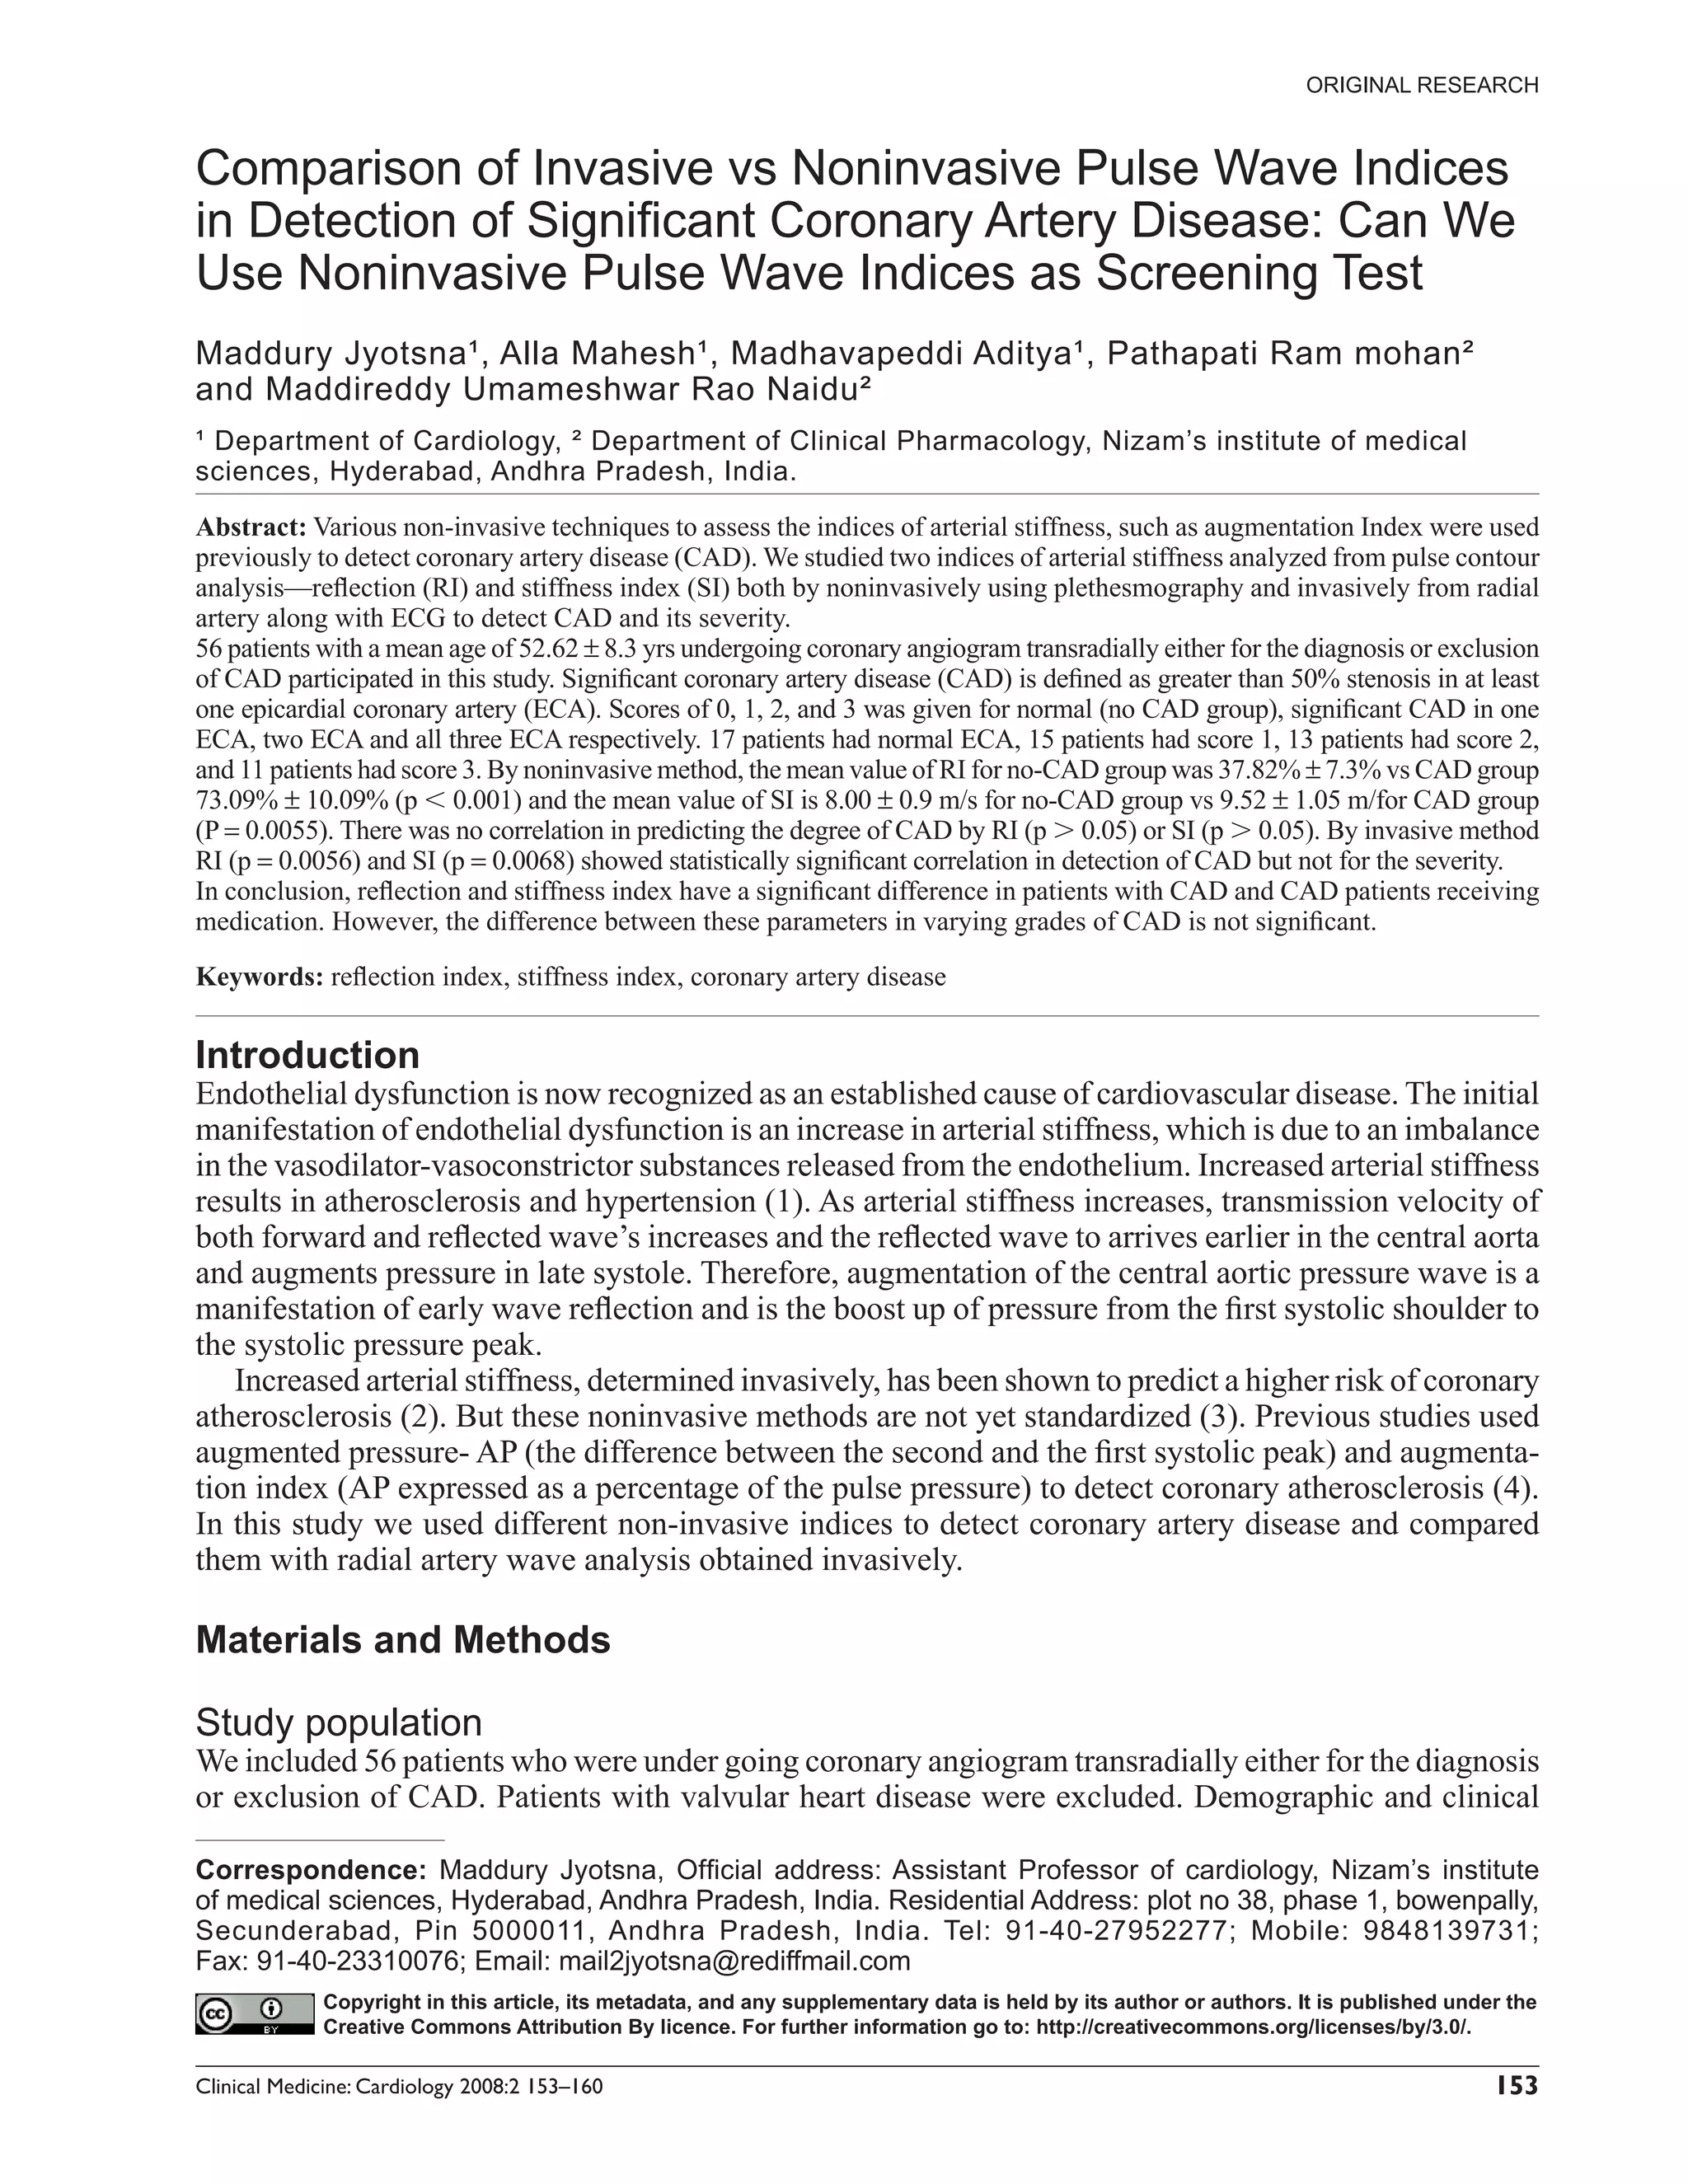
Comparison of Invasive vs Noninvasive Pulse Wave Indices in Detection of Signifi cant Coronary Artery Disease: Can We Use Noninvasive Pulse Wave Indices as Screening Test
1. ORIGINAL RESEARCH
Comparison of Invasive vs Noninvasive Pulse Wave Indices
in Detection of Significant Coronary Artery Disease: Can We
Use Noninvasive Pulse Wave Indices as Screening Test
Maddury Jyotsna¹, Alla Mahesh¹, Madhavapeddi Aditya¹, Pathapati Ram mohan²
and Maddireddy Umameshwar Rao Naidu²
¹ Department of Cardiology, ² Department of Clinical Pharmacology, Nizam’s institute of medical
sciences, Hyderabad, Andhra Pradesh, India.
Abstract: Various non-invasive techniques to assess the indices of arterial stiffness, such as augmentation Index were used
previously to detect coronary artery disease (CAD). We studied two indices of arterial stiffness analyzed from pulse contour
analysis—reflection (RI) and stiffness index (SI) both by noninvasively using plethesmography and invasively from radial
artery along with ECG to detect CAD and its severity.
56 patients with a mean age of 52.62 ± 8.3 yrs undergoing coronary angiogram transradially either for the diagnosis or exclusion
of CAD participated in this study. Significant coronary artery disease (CAD) is defined as greater than 50% stenosis in at least
one epicardial coronary artery (ECA). Scores of 0, 1, 2, and 3 was given for normal (no CAD group), significant CAD in one
ECA, two ECA and all three ECA respectively. 17 patients had normal ECA, 15 patients had score 1, 13 patients had score 2,
and 11 patients had score 3. By noninvasive method, the mean value of RI for no-CAD group was 37.82% ± 7.3% vs CAD group
73.09% ± 10.09% (p 0.001) and the mean value of SI is 8.00 ± 0.9 m/s for no-CAD group vs 9.52 ± 1.05 m/for CAD group
(P = 0.0055). There was no correlation in predicting the degree of CAD by RI (p 0.05) or SI (p 0.05). By invasive method
RI (p = 0.0056) and SI (p = 0.0068) showed statistically significant correlation in detection of CAD but not for the severity.
In conclusion, reflection and stiffness index have a significant difference in patients with CAD and CAD patients receiving
medication. However, the difference between these parameters in varying grades of CAD is not significant.
Keywords: reflection index, stiffness index, coronary artery disease
Introduction
Endothelial dysfunction is now recognized as an established cause of cardiovascular disease. The initial
manifestation of endothelial dysfunction is an increase in arterial stiffness, which is due to an imbalance
in the vasodilator-vasoconstrictor substances released from the endothelium. Increased arterial stiffness
results in atherosclerosis and hypertension (1). As arterial stiffness increases, transmission velocity of
both forward and reflected wave’s increases and the reflected wave to arrives earlier in the central aorta
and augments pressure in late systole. Therefore, augmentation of the central aortic pressure wave is a
manifestation of early wave reflection and is the boost up of pressure from the first systolic shoulder to
the systolic pressure peak.
Increased arterial stiffness, determined invasively, has been shown to predict a higher risk of coronary
atherosclerosis (2). But these noninvasive methods are not yet standardized (3). Previous studies used
augmented pressure- AP (the difference between the second and the first systolic peak) and augmenta-
tion index (AP expressed as a percentage of the pulse pressure) to detect coronary atherosclerosis (4).
In this study we used different non-invasive indices to detect coronary artery disease and compared
them with radial artery wave analysis obtained invasively.
Materials and Methods
Study population
We included 56 patients who were under going coronary angiogram transradially either for the diagnosis
or exclusion of CAD. Patients with valvular heart disease were excluded. Demographic and clinical
Correspondence: Maddury Jyotsna, Official address: Assistant Professor of cardiology, Nizam’s institute
of medical sciences, Hyderabad, Andhra Pradesh, India. Residential Address: plot no 38, phase 1, bowenpally,
Secunderabad, Pin 5000011, Andhra Pradesh, India. Tel: 91-40-27952277; Mobile: 9848139731;
Fax: 91-40-23310076; Email: mail2jyotsna@rediffmail.com
Copyright in this article, its metadata, and any supplementary data is held by its author or authors. It is published under the
Creative Commons Attribution By licence. For further information go to: http://creativecommons.org/licenses/by/3.0/.
Clinical Medicine: Cardiology 2008:2 153–160 153
2. Jyotsna et al
history was noted. Blood pressure was recorded waveform. To compare two or more waveforms of
using sphygmomanometer, with radial artery kept different amplitudes and time duration, one must
at the level of heart. The average of three systolic normalize them to a standard amplitude as well as
pressure (SP) and diastolic pressure (DP) readings sample per pulse waveform. Otherwise such a
was used for final analysis. From these Pulses comparison and the results obtained from the
pressure (PP) and mean arterial pressure (MAP) analysis will be on unequal scales. So as to get
was derived. All patients were studied while they uniform values of results across these inequalities,
taking regular medications (drugs were not with- one has to normalize the data over both the ampli-
held before measurement) as the patients were tude and the time scale. In the current scenario, all
symptomatic. the PPG waveforms are transformed linearly to
MAP = diastolic pressure + 1/3 pulse pressure amplitude of 100(dimensionless)—i.e. Amplitude
normalization and 100 samples per pulse- i.e. Time
normalization (5, 6). The average of these 10 suc-
Cardiac catheterization and coronary cessive measurements, to cover a complete respi-
angiogram ratory cycle, was used in the analyses.
For these 56 patients coronary angiogram (CAG) All PWA measurements were taken in the supine
was performed transradially using 6F diagnostic position in a quiet, temperature controlled room
Judkin’s 3.5 curve catheters. Arterial pressure trac- (22 ± 1 °C) after a brief period (at least 5 minutes)
ings were recorded from radial artery immediately of rest, one day prior to cardiac catheterization by
after puncture. Simultaneously ECG was recorded research nurses who were not involved either in
to calculate exactly the time intervals and informa- performance or interpretation of the angiograms.
tion about the dicrotic notch and wave. Repeat
arterial pressure tracings were recorded immedi-
ately after giving the Nitroglycerine 200 micro
Pulse wave analysis (for invasive
grams in to the artery. Significant coronary artery and noninvasive)
disease (CAD) is defined as greater than 50% ste- By both invasive and noninvasive methods
nosis in at least one epicardial coronary artery reflection index and stiffness index were calculated
(ECA). Scores of 0, 1, 2, and 3 was given for nor- (Figs. 1 & 2).
mal (no CAD group), significant CAD in one ECA, RI is calculated as height of second systolic
two ECA and all three ECA respectively. peak (B) to first systolic peak (A)
height of sec ond systolic peak (B)
RI =
Peripheral arterial wave recording first systolic peak (A)
Arterial wave reflections were quantified noninva-
sively using Photoplethysmographic Pulse Wave Time interval between the two systolic peaks
Analysis system (“VasoWin” Genesis Medical, (A & B) is known as Digital Volume Pulse Transit
Hyderabad, India). This system acquires Digital time (∆TDVP)
Volume Pulse (DVP) waveform tracings from the
forefinger of dominant hand of the subject. The height of the patients (meters)
SI =
waveforms were sampled at 200 Hz for a good ∆TDVP
resolution. VasoWin is designed according to
IEC60601 patient safety guidelines for medical h = height of patient.
instruments. VasoWin System has in-built propri- ∆TDVP = time interval between the two systolic
etary software to find the exact location of dicrotic peaks.
notch from the second derivative of the PPG
(Peripheral Pulse Graph) waveform and is accurate
even when the dicrotic notch is invisible to human Statistical Analysis
eyes. Electrocardiogram, blood pressure (BP) Statistical analysis was carried out using “Graph-
waveform and peripheral pulse graph (PPG) was pad InStat” version 3.06. Continuous data was
acquired simultaneously. Ten sequential wave- presented as mean, standard deviation and the
forms had been acquired; a validated generalized categorical data as percentages. Between group
transfer function was used to generate average analysis was performed by using either unpaired
154 Clinical Medicine: Cardiology 2008:2
3. Comparison of invasive vs noninvasive pulse wave indices
A = height of first systolic peak
B = height of second systolic peak
Figure 1. Reflection index calculation.
t tests or ANOVA. P value less than 0.05 was Coronary angiogram findings
considered statistically significant. In 17 patients CAG revealed normal ECA or
coronary stenosis less than 50%. 15 patients had
Results score 1, 13 patients had score 2, and 11 patients
had score 3.
Baseline clinical characteristics
Fifty-six patients in the mean age group of Results of pulse wave analysis
52.62 ± 8.3 yrs participated in this study; out of Mean values of Reflection Index (RI) as assessed
them 51 were males. Thirty patients (53.6%) had by noninvasive method in patients with significant
one or two risk factors and rest patients were with- coronary artery disease (score of 1, 2 and 3) were
out any risk factor (Table 1). Average SP, DP, MAP, 74.51% ± 4.9%, 75.6% ± 4.5% and 77.4% ± 6.4%
MAPP, PP and HR in both group of patients (With respectively. There was no significant difference
CAD and without CAD ) were given (Table 2). (p 0.05) in the values of RI between these
Figure 2. Stiffness index calculation.
Clinical Medicine: Cardiology 2008:2 155
4. Jyotsna et al
Column A: Grade 0 No-CAD Column B: Grade 1 CAD
Table 1. Demographic data.
Column C: Grade 2 CAD Column D: Grade 3 CAD
Parameters Values
Average age 52.62 ± 8.3 yrs
No. of patients 56
Females: Males 5:51
Risk factors
Diabetes 15
Hypertension 20
Smoking 14
Family history of CAD 02
No risk factors 26
Figure 3. Non invasive reflection index in different subgroup of CAD
and No CAD patients.
groups. (B vs C, B vs D, C vs D) However, when
we compared with the values of RI (37.82% ±
7.3%) in patients without coronary disease (score
of 0); we observed that these values are signifi- in patients without coronary disease (score of 0)
cantly higher than the value of RI in patients with- 29.61% ± 9.29%. (P = 0.0056) (Fig. 5). RI for No-
out coronary disease (score of 0) 37.82% ± 7.3%. CAD group is 29.61% ± 9.29% which is signifi-
(P = 0.01) (A vs B, A vs C or A vs D) (Fig. 3). When cantly lower than that of combined CAD group
the three CAD groups are put together and com- 47.42% ± 8.82% (Fig. 6).
pared with No-CAD group, the observed difference Mean value of Stiffness Index (SI) by noninva-
was extremely significant (P 0.001). RI for No- sive method in patients with significant coronary
CAD group is 37.82% ± 7.3% which is consider- artery disease (score of 1, 2 or 3) was 8.34 ± 1.9,
ably lower than that of combined CAD group 8.54 ± 1.8 and 9.05 ± 1.8 meters/sec respectively.
73.098% ± 10.093% (Fig. 4).These observations These values are higher than SI in patients without
suggests that RI may useful in predicting CAD and coronary disease (score of 0) 8.28 ± 1.06 (Fig. 7).
not the severity. In non-invasive method, the mean value
Mean values of Reflection Index (RI) by inva- of SI is 8.00 ± 0.9 m/s for No-CAD patients
sive method in patients with significant coronary whereas for all CAD patients it is 9.52 ± 1.05 m/s
artery disease (score of 1, 2 or 3) was 45.85% ± (P = 0.0055)(Fig. 8).
12.9%, 47.7% ± 9.5% and 48.7% ± 4.05% respec- Mean value of Stiffness Index (SI) by invasive
tively. These values are significant higher than RI method in patients with significant coronary artery
Column A: No-CAD Column B: All CAD groups put tougher
Table 2. Arterial pressure parameters in CAD and
without CAD patients. 90
80
Parameter No CAD group CAD group
70
Systolic 139.5 ± 19.32 131.44 ± 22.97
60
pressure (SP)
(mm of hg) 50
Diastolic 98 ± 10.46 78.1 ± 13.22 40
pressure (DP) 30
(mm of hg)
20
Mean arterial 112 ± 13.33 97.34 ± 17.91
10
pressure (MAP)
(mm of hg) 0
A1 B2
Pulse pressure 41.5 ± 10.65 63.82114 ± 9.87
(PP) (mm of hg) Figure 4. Noninvasive reflection index in all CAD and No-CAD
patients.
Heart rate (HR) 78 ± 7.6 78.78 ± 8.9 Column A: No-CAD; Column B: All CAD groups put tougher.
156 Clinical Medicine: Cardiology 2008:2
5. Comparison of invasive vs noninvasive pulse wave indices
Column A: Grade 0 No-CAD Column B: Grade 1 CAD Column A: Grade 0 No-CAD Column B: Grade 1 CAD
Column C: Grade 2 CAD Column D: Grade 3 CAD Column C: Grade 2 CAD Column D: Grade 3 CAD
Figure 5. Invasive RI in No CAD and all subgroup of CAD patients. Figure 7. Non invasive SI in different subgroup of CAD and No CAD
patients.
disease (score of 1, 2 or 3) was 7.81 ± 2.6, 8.22 ± pathophysiology of pulse wave pattern is better
4.4 and 7.35 ± 1.1 meters/sec respectively. These understood different indications are emerged to
values are higher than SI in patients without coro- analyze the pulse wave pattern.
nary disease (score of 0) 6.94 ± 1.9 (Fig. 9) In Large artery stiffness is an independent predic-
Invasive method, the mean value of SI is 6.15 ± 1.00 m/s tor of cardiovascular mortality and a major deter-
for No-CAD patients whereas for CAD patients it minant of pulse pressure. When arteries are
is 8.36 ± 2.82 m/s (P = 0.0068) (Fig. 10). Invasive relatively compliant arterial wave forms travels
and non-invasive Stiffness Index correlated well relatively slow, reflected waves return to the central
with a slope of 0.7331 (P 0.0001)(Fig. 11). aorta in diastole, augments diastolic blood pressure
and preserves coronary blood flow, which occurs
predominantly during diastole. When arteries are
Discussion stiffer, reflected waves arrives faster, augments
Previously Pulse wave monitoring was used in central systolic rather than diastolic blood pressure,
postoperative cases for the measurement of beat- increases left ventricular workload and compro-
to-beat changes in stroke volume or to analyze the mise coronary blood flow. Arterial stiffening
interaction of ventilation and circulation which reflects the degenerative changes of arterial wall.
tests general circulatory performance (7). As the Arterial stiffness is dependent on drugs, age,
Column A: No-CAD Column B: CAD
Column 1: Grade 0 No-CAD Column 2: All CAD
50
45
40
35
30
25
20
15
10
5
0
1 2
Figure 6. Invasive RI in No CAD and all CAD patients. Figure 8. Non invasive SI in CAD vs No CAD patients.
Clinical Medicine: Cardiology 2008:2 157
6. Jyotsna et al
Column A: Grade 0 No-CAD Column B: Grade 1 CAD Most of studies that compared invasive vs
Column C: Grade 2 CAD Column D: Grade 3 CAD noninvasive pulse wave analysis have used femoral
site for recording central aortic pressures. At this
site the systolic and pulse pressures will be greater
and the dicrotic wave will be more prominent. The
changes that occurred in transmission waves
increased during vasoconstriction and decreased
during vasodilatation Greater pulse pressure results
in greater amplitude pressure waves. How ever,
according to Carter et al. amplification did not dif-
fer significantly between control subjects and
patients with hypertension or ischemic heart dis-
ease. In the absence of pronounced vasodilatation
or luminal obstruction by atherosclerotic plaques,
systolic and pulse pressures at the femoral site will
be higher than in proximal pulses. To come over
these problems we used transradial arterial wave
Figure 9. Invasive SI in different subgroup of CAD and No CAD form analysis.
patients. Idia et al. used finger pulse for noninvasive
wave analysis and femoral artery pressure for
invasive wave analysis; they found that the derived
different risk factors duration and site used to values were different (12). In a study conducted
record (8, 9, and 10). Thomas Weber et al. studied on medical students, the ratio of time delay for the
systemic arterial compliance, distensibility index, rise of toe pulse to that of finger pulse (t) was
aortic pulse wave velocity, and carotid augmenta- almost halved when there was postural change
tion index using carotid applanation tonometry and from the supine position to the sitting position.
Doppler velocitometry (4). They demonstrated that This was mainly due to an increase in the pulse
the indices of large artery stiffness/compliance wave velocity in the aorta, which was thought to
correlated with time to ischemia (P = 0.01 to be induced by the increase in hydrostatic pressure
0.009). In patients with moderate CAD, large artery in the aorta. A distinct dicrotic wave was observed
stiffness is a major determinant of myocardial in both finger and toe pulse waves. The interval
ischemic threshold. In our study also stiffness index between the main and dicrotic wave (T) was shorter
is useful in detecting the severity of coronary artery for finger pulse than toe pulse also seems to be
disease. ascribable to the influence of the intra aortic
Even though there is correlation in knowing the
severity of CAD with pulse wave analysis, few
studies demonstrated such correlation with only Column A: No-CAD Column B: CAD
central pulse but not with peripheral pulse. Waddell
TK demonstrated that patients with severe coronary
stenosis ( 90% stenosis) had low compliance and
high mean pressure (11). Pulse wave velocity was
higher in patients with severe stenosis than in those
with moderate stenosis (50%–89% stenosis) (P 0.01)
and those in the control group (P 0.001). Brachial
pulse pressure was higher in patients than in controls
(P 0.05), but there was no difference between the
2 disease groups. In this study, we concentrated more
on noninvasive method of pulse wave analysis even
though central aortic pressure tracing also analyzed
(which was recorded during CAG). As this is a
noninvasive method large number of general popu-
lation can be screened to detect CAD. Figure 10. Invasive SI in CAD and No CAD patients.
158 Clinical Medicine: Cardiology 2008:2
7. Comparison of invasive vs noninvasive pulse wave indices
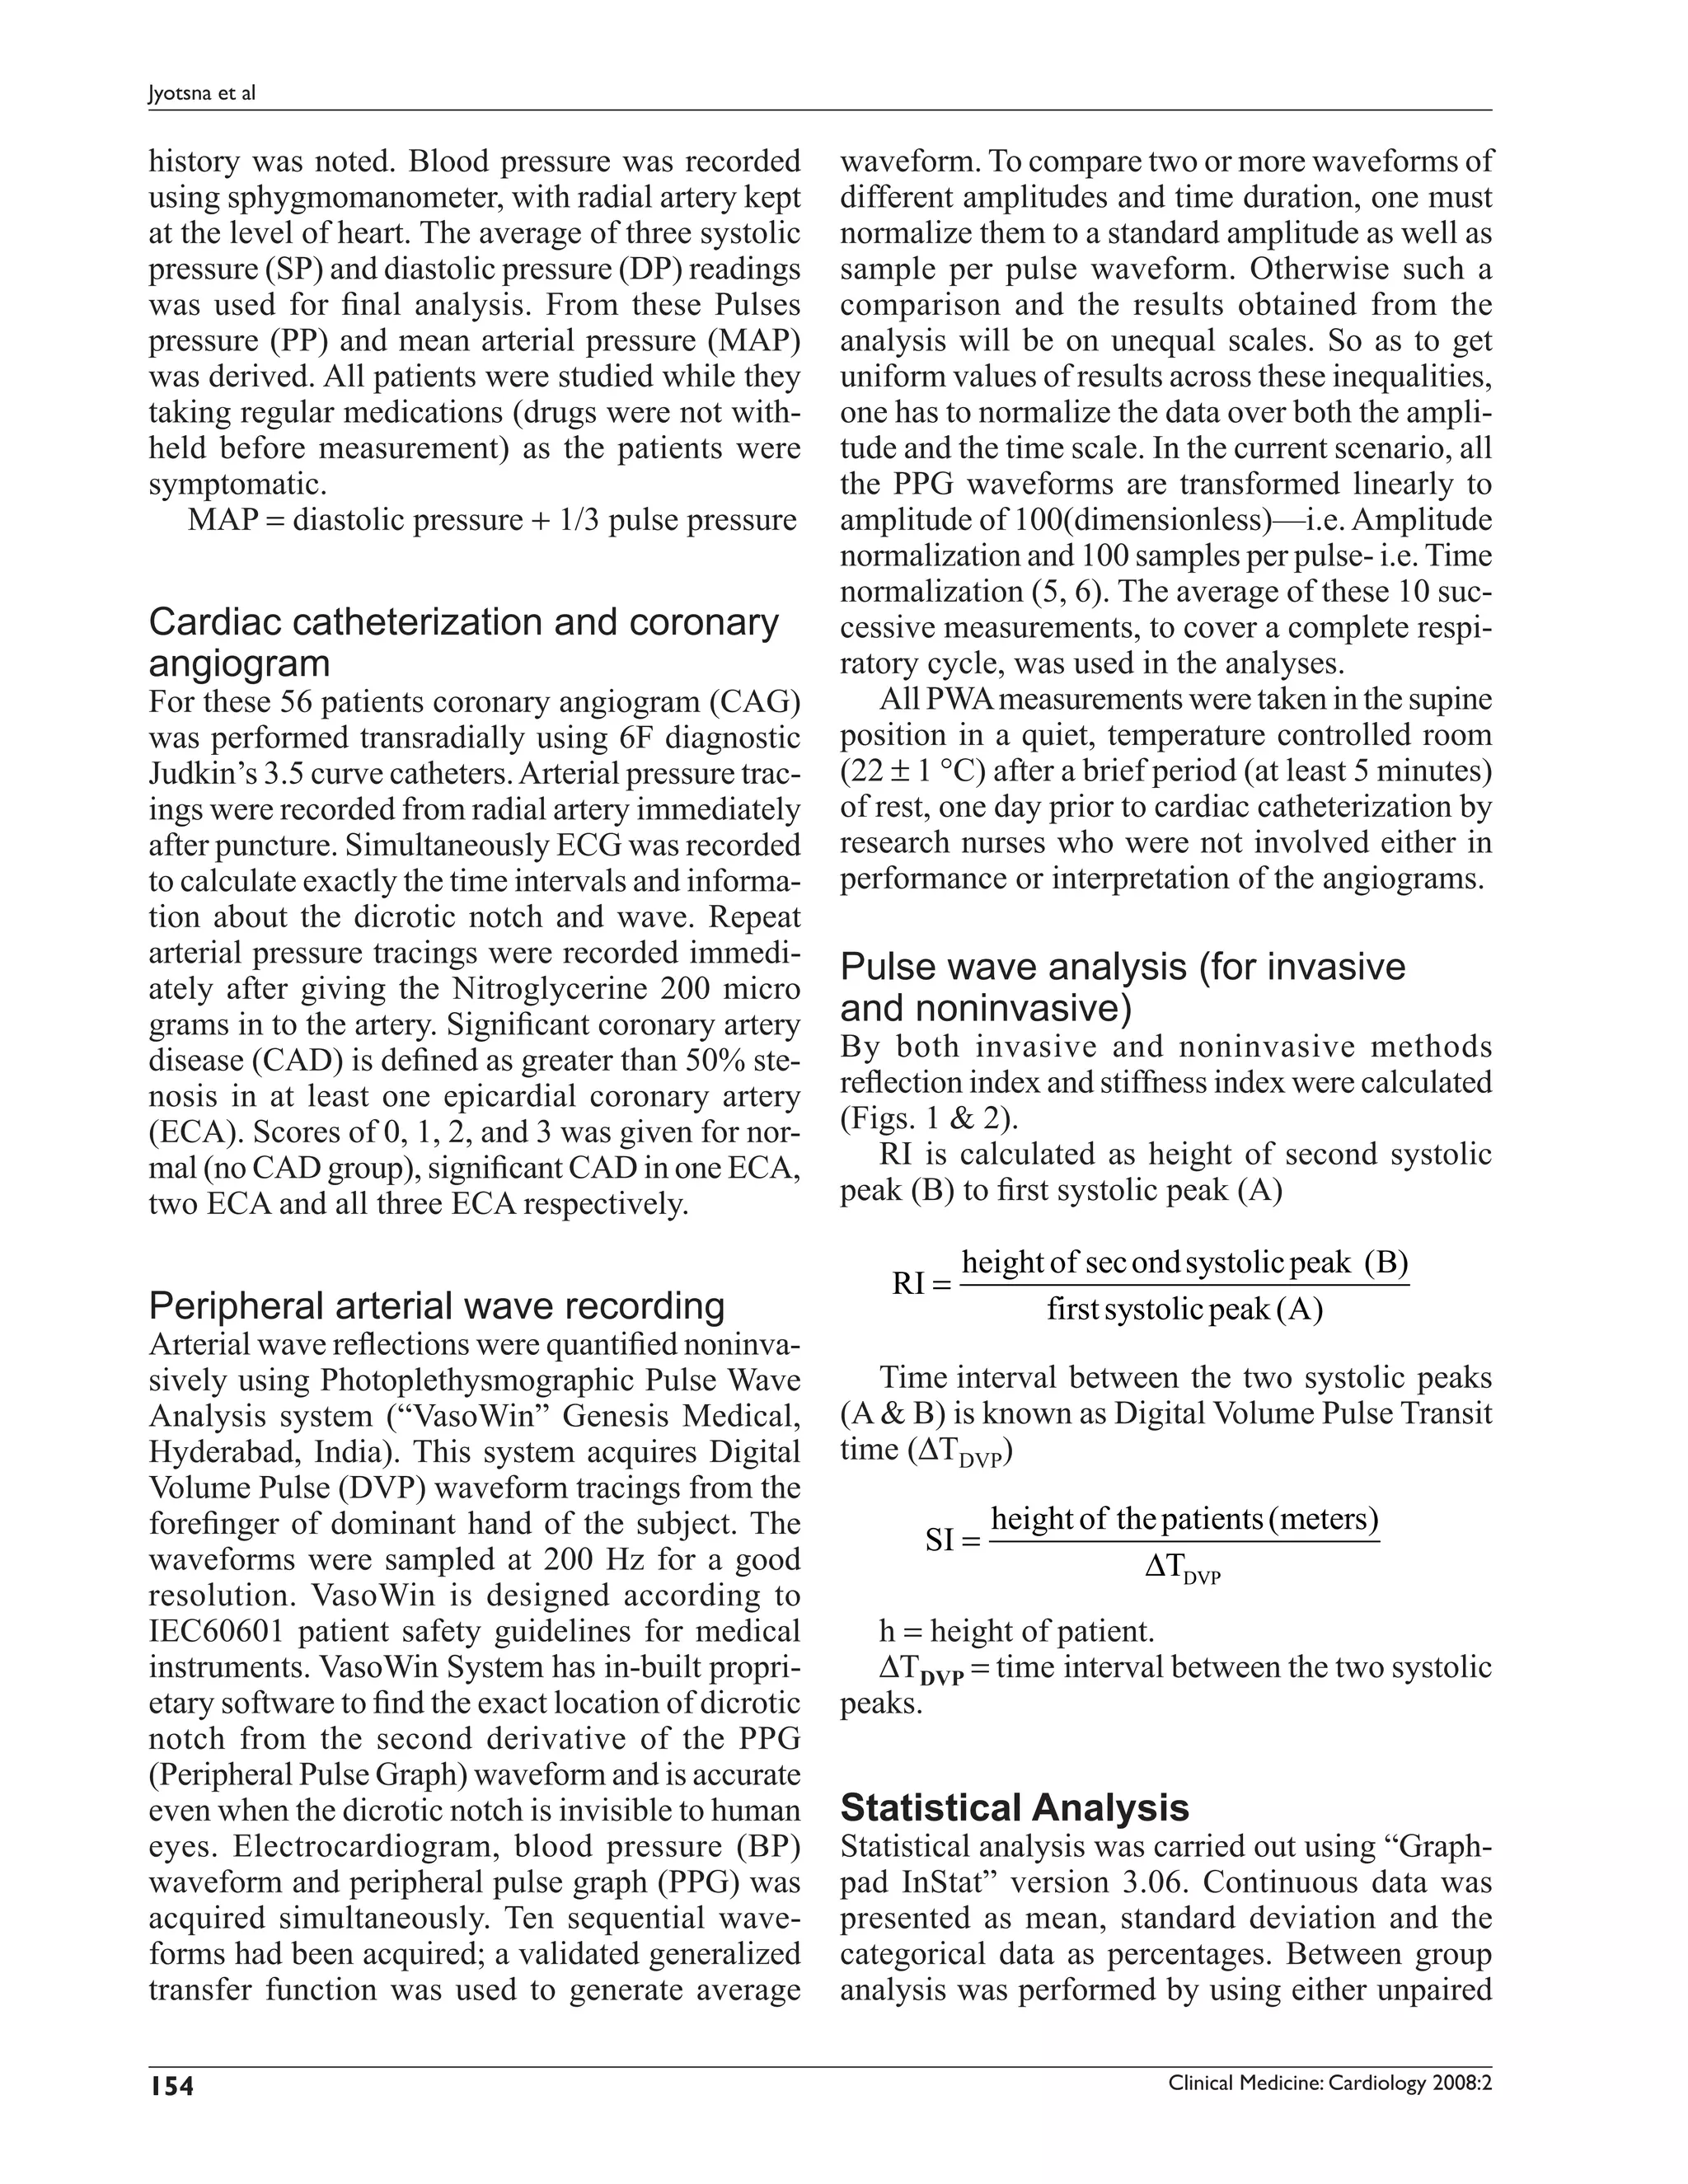
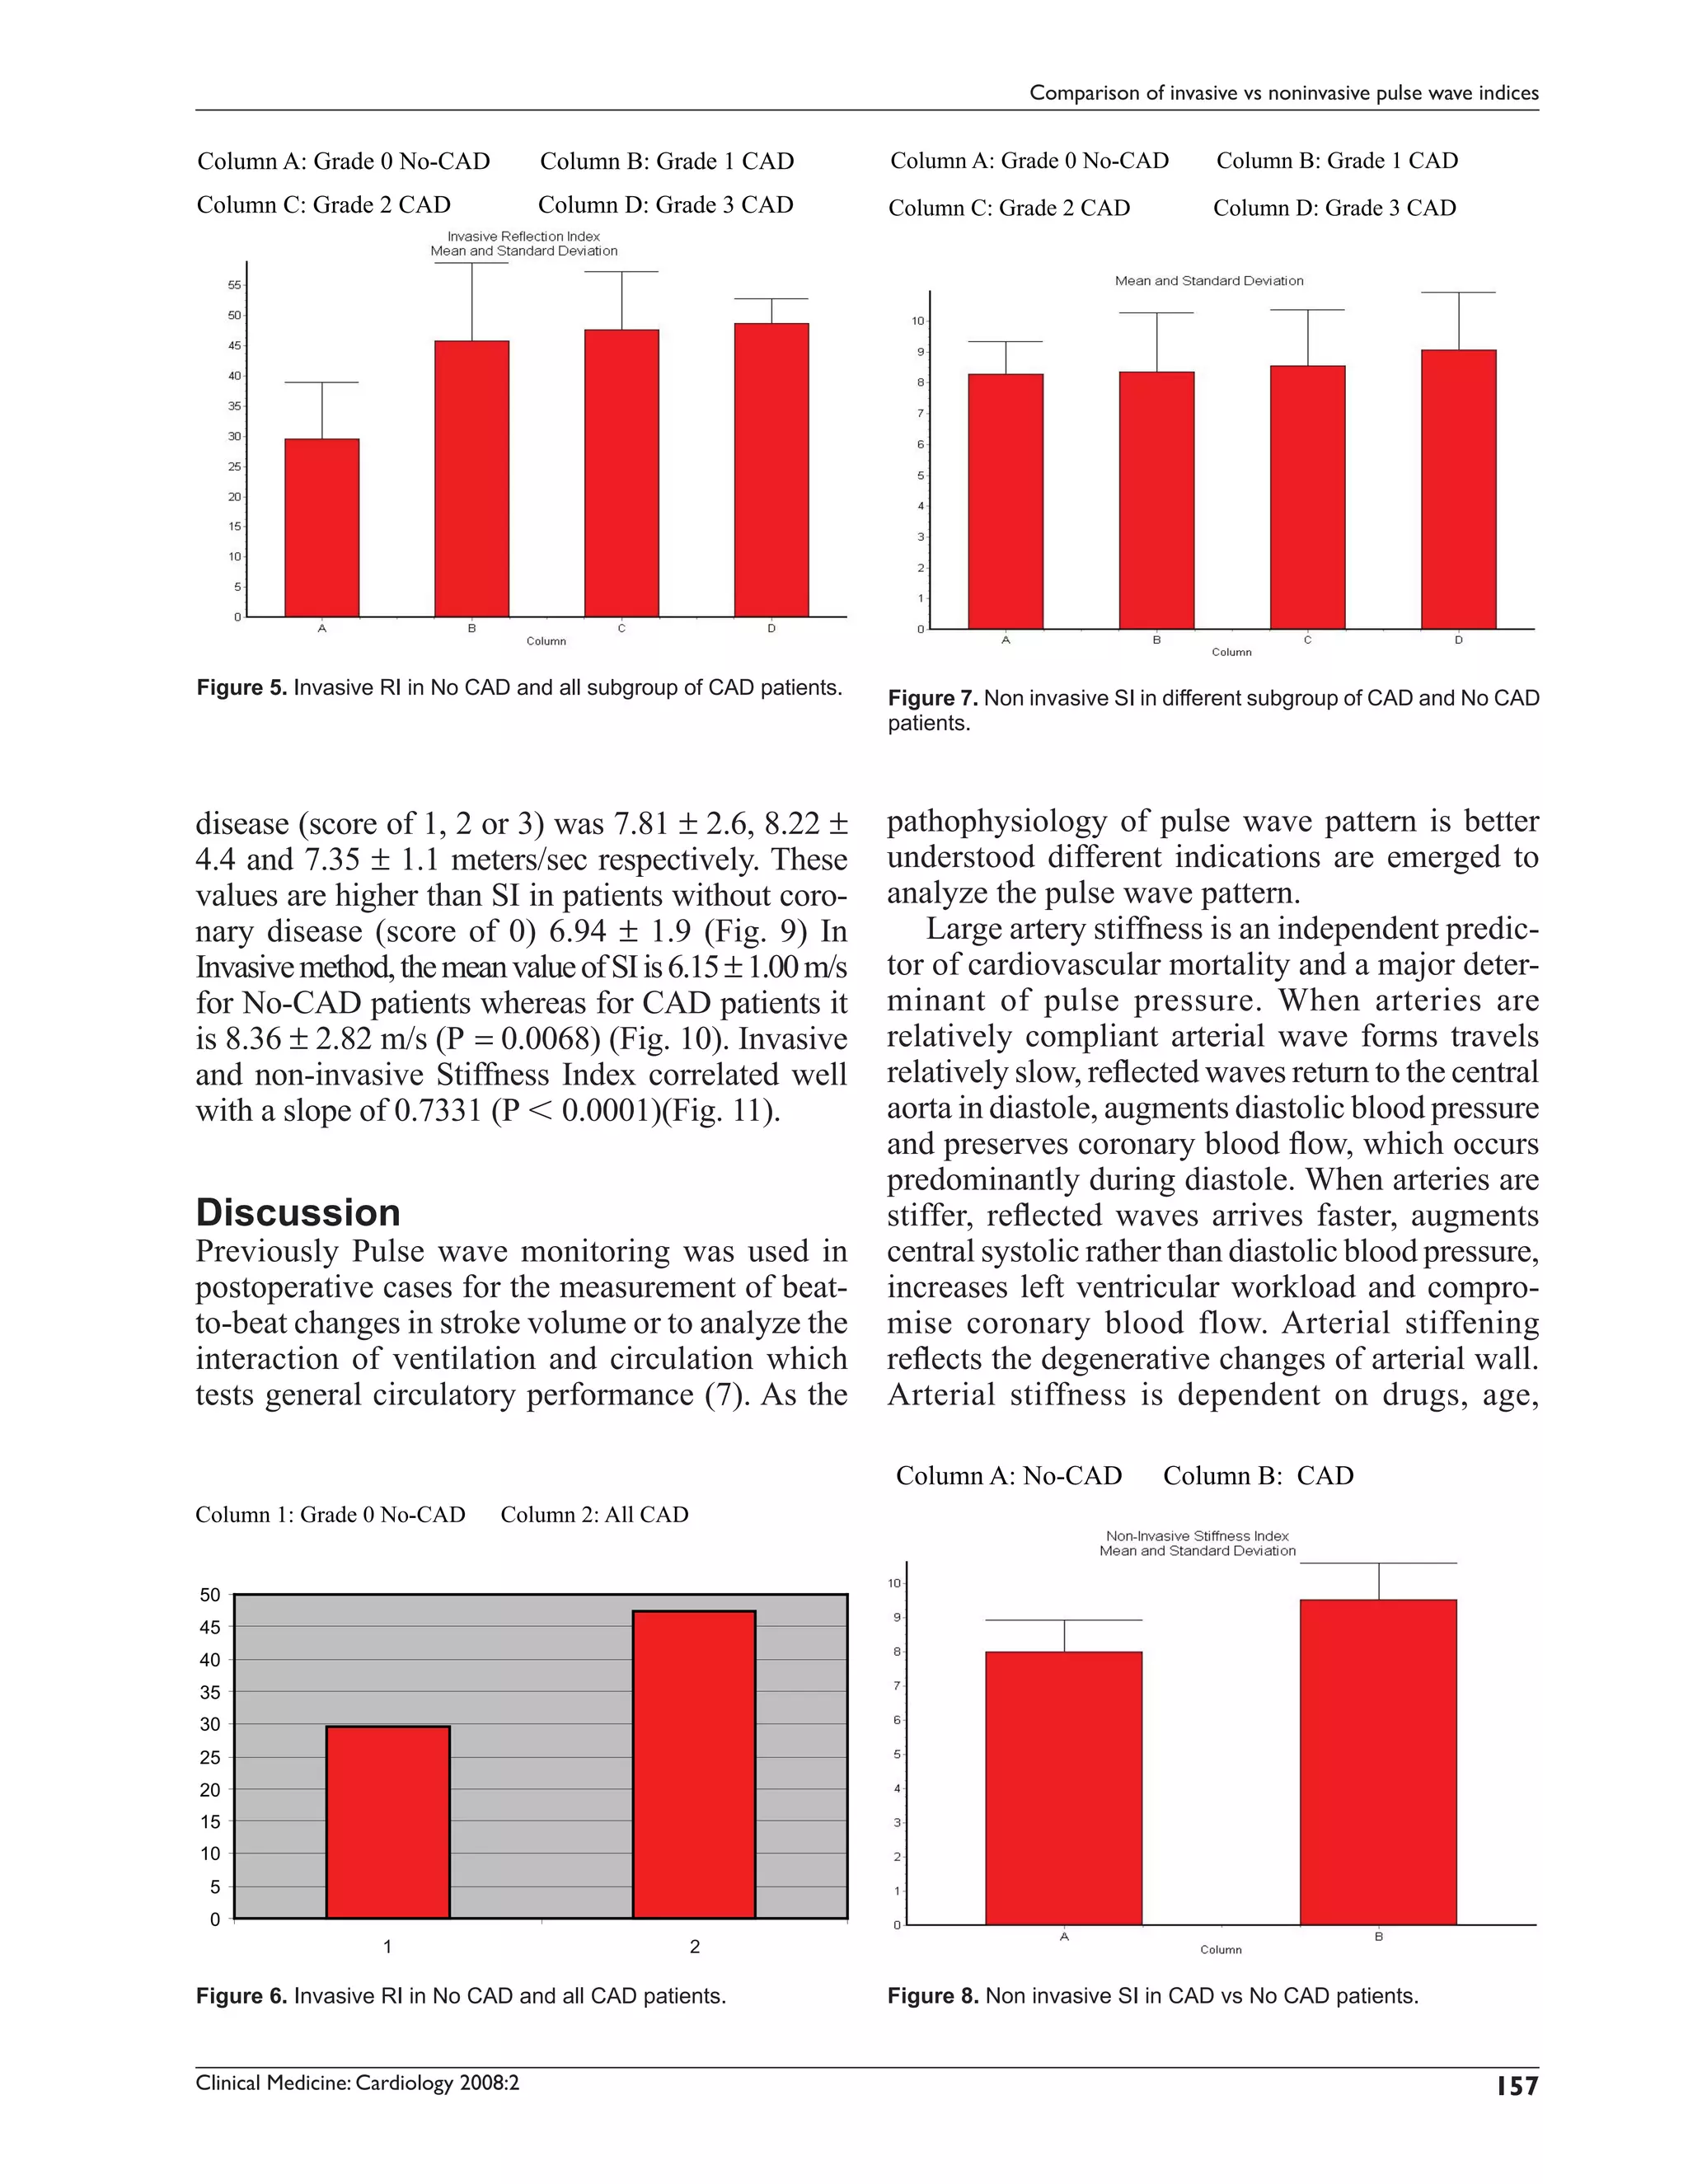
Figure 11. Correlation of SI invasively and noninvasively.
pressure: pulse was transmitted faster in the that the patients were continued medications pre-
systolic phase than in the diastolic phase. The scribed for CAD, which will have effect on these
features of pulse waves of hypertensive patients indices (14, 15).
were that time delay for the rise of pulse (t) was
short even in the supine position, and the dicrotic
wave was small or absent especially for toe pulse. Conclusion
In present study we used finger pulse and radial The values of noninvasive pulse wave indices,
arterial pulse and observed that the non invasive reflection index and stiffness index, were signifi-
pulse wave indices may useful in predicting CAD cantly different in patients without CAD and CAD
and not the severity. McLeod AL intravascular patients under medication. This difference may be
ultrasound guided study also did not demonstrate higher if the patients were not under medication.
the good correlation with these indices derived However, the difference between these parameters
from the noninvasive pulse wave analysis with the in varying grades of CAD is not significant. This
severity of CAD (13). may indicate that though these parameters may be
One potential limitation of our study is the used for differentiation between patients without
confinement to symptomatic patients referred for CAD and CAD patients, their potential to indicate
coronary angiography. Many of them had athero- the degree of CAD may be limited.
sclerotic obstructive CAD and very few had normal
luminogram. However, the incidence of normal References
epicardial vessels varies between 10%–25% of total [1] O’Rourke, M.F. and Mancia, G. 1999. Arterial stiffness. J. Hypertens,
number of angiograms. To get significant number 17:1–4.
[2] Kingwell, B.A., Waddell, T.K., Medley, T.L., Cameron, J.D. and Dart,
of cases with normal epicardial vessels, we have A.M. 2002. Large artery stiffness predicts ischemic threshold in
to screen large number of patients. Getting asymp- patients with coronary artery disease. J. Am. Coll. Cardiol.,
tomatic subjects for invasive studies is not practi- 40(4):773–9.
cal. However, it seems very much possible that our [3] Kuvin, J.T., Patel, A.R., Sliney, K.A., Pandian, N.G., Sheffy, J.,
Schnall, R.P., Karas, R.H. and Udelson, J.E. 2003. Assessment of
findings may be reproduced in large scale studies peripheral vascular endothelial function with finger arterial pulse
of this milieu. Another limitation of the study was wave amplitude. Am. Heart J., 146(1):168–74.
Clinical Medicine: Cardiology 2008:2 159
8. Jyotsna et al
[4] Thomas Weber, M.D., Johann Auer, M.D., Michael, F., O’ Rourke, [10] Pierre Boutouyrie, Anne Isabelle Tropeano, Roland Asmar, Isabelle
M.D., Erich Kvas, ScD., Elisabeth Lassing, M.D., Robert Berent, Gautier, Athanase Benetos, Patrick Lacolley and Stephane Laurent.
M.D. and Bernd Eber, M.D. 2004. Arterial Stiffness, Wave reflec- 2002. Aortic Stiffness Is an Independent Predictor of Primary Coro-
tions, and the risk of coronary artery disease. Circulation, nary Events in Hypertensive Patients. A Longitudinal Study. Hyper-
109:184–9. tension, 39:10–15.
[5] Applied functional data analysis: methods and case studies, Ramsay, [11] Waddell, T.K., Dart, A.M., Medley, T.L., Cameron, J.D. and Kingwell,
J.O. and Silverman, B.W. 2002. Springer series in statistics, New B.A. 2001. Carotid pressure is a better predictor of coronary artery
York, London: SpringerISBN:0–387–95414–7. disease severity than brachial pressure. Hypertension, 38(4):927–31.
[6] Functional Data Analysis, Ramsay, J.O. and Silverman, B.W. Copy- [12] Iida, N. and Iriuchijima, J. 1992. Postural changes in finger and toe
right# 2001 Elsevier Science Ltd. International Encyclopedia of the pulse waves. Kokyu To Junkan, 40:981–6.
Social and Behavioral Sciences ISBN:0–08–043076–7. [13] McLeod, A.L., Uren, N.G., Wilkinson, I.B., Webb, D.J., Maxwell,
[7] Murray, W.B. and Foster, P.A. 1996. The peripheral pulse wave: S.R. and Northridge newby, DE. 2004. Non-invasive measures of
information overlooked. Clin. Monit., 12:365–77. pulse wave velocity correlate with coronary arterial plaque load in
[8] Mitchell, G.F., Parise, H., Benjamin, E.J., Larson, M.G., Keyes, M.J., humans. J. Hypertens., 22:363–8.
Vita, J.A. and Levy, D. 2004. Changes in arterial stiffness andwave [14] Hope, S.A. and Hughes, A.D. 2007. Drug effects on the mechanical
reflection with advancing age in healthy men and women: the Fram- properties of large arteries in humans. Clin. Exp. Pharmacol. Physiol.,
ingham Heart Study. Hypertension, 43:1239–45. 34(7):688–93.
[9] Millasseau, S.C., Kelly, R.P., Ritter, J.M. and Chowienczyk, P.J. 2002. [15] Ting, C.T., Chen, C.H., Chang, M.S. et al. 1995. Short and long term
Determination of age-related increases in large artery stiffness by effects of antihypertensive drugs on arterial reflections, compliance
digital pulse contour analysis. Clinical Science, 103:371–7. and impedance. Hypertension, 26:524–30.
160 Clinical Medicine: Cardiology 2008:2