A 52-year-old man with a medical history of hypertension presented to the emergency department with persistent chest pain of 6hours’ duration. Electrocardiography performed on arrival revealed anterior ST elevation. He was referred to the cardiac catheterization laboratory for Primary Percutaneous Coronary Intervention (PPCI). The coronary angiogram revealed total proximal Left Anterior Descending Artery (LAD) occlusion. The LAD stenosis was successfully treated with a drug-eluting stent. He experienced extreme thoraco abdominal pain within six hours after PPCI. Thoraco abdominal aortic Computed Tomography Angiography (CTA) was performed to rule out an aortic dissection. Eventually, the patient was successfully treated with endovascular graft exclusion.
Hemodynamic assessment of partial mechanical circulatory support: data derive...Paul Schoenhagen
Partial mechanical circulatory support represents a new concept for the treatment of advanced heart failure. The Circulite Synergy Micro Pump®, where the inflow cannula is connected to the left atrium and the outflow cannula to the right subclavian artery, was one of the first devices to introduce this concept to the clinic. Using computational fluid dynamics (CFD) simulations, hemodynamics in the aortic tree was visualized and quantified from computed tomography angiographic (CTA) images in two patients. A realistic computational model was created by integrating flow information from the native heart and from the Circulite device. Diastolic flow augmentation in the descending aorta but competing/antagonizing flow patterns in the proximal innominate artery was observed. Velocity time curves in the ascending aorta correlated well with those in the left common carotid, the left subclavian and the descending aorta but poorly with the one in the innominate. Our results demonstrate that CFD may be useful in providing a better understanding of the main flow patterns in mechanical circulatory support devices.
LabVIEW Based Measurement of Blood Pressure using Pulse Transit TimeRSIS International
Blood Pressure is the pressure exerted by blood on the
walls of arteries. Normal blood pressure is considered to be a
systolic blood pressure of 120 millimetres of mercury and
diastolic pressure of 80 millimetres of mercury (stated as "120
over 80"). If an individual were to have a consistent blood
pressure reading of 140 over 90, he would be evaluated for
having high blood pressure. If left untreated, high blood pressure
can damage important organs, such as the brain and kidneys, as
well as lead to a stroke. Thus it becomes important to measure
blood pressure as it can lead to early diagnosis of diseases that
may be linked to high or low blood pressure. PTT is the time
taken by the arterial pulse propagating from the heart to a
peripheral site. This can be calculated from ECG signals and
PlethysmoGram signals. Since, PTT has been found to be
correlated to Blood Pressure, it is imperative to calculate PTT
accurately. In this paper, a relation has been developed between
PTT and Blood Pressure using regresssion analysis. Another
indicator, known as the Photoplethysmogram Intensity Ratio,
henceforth known as the PIR has also been used in estimation of
the Blood Pressure. The coding has been done in LabVIEW
which is has a graphical programming syntax that makes it
simple to visualize, create, and code engineering systems.
Ankle-Brachial Index (ABI) --Walif ChbeirWalif Chbeir
The anklebrachial pressure index (ABPI) or anklebrachial index (ABI) is the ratio of the blood pressure at the ankle to the higher of the brachial systolic blood pressures, which is the best estimate of central systolic blood pressure.
It is a noninvasive, simple, valid, reliable and cot effective test wich is used to detect lower extremity peripheral arterial disease (PAD), to measure the severity of atherosclerosis in the legs but is also an independent predictor of mortality, as it reflects the burden of atherosclerosis (5,16,17). However, alone it is not appropriate to detect PAD (Peripheral Arterial Disease) because of possibility of false-negative findings and does not give enough directions for revascularisation in term of localization and characterization.
Lower extremity peripheral arterial disease (PAD) is a frequent, chronic, progressive vascular disease and associated with significant morbidity and mortality.
ABI It is a noninvasive, cost effective and reliable test used to detect lower extremity peripheral arterial disease (PAD), to measure the severity of atherosclerosis in the legs but is also an independent predictor of cardiovascular events and mortality. However, alone this test is not appropriate to investigate PAD because of possibility of false-negative findings and does not give enough directions for revascularisation in term of localization and characterization.
Few contreIndications must be considered, especially in the setting of distal bypass.
Standardization of the technic is recommended as in AHA Scientific Statement.
Respiratory inductance plethysmography is a method of evaluating pulmonary ventilation by measuring the movement of the chest and abdominal wall. Accurate measurement of pulmonary ventilation or breathing often requires the use of devices such as masks or mouthpieces coupled to the airway opening.
Basics of Electronics can be view through this link
http://bit.ly/2PIOIQM
IJERA (International journal of Engineering Research and Applications) is International online, ... peer reviewed journal. For more detail or submit your article, please visit www.ijera.com
different methods for recording Rat ECG , BP and heart rate. it include both invasive and non invasive methods. techniques include Foot electrode apparatus , tail cuff plethysmography (noninvasive) etc
Hipotension e hipertension intraoperatoria y mortalidad a 30 dias.ramolina22
Hipotension e hipertension asociado a mortalidad a los 30 dias en cirugias no cardiacas. Intraoperative hypotension or Hypertension and 30 day mortality in noncardiac surgery
Comparison of Invasive vs Noninvasive Pulse Wave Indices in Detection of Signifi cant Coronary Artery Disease: Can We Use Noninvasive Pulse Wave Indices as Screening Test
The main objective of this project is to measure the heart pumping function continuously and with maximally non-invasive methodology in a medical setting arrangement. Thus this paper is aimed to determine the study of impedance plethysmographic method to evaluate the stroke volume changes. In this paper the blood flow analysis has been carried out with fuzzy logic tool box with various activities such as Dehydration, Physical exercise, Cool skin, Warm Skin and breathes hold activity. Immediately after measuring the blood flow with the help of Impedance plethysmography, the end systolic and end diastolic values are obtained with the help of echocardiogram for the 18 subjects both in the normal condition and immediately after holding the breathe for 25 seconds. For the 18 subjects the correlation coefficient is obtained in a linear fashion between the changes in peak amplitude of forearm impedance plethysmographic waveform and changes in stroke volume before and after the 25 second breathe holding activity. Finally the forearm impedance plethysmographic waveform can be used to analyze the heart beat changes in Correlation with the changes in heart stroke volume. The process could be monitored for the series of cycles in determining the heart pumping performance.
Design and Development of Arm Manikin for Blood Pressure and Pulse Simulation IJMER
The purpose of this study is to develop an arm manikin for oscillometric methods of blood
pressure measurement over full clinical range of blood pressure, heart rate. Blood pressure
simulator helps to resolve the uncertainties common in teaching students to take blood pressure.
Simulator allows the pre-setting of values for both systolic and diastolic pressures and provides an
excellent means to practice listening and distinguishing blood pressure sounds prior to actual
clinical experience. With this realistic unit, the student can find the preset results and the instructor
can unfailingly know if the student has performed the procedure accurately. The arm manikin is a
mould made up of rexine material which is coated with ethaflex as a skin material. A small rubber
tube is used as blood vessel and a small micro-speaker for heart beat listening. An external electronic
box is used to make students do the whole practice of blood pressure and pulse measurement. The
compressed air with 2x2 NC solenoid valve and other pneumatic accessories are used to create the
artificial pulses. A small micro-speaker with pre-recorded sound is used to generate heart beating
sound in the antecubital area. A blood pressure sensor MPX5050GP is used to sense the
sphygmomanometer dial pressure. PCB designed using a 16-bit micro-controller with on-chip ADC
and DAC. It has five keys and graphical 16x2 LCD for setting the simulation parameters including
the heart rate, systolic pressure, diastolic pressure.
Hemodynamic monitoring of critically ill patientsV4Veeru25
Hemodynamic monitoring measures the blood pressure inside the veins, heart, and arteries. It also measures blood flow and oxygen proportion in the blood. Monitoring hemodynamic events provides information about the adequacy of a patient's circulation , perfusion, and oxygenation of the tissues and organ systems. The effectiveness of hemodynamic monitoring depends both on available technology and on physician ability to diagnose and effectively treat the disease
EVALUATION OF PULMONARY HEMODYNAMICS AND ALTERATION IN DISEASE STATES
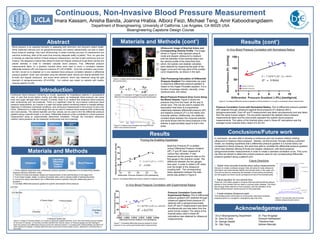
Research Poster
1. Continuous, Non-Invasive Blood Pressure Measurement
Abstract Materials and Methods (cont’)
Materials and Methods
Results
Results (cont’)
Conclusions/Future work
Department of Bioengineering, University of California, Los Angeles, CA 90025 USA
Bioengineering Capstone Design Course
Imara Kassam, Anisha Banda, Joanna Hrabia, Alborz Feizi, Michael Teng, Amir Kaboodrangidaem
Introduction
Blood pressure is an essential biometric in assessing both short-term and long-term patient health.
While traditional methods such as sphygmomanometry and arterial catheterization are able to obtain
blood pressure readings, they have shortcomings in areas including accuracy of measurement and
real-time monitoring, while at the same time ensuring adequate safety of patient. Thus, our goal was
to develop an alternate method of blood pressure measurement, one that is both continuous and non
invasive. We designed a method that utilizes B-mode and doppler ultrasound to get blood velocity and
arterial diameter in order to ultimately calculate blood pressure. First, differential pressure
measurements taken on a phantom brachial artery were used to prove a correlation between
differential pressure (dP) and base-line pressure (P1) (R2
=0.9058). Once this correlation was proven,
we then moved on to establish an in-vivo standard blood pressure correlation between a differential
pressure gradient, which was calculated using the obtained blood velocity and arterial diameter from
B-mode and doppler ultrasound, and actual blood pressure, which was measured using the gold
standard of sphygmomanometry (R2
=0.6759). Our method was tested on patients with healthy
vascular systems (n=26).
UCLA Bioengineering Department
Dr. Dino Di Carlo
Dr. George Saddik
Dr. Otto Yang
Acknowledgements
1. Prove enabling hypothesis that a differential pressure gradient corresponds to a corresponding baseline
pressure utilizing a phantom model
2. Perform B-mode and doppler ultrasound measurements on the brachial artery in the upper arm
3. From these images, obtain: a) radius of brachial artery and b) velocity profile of arterial blood flow
4. Convert the above parameters into a differential pressure gradient using the relationship given in
Equation 1
5. Correlate differential pressure gradient to systolic and diastolic blood pressure
Continuous blood pressure monitoring is crucial, especially for hospitalized patients in perioperative
care, or care that occurs before, during, and after surgery, as inadequate blood pressure can cause
brain and organ damage within minutes. Currently, there is no method that measures blood pressure
both continuously and non-invasively. There is a significant need for non-invasive continuous blood
pressure measurement, as it results in a safer and easier patient monitoring method in hospital settings,
diagnosis of otherwise overlooked conditions, and continuous measurement in the privacy of one’s own
home. Ultrasound is a viable technology that can be used to measure blood pressure both continuously
and noninvasively. The arterial diameter and flow velocity can be used to find the differential pressure
gradient along a specific length in an artery. Differential pressure is then correlated to a blood pressure
measurement using an experimentally determined correlation. Through the innovative ultrasound
method, blood pressure can be measured continuously and non-invasively.
Figure 3. Design of Phantom Model: a) Air piston to generate pulsatile fluid flow. b) Air inlet valve allows pressure release
for air piston to operate. c) Flowmeter provides standard flow velocity values. d) Pressure gauges provide readings of
base-line pressure and differential pressure across the measured section. e) Coupling tank holding ballistics gel allows for
clean ultrasound readings. f) Steady state fluid return pump returns fluid to water column, allowing for continuous flow in
the model.
Base-line Pressure (P) is plotted
versus Differential Pressure Gradient
(dP). P and dP were measured at
various flow velocities. P was
measured as the pressure read on the
first gauge in the phantom model. The
difference between the two gauges
was used in order to obtain a dP value
over the length of the ultrasound
coupling tank. The corresponding
linear regression between the data
points was plotted in Figure 6.
Proving the Enabling Hypothesis
Figure 6. Correlating differential pressure gradient to baseline pressure.
In-Vivo Blood Pressure Correlation with Experimental Radius
Pressure Correlation Curve with
Experimental Radius: Plot of differential
pressure gradient (dP) obtained through
ultrasound against blood pressure (P)
obtained with a sphygmomanometer.
Each dP and P measurement was taken
simultaneously and was taken from the
same human subject. The radius of the
brachial artery used in these dP
calculations was obtained by ultrasound
measurements.
Figure 7. Correlating differential pressure gradient to blood
pressure in-vivo using experimental radius measurements.
In-Vivo Blood Pressure Correlation with Normalized Radius
Pressure Correlation Curve with Normalized Radius: Plot of differential pressure gradient
(dP) obtained through ultrasound against blood pressure (P) obtained with a
sphygmomanometer. Each dP and P measurement was taken simultaneously and was taken
from the same human subject. The red points represent the diastolic blood pressure
measurements taken and the blue points represent the systolic blood pressure
measurements. The radius of the brachial artery used in these dP calculations was the
average human brachial artery radius of 2.25 mm.
Figure 8. Correlating differential pressure gradient to blood pressure in-vivo with a normalized radius measurement.
Blood Pressure-Pressure Drop Curve Along
the Blood Vessels: Figure 5 shows the
pressure drop from the heart, all the way to
venae cava. This can be used to explain the
assumption that there is a proportional
relationship between differential pressure (dP)
and baseline pressure (P1) in the elastic and
muscular arteries. Additionally, the relatively
constant slope between the muscular arteries
and aorta shows that the blood pressure in the
arteries is approximately equal to that in the
aorta.Figure 5. Pressure drop throughout the body from the
heart to the peripheral tissues.
Figure 4. Doppler and B-mode ultrasound images of
the brachial artery.
Equation 1. A derivation of Hagen-Pousielle’s equation to
determine the pressure gradient along the brachial artery.
Ultrasound- Image of Brachial Artery and
Corresponding Velocity Profile: The image
shown in Figure 4 was captured using B-
mode and doppler ultrasound to measure
both the diameter of the brachial artery and
the velocity profile of the blood flow from
which, the systolic and diastolic velocities
were obtained by measuring the peak of the
bigger curve and mid way point of the smaller
curve respectively, as shown in the right.
Data Processing-Calculation of Differential
Pressure Gradient:The relationship we used
to determine differential pressure gradient is
based on the Hagen-Pousielle equation. It is a
function of average velocity, viscosity, cross-
sectional area, and radius.
Dr. Paul Krogstad
Soroush Kahkeshani
Theodore Kee
Ashkan Maccabi
In conclusion, we were able to develop a continuous and non-invasive method utilizing
ultrasound to measure blood pressure. Namely, we first proved, through utilizing a phantom
model, our enabling hypothesis that a differential pressure gradient in a human artery can
correspond to blood pressure. We were then able to correlate the differential pressure gradient,
which was obtained utilizing B-mode and doppler ultrasound, with blood pressure
sphygmomanometer measurements in order to create a standard correlation curve. This curve
can then be utilized to determine a blood pressure value for any corresponding differential
pressure gradient along a patient’s arm.
Future Directions
• Obtain more accurate brachial artery radius measurements
We plan to create a software program that will utilize B-mode ultrasound
information and automatically identify the brachial artery in the upper arm.
This can be done by measuring the diameter of each artery and picking
out the largest one which would correspond to that of the brachial artery.
• Adjust equation for non-laminar flow
There are 15.8 million people in America that have atherosclerotic plaque
buildup in their arteries that can lead to coronary artery disease. The blood
flow through these arteries is more turbulent, and the utilization of the
Navier-Stokes theorem would account for this parameter.
• Create wireless ultrasound patch
This wireless patch will be able to continuously relay blood pressure
measurements to a companion smartphone app over time. Figure 9. Top and side view of concept
wireless ultrasound patch device