

![4Indian Public Health IT Assessment - National Health Systems Resource Centre and Taurus Glocal Consulting – 2011
www.nhsrcindia.org, www.taurusglocal.com
Duplication of systems and processes has created confusion in the minds of the users. Lack
of clear direction has led many States to stop using these IT systems.
TECHNOLOGY: The requirements of most of these systems are never frozen and are
constantly changing. This has technical repercussions, as well as adoption, maintenance and
continued usage issues.
Most of the public health IT systems studied were built as applications for a single purpose
rather than flexible products, capable of evolving over time. They lack a product life cycle
management approach. The Procurement process too is insensitive to product life cycle and
technology obsolescence.
The result is an extremely narrow self-limiting paradigm of static, one-time application
development for data entry alone. Applications have a poor and heavy form design. They
lack local data analysis capability and the reports too are not user friendly. A large number
of ad hoc reports are required and the online analytical processing power has not been
given to the users.
The big picture doesn’t emerge because all the public health IT systems have been
developed in silos and they lack integration standards like HL7 and XML.
Hardware and Network issues have contributed to low adoption. The hardware has often
become obsolete and has not been upgraded. The Directorates and States have not paid
attention to the hardware and network requirements. These have almost always came as
afterthoughts or as learnings from errors and problem and corrections attempted in
hindsight and with short term emergency problems to solve.
B) Situation Analysis – Working group documents and background papers
All working group papers have discussed their information technology requirements and
advanced suggestions for how IT architecture should be developed with respect to the
health sector. The High Level Expert group also has a sub-section dedicated to this theme.
There are significant points of convergence between the different recommendations.
However there are areas of divergence and varying concerns underlying different points.
One vision that emerges across papers – which could be an overarching goal or ambition, is
a National eHealth Architecture [NeHA], based on universal registration and biometrics,
which is dynamic and constantly updated health record of every citizen-family. It begins with
universal vital (demographic and identifiers) registration, which is portable and accessible to
service providers and to the families themselves. Based on this foundation a network links
all service providers, public and private laboratories and also generates the aggregate
figures needed at different levels for policy making and management. It also generates the
alerts needed for disease surveillance. Data fidelity is assured by triangulation with data
from periodic surveys and community based monitoring.
We need to confess that we have been actively trying to solve these needs for at least 15
years, and despite considerable expenditure, these past efforts have not yielded desired
results. We couldn’t achieve the dream because of ineffective change management in terms](https://image.slidesharecdn.com/publichealthitsystemstudy-180204120402/85/Public-health-it-system-study-5-320.jpg)
![5Indian Public Health IT Assessment - National Health Systems Resource Centre and Taurus Glocal Consulting – 2011
www.nhsrcindia.org, www.taurusglocal.com
of people, process and technology adoption. Currently procurement is insensitive to software
and hardware product lifecycle and technology obsolescence. Procurement and Support
process have to change to cater to the specific requirements of a public health IT paradigm.
C) Global eHealth Architectures
A recent editorial in Lancet, (Issue no 9791, pg 542, Aug 13, 2011) described the fate of a
similar project planned in the UK in 2002 that aimed at creating a fully integrated centralised
electronic care records system to improve services and patient care. The budget for the
undertaking was a substantial 11.4 billion pounds. Nine years on, the Department of Health
has spent 6.4 billion pounds on the project so far, but failed to meet its initial deadline and
has had to abandon the central goal of the project because it is unable to deliver a universal
system .
The centralised model of the UK has failed. Decentralised models adopted by countries like
Canada, Australia and Singapore are more successful. They have learnt from the failures of
the UK NHS (National Health Service) and improved upon it. India has a unique opportunity
to learn from all these global efforts in avoiding mistakes made and developing a unique and
innovative e-health model.
Canada Health Infoway [CHI], the Healthcare-IT Czar of Canada has published a National
eHealth Architecture [Blue-Print] and attached relevant funding with it. The blueprint is a
centrally defined reference architecture that serves as a guideline to various regional
eHealth projects. Projects are funded if they comply to the blue-print. Likewise the Regional
Health Authorities [RHA] have published their own flavours of the blue-print and allocated
additional funds for eHealth projects that comply with the blue-print.
This democratic change management is a successful paradigm where the States/ Regions
are free to develop their own systems for local planning, monitoring and evaluation.
However the IT systems developed by the States, Regions and Disease programs will be
funded from the centrally allocated funds only if they conform to the eHealth Architecture
[Blue-Print] published by CHI and RHAs.
D) Recommendations
Innovation is a culture not a strategy. A culture of innovation has to be nurtured in a highly
democratic way. Organizations not designed ‘ground up’ for innovation will not be creative
because innovation is disruptive by nature.
Traditionally Indians have used their ingenuity to find the ‘Jugaad’ that works around the
paucity of resources and funds. Somehow we have lost it along the journey towards
modernization and this Jugaad paradigm didn’t permeate into our modern education system
and work ethic. In many ways our current paradigms don’t promote innovation. We need to
build a democratic culture which nurtures and nourishes innovation. Democratic change is
slower but more effective as compared to a centralised command and control model.](https://image.slidesharecdn.com/publichealthitsystemstudy-180204120402/85/Public-health-it-system-study-6-320.jpg)
![6Indian Public Health IT Assessment - National Health Systems Resource Centre and Taurus Glocal Consulting – 2011
www.nhsrcindia.org, www.taurusglocal.com
The Centre should establish a National eHealth Authority [NeHA] to define the overall
Healthcare-IT architecture [blue-print] and allow each State, District and National program
to build their own IT systems that conform to the guidelines given in the blueprint. Attach
the funds to this National eHealth Architecture and make it mandatory for National and
State disease programs to comply with the blue-print architecture for getting the funding.
The States will have the space and freedom to innovate and adopt systems that are best
suited to their individual styles of functioning and local / regional culture, without
compromising the integrity of the overall programme. The maturity of adoption at the States
and Districts level will develop over time, but till then NeHA should play a strict regulatory
role that shouldn’t allow too much of divergence from the blue-print irrespective of funding
from the central pool.
This Healthcare-IT architecture blue-print should be like a town planner’s blue-print laying
down the standards for the buildings, open spaces, parks, roads, water inlets and sewer
outlets etc. – such that all colonies are free to do their own development as long as they
comply to the overall guidelines given in the blue-print and are thus able to be integrated
seamlessly into the town.
The Healthcare-IT architecture blue-print should have standards for Technology, Process
and People.
1. Technology – The blue print should address standards for Identifiers, vocabulary,
diagnosis/ procedure/services code sets, data storage, data privacy and security,
data integration, data retrieval, data analysis, information usage, hardware and
network.
2. Process – The process of implementation is just as important as the technology
itself. The blue-print should broadly specify who is allowed to do what, when, where
and why.
3. People – Capacity building is required for implementing the technology. The blue
print needs to specify the human resource capacity building in terms of quantity and
quality of Healthcare-IT trained staff. This should include academia, academia-
industry alliances and vocational training programs.
Procurement of the software, hardware and network is just as important as conformance to
the architecture itself. Need to strengthen and standardize procurement for public health IT,
which would ensure that learning from both our past as well as public health IT experiences
of other countries, are fully incorporated into future plans. Currently procurement is
insensitive to software lifecycle and technology obsolescence. There is little traceability of
software life cycle documentation. Either the sponsoring Directorates didn’t ask for the
documentation from the vendor or the vendor didn’t maintain the documents.
The history of Healthcare-IT systems reveals that a slow democratic transition from paper
based processes to electronic processes improves adoption and paves the way for
innovation. Resistance to change is a problem that needs to be addressed step-by-step over
time. Sudden change makes the frog jump out of the hot water.](https://image.slidesharecdn.com/publichealthitsystemstudy-180204120402/85/Public-health-it-system-study-7-320.jpg)
![8Indian Public Health IT Assessment - National Health Systems Resource Centre and Taurus Glocal Consulting – 2011
www.nhsrcindia.org, www.taurusglocal.com
India has various public health IT systems existing in silos. Most of the public health IT
investments at national and state levels have gone into reproductive and child health [RCH]
due to the high IMR and MMR in the country. We have 2 RCH systems at the national level –
MCTS and Web Portal, whereas DHIS is reporting facility-based RCH data from district level
in many states. MCTS is patient-based reporting whereas Web Portal is designed for facility-
based consolidated reporting. On the other hand there are IT systems developed by national
disease programs such as malaria [NAMMIS], AIDS [NACO] and disease surveillance [IDSP].
Some states like Gujarat [eMamta] is reporting patient-based RCH data whereas TN [HMIS]
is reporting area-wise consolidated RCH data. To overcome the data silos, both Gujarat and
TN states have conceptualised the integration of various public health IT systems within
their own states.
This is an assessment of public health IT systems in India. While it was not possible to study
every system existing, we have picked up a representative set. It is an attempt to learn from
the past, look forward and leap ahead. The findings and recommendations will feed into the
12th
Plan and the ICT sub-group of the Healthcare SIC.
The following findings are based on the assessment of functional efficacy and continued
operational need for the public health IT systems. Almost all the public health programs
encountered the same/similar issues and there is a lot of commonality in the learnings
across the various systems studied. We present these common findings, best practices and
learnings without direct reference to any specific IT system unless necessary. For each IT
system specific discussions please refer to the individual system sections of this report.
A. LEARNINGS
Various national programs and States have taken the lead for building their own IT systems.
However most of them have not achieved their own objectives. The key reasons are as
follows:
a. PEOPLE LEARNINGS
I. Capacity building and change management: Current capacity building efforts
across all Public Health Information Systems are grossly inadequate. Capacity
building is limited to - One time trainings at local level with ad hoc refresher trainings
on need basis. There is no published schedule of regular and sustained trainings.
Only class room trainings are considered as a common medium across all programs;
no other interactive training methods are used for consistent support to the users to
solve their day-to-day issues. Systems also lack quality training guidelines and
protocols for data collection, reporting, verification and error management. In most
of the programs, process protocols have not been developed and in some have not
even been thought of. Dedicated teams for post training support and follow-up have
not been created.
History of Healthcare-IT systems clearly indicates that one can’t achieve adoption by
forcing the workers to do anything. The only successful model to improve adoption is](https://image.slidesharecdn.com/publichealthitsystemstudy-180204120402/85/Public-health-it-system-study-9-320.jpg)
![11Indian Public Health IT Assessment - National Health Systems Resource Centre and Taurus Glocal Consulting – 2011
www.nhsrcindia.org, www.taurusglocal.com
version control for each release. The systems have turned into applications that are
constantly in flux.
Procurement is insensitive to software lifecycle and technology obsolescence. The
software development lifecycle documents were not traceable in most of the public
health IT systems - requirements document, functional and technical design
documents, test plans and test reports. Most of the systems didn’t have any
documentation or rather the documentation was limited to user manuals. Either the
sponsoring Directorate didn’t ask for the documentation from the vendor or the
vendor didn’t maintain the documents. In either case - Technically this is a
dangerous situation because it renders the system unviable for the long-term use. A
detailed technical evaluation was out of the scope of this study; however it is
recommended to technically audit all the IT systems as per SDLC, PLM, ITIL, PMBOK,
ISO and CMMI standards.
V. Limited options for data entry - Currently almost all systems are grappling with
poor data entry status. However systems provide manual data entry interface and no
other interfaces are enabled such as Excel, Imports, Mobile, and IVR etc. Users also
don’t have the flexibility to switch to aggregated data entry when patient based
details are not available. Most of the systems also don’t have the flexibility to change
hierarchy of data entry when disaggregate facility data is not available.
VI. Poor and Heavy Form Design – Very little attention has been paid to user
friendliness and forms design for slow speed networks. Forms are heavy and take a
long time in loading on slow connections. The forms have multiple drop-down and
options that need to be loaded from the server. In some systems lot of horizontal
scroll forces the use of mouse and thus slows down the work.
A good gauge of simplicity is often the number of panels that must be displayed and
the number of mouse clicks or keystrokes that are required to accomplish a
particular task. All of these should be minimized. The fewer things users have to see
and do in order to get their work done, the happier and more effective they will be.
This is especially important on slow speed connection to the server.
In a good design, all the forms should be of approximately same length and similar
data element types and should take approximately the same amount of time to fill.
It’s a bad design to have forms of different lengths. A long form should be split into
2 if it needs a lot of scrolling.
Long and heavy forms are slow to load on a slow speed network connection. It is
frustrating for the user to keep waiting for a long and heavy form to load.
VII. Local Data Analysis – Just as in the paper based system, the analytics was not
provided at every level. Only the higher levels [Centre, State & in some cases
District] had the analysis capability and the facilities in the lower hierarchy were at
best given some fixed report formats. The lower facilities would be informed only on
need to know basis. Therefore there was no motivation in the lower hierarchy to
enter data in electronic systems. Planning at district level is not established. Data](https://image.slidesharecdn.com/publichealthitsystemstudy-180204120402/85/Public-health-it-system-study-12-320.jpg)
![12Indian Public Health IT Assessment - National Health Systems Resource Centre and Taurus Glocal Consulting – 2011
www.nhsrcindia.org, www.taurusglocal.com
analysis is not geared to meeting needs of the Decentralised user – what’s in it for
them.
Most of the systems are currently working as a reporting tool rather than program
management information systems. Part of the problem is due to the excessive
burden of unnecessary data elements and lack of program monitoring indicators in
the system. Indicators and reports which are available, merely focus on data entry
and reporting completeness rather than supporting program management.
VIII. User Friendly Reports - Wherever the functionality to generate reports is
provided, Report generation is not user friendly. Many reports can’t be seen online;
to view they have to be downloaded on the local disk. User can’t slice, dice, drill
down or drill-up. Some systems use SAS in the back-end for data analysis. Although
SAS is a very powerful analytics engine; but these systems don’t come across as
using the power of SAS in the back-end.
IX. Ad hoc reports and OLAP - The systems have fixed predefined report formats.
The flexibility to produce your own reports is lacking in the system. Lots of ad hoc
reports are required which couldn’t be thought of at the time of software system
design. The support team spends a lot of time producing these ad hoc reports.
Rather an online analytical processing [OLAP] functionality would have gone a long
way to enable the users to produce their own reports.
X. Data Privacy & Security - Most of the Public Health IT systems don’t follow
common data security norms and have not been built with a purpose to ensure
confidentiality, security & privacy of public health data. It is easy to identify a
community from aggregate numbers; whereas a patient can be identified from
Patient based reporting systems. Therefore data security & privacy need to be
maintained in aggregate number reporting systems as well as patient based system.
Whenever Data Security Bill becomes a law, protecting health data will become
mandatory in India. Therefore it is prudent to design public health IT systems to
ensure data security and privacy.
XI. Integration - The need for integration between the public health IT systems was
felt and discussed but was not implemented due to technical and administrative
structural rigidities. All the public health IT systems have been developed in silos and
they lack integration standards like HL7 and XML. Also the master data is not tuned
for integration. Each IT system has a different way of looking at the master data.
The public health data makes more sense when integrated across different
programs. There is a need to facilitate exchanging of health information across
systems such that the big picture can emerge e.g. Malnutrition data of a block in one
system and the deaths and incidence of acute respiratory infection from another
system.
XII. Hardware and Network issues – The Directorates provided the funds to the
States for the hardware and network. However the States lacked knowledge of
hardware and needed support for procurement and maintenance of computers.](https://image.slidesharecdn.com/publichealthitsystemstudy-180204120402/85/Public-health-it-system-study-13-320.jpg)
![17Indian Public Health IT Assessment - National Health Systems Resource Centre and Taurus Glocal Consulting – 2011
www.nhsrcindia.org, www.taurusglocal.com
Innovation is a culture not a strategy. A culture of innovation has to be nurtured in a highly
democratic way. Organizations not designed ‘ground up’ for innovation will not be creative
because innovation is disruptive by nature.
Traditionally Indians have used their ingenuity to find the ‘Jugaad’ that works around the
paucity of resources and funds. Somehow we have lost it along the journey towards
modernization and this Jugaad paradigm didn’t permeate into our modern education system
and work ethic. In many ways our current paradigms don’t promote innovation. We need to
build a democratic culture which nurtures and nourishes innovation. Democratic change is
slower but more effective as compared to a centralised command and control model.
The Centre should establish a National eHealth Authority [NeHA] to define the overall
Healthcare-IT architecture [blue-print] and allow each State, District and National program
to build their own IT systems that conform to the guidelines given in the blueprint. Attach
the funds to this National eHealth Architecture and make it mandatory for National and
State disease programs to comply with the blue-print architecture for getting the funding.
The States will have the space and freedom to innovate and adopt systems that are best
suited to their individual styles of functioning and local / regional culture, without
compromising the integrity of the overall programme. The maturity of adoption at the States
and Districts level will develop over time, but till then NeHA should play a strict regulatory
role that shouldn’t allow too much of divergence from the blue-print irrespective of funding
from the central pool.
This Healthcare-IT architecture blue-print should be like a town planner’s blue-print laying
down the standards for the buildings, open spaces, parks, roads, water inlets and sewer
outlets etc. – such that all colonies are free to do their own development as long as they
comply to the overall guidelines given in the blue-print and are thus able to be integrated
seamlessly into the town.
The Healthcare-IT architecture blue-print should have standards for Technology, Process
and People.
a. Technology – India should learn from the decentralised eHealth architectures of other
commonwealth countries like Canada, Australia and Singapore. However avoid the
mistake of centralised eHealth model developed by NHS UK. Ultimately all Public Health
IT systems have to converge to a Health Information Exchange. The blue print should
address standards for Identifiers, vocabulary, diagnosis/ procedure/services code sets,
data storage, data privacy and security, data integration, data retrieval, data analysis
and information usage.
I. National eHealth Authority [NeHA] needs to have the mandate to design, publish,
execute and regulate the National eHealth Architecture [Blue-Print] as per standards for
vocabulary, data, input/output, storage, integration, hardware and network. Attach the
funds to this National eHealth Architecture and make it mandatory for National and](https://image.slidesharecdn.com/publichealthitsystemstudy-180204120402/85/Public-health-it-system-study-18-320.jpg)
![18Indian Public Health IT Assessment - National Health Systems Resource Centre and Taurus Glocal Consulting – 2011
www.nhsrcindia.org, www.taurusglocal.com
State disease programs to comply with the blue-print architecture for getting the
funding.
II. The blue-print should have local, regional and state health information exchanges [HIE]
that feed the national health information network [NHIN]. A centralised health
information exchange [HIE] has to emerge for every state that will be used for
exchanging health information. The HIE should have a data warehouse to analyse the
consolidated public health data. We should adopt a federated structure where the data
is pulled on-demand; whereas we should stay away from central data repository model
because it becomes unwieldy and too expensive over time. The HIE pulls up only that
data that is required for consolidated data analysis or health record portability. The
patient registry will have entries for the diseases being tracked and will also cater to
population migrations where the portability of patient-based health record is important.
III. Minimum Data Sets and Standards – The blue-print should define the minimum data
sets in terms of Indicators that should be captured for each reportable disease. The
vocabulary should be standardised as per SNOMED standards. The diseases should be
coded as per ICD 9 and ICD 10 standards and procedures/services should be coded as
per CPT standards. The standard vocabulary and code sets make sure that everyone
speaks the same language. This also goes a long way in public health resource planning
and epidemiological research – incidence, prevalence and surveillance.
IV. Flexible Data Input - The Public Health IT system should be designed to be flexible so
that it allows inputs in consolidated [District-wise or facility-wise] as well as granular
[patient-based] models. Based on readiness, allow the States to decide mode of data
entry – consolidated, facility-wise or patient-based; as long as the published
architecture and standards for vocabulary, data, input/output, storage, integration,
hardware and network are followed. Patient-based tracking should not become a pre-
requisite for any public health IT system. In the absence of patient-based EMR, the
public health IT system should be able to work on consolidated numbers alone.
a. Basic – The SC/PHC/CHC/DH should do the data entry on paper and the District enters
the consolidated numbers into the public health IT system. In this case the patient
registry will not have any data from such States/Districts.
b. Regular - The patient-based tracking should be done by the EMR at the point-of-care
and consolidated numbers should be fed by the EMR into the public health IT system
through a standards based integration. As per the current efficiency and training levels
in the country, the regular patient-based data entry directly into the IT system is
possible if the hospital/clinic is seeing less than 10 patients per hour on an average.
The patient registry will have entries for the diseases being tracked and will also cater
to population migrations where the portability of patient-based health record is
important. This registry based model is suitable for Cancer and some chronic diseases,
whereas acute illness like common cold will not reach the registries unless we are
tracking epidemic flues.
c. Advanced - The patient-based tracking should be done by the EMR at the point-of-care
and consolidated numbers should be fed by the EMR into the public health IT system
through a standards based integration. The patient and disease registries will be
populated with top 20 diseases for public health resource planning, surveillance, and
early warning. To implement this advanced data entry model across the board will](https://image.slidesharecdn.com/publichealthitsystemstudy-180204120402/85/Public-health-it-system-study-19-320.jpg)
![19Indian Public Health IT Assessment - National Health Systems Resource Centre and Taurus Glocal Consulting – 2011
www.nhsrcindia.org, www.taurusglocal.com
require a lot of maturity in terms of people and process. Whereas in reality this will not
be sequential, some States/Districts will move ahead and adopt the advanced data
entry and others will be still doing regular or basic level data entry.
V. Flexible Data Output – The blue-print should specify data analytics framework so that it
can become flexible and capable of catering to local, District, State and National
analysis and reporting requirements. This includes:
1. National Data Warehouse – Blue-print should define a National level data warehouse in
the NHIN to analyse the consolidated data and produce indicator based reports from
source systems.
2. Local Data Analytics - Blue-print should define a local data mart in every State HIE. The
blue-print should provide online analytical processing [OLAP] for the users at all levels
to generate their own reports needed to take local action. The users should be able to
save the report format and define the frequency at which the reports should be
populated with data and sent to them. This will significantly enhance acceptability,
usability and adoption.
VI. Storage – The systems should have online and offline modes to ensure the continuity of
work even though connectivity maybe lost due to any reason. The local offline database
should remain in sync with the online database.
VII. Integration – All public health IT systems should be designed for integration based on
known standards such as HL7, DICOM, XML etc. Point-to-point integration is a short
term approach. Ultimately all Public Health IT systems have to converge to a Health
Information Exchange.
VIII. Single System – Field workers at District/CHC/PHC shouldn’t be burdened to report on
multiple systems. Multiple Disease specific applications are neither economical nor a
good software design. Rather the Public Health IT product should follow the standard
architecture [blue-print] and have a flexible design such that it can be applied to any
disease and region specific reporting. The system should have flexibility to define its
own data elements, forms, workflow, reporting frequency and report formats. That way
it is easy to integrate the different implementations of the same architecture and
aggregate the data at any level for analysis. Also it takes off the load from the field
staff, as they have to report in one system. This will go a long way in improving the
adoption of Health IT systems.
IX. Multi modal connectivity- The data can be transmitted over multiple networks including
fixed line broadband, wireless, mobile etc. The systems should work on LAN/WAN via a
fibre optic cable to every facility as well as provide connectivity to the field worker
through broadband on GSM and CDMA based mobile platforms. Mobile is a viable option
with the bandwidth increasing on the mobile platforms. Interactive voice response [IVR]
over a phone is another way to get data input from the field workers. The redundancy
is by design to ensure connectivity to the system always.
X. The field workers should be trained and enabled with low cost mobile platforms to enter
patient-based and facility-based data directly from the field. This will avoid overloading
of the district resources; and also improve the accuracy of the data. This change
obviously requires a big change management and should be done step by step.
XI. Registries - The heart of the HIE is a registry based model that has disease, facility and
patient registries upto the district and state level. The registry will have metadata that](https://image.slidesharecdn.com/publichealthitsystemstudy-180204120402/85/Public-health-it-system-study-20-320.jpg)
![20Indian Public Health IT Assessment - National Health Systems Resource Centre and Taurus Glocal Consulting – 2011
www.nhsrcindia.org, www.taurusglocal.com
points to the details in the source systems. The indicators derived from the state
disease registries should be rolled up to the central disease registry for reporting.
However drill down should be available to get granular data on demand.
XII. Unique Identifiers - Patient, healthcare staff and health facility needs to be uniquely
identified. System should generate a unique ID based on other IDs such as - Adhaar
[UIDAI], Voter ID, Ration card ID, PAN# that can be used as a patient identifier for the
patient registry.
XIII. Push Disease Specific care plans and protocols – The Architecture should mandate that
disease specific care plans and protocols are provided as guidelines in consolidated data
reporting systems. In the patient-based reporting systems, the disease specific care
plans and protocols should be built into the form design, so that the field staff doesn’t
forget a step or a service.
XIV. Push Disease Specific Alerts and Reminders – Based on data analysis in the background
the system should be able to provide disease specific alerts to the field staff. The
reminders are in terms of any service delayed or missed out from the work plans. The
alerts and reminders can be sent on the mobile phones via SMS or flashes on the web
portal whenever the person logs in.
XV. Social Networking – The Architecture should encourage a platform for lateral interaction
between facilities, districts, states etc. So that common issues can be sorted out
amongst each other. Also it enables the collective knowledge to grow faster than silos
created by hierarchical command and control.
XVI. GIS – The architecture should encourage the plotting of disease, facility, staff and
patient data on geographical maps e.g. google maps. The disease incidence, prevalence
and surveillance can be mapped on the geographical information system for easier
viewing and faster decision making for interventions.
XVII. Data privacy and security – The blue-print should ensure that the HIE/NHIN has unique
identifiers and registries to provide access rights to all the stakeholders. Only the
person, who needs to see, gets to see the data or use it. Likewise detailed audit trails
are also required to make sure all transactions are recorded for auditing and roll-back.
Further all data communication needs to be encrypted to ensure data security.
b. Process - The process of implementation is just as important as the technology itself.
The blue-print should broadly specify who is allowed to do what, when, where and why.
Paper based process thinking has to give way to the electronic system based processes
and protocols. Again this requires a massive change management.
c. People - Capacity building is required for implementing the technology. The blue print
needs to specify the human resource capacity building in terms of quantity and quality
of Healthcare-IT trained staff. This should include academia, academia-industry
alliances and vocational training programs. Skills of the staff have to be upgraded to
achieve the change in culture. Requires a massive change management. The existing
staff has to be trained in a Healthcare-IT paradigm. Sustained training, help desk,
message boards, discussion forums, user group support is required for improved
adoption. Also new breed of Healthcare Business Analysts have to emerge that will
have knowledge of healthcare, management and IT. These Analysts have to work with](https://image.slidesharecdn.com/publichealthitsystemstudy-180204120402/85/Public-health-it-system-study-21-320.jpg)
![21Indian Public Health IT Assessment - National Health Systems Resource Centre and Taurus Glocal Consulting – 2011
www.nhsrcindia.org, www.taurusglocal.com
the program managers to define the requirements of the public health IT systems. An
ICT cell has to be created in the Dept of Health at every State, District, Block and
Municipality that will work with the National eHealth Authority [NeHA].
Procurement - Strengthen, standardize globally accepted public health procedures for
software procurement for healthcare, which would ensure that learning from both our past
as well as public health IT experiences of other countries, are fully incorporated into future
plans. The procurement should ensure that the project management follows PMBOK
standards or equivalent. The software product life cycle and related documentation should
be as per SEI-CMMI standards or equivalent. Currently procurement is insensitive to
software lifecycle and technology obsolescence. There is little traceability of software life
cycle documentation. Either the sponsoring Directorates didn’t ask for the documentation
from the vendor or the vendor didn’t maintain the documents. From a technical perspective
this is a dangerous situation and needs to be prevented at all cost.
Some States and National programs will take the lead while others will trail. The efforts for
establishing the National eHealth Authority [NeHA] have to start early for the blue-print to
become available and the implementation to start. Meanwhile the culture of electronic data
has to be established by enhancing the adoption of existing systems. The options are:
a. Current system - Retain and re-implement current system
b. Current system Plus - Enhance current system wherever used, and put in new
system with integration between the two systems
c. New system - Completely replace system with new system with internationally
accepted standards of public health software procurement.
The history of Healthcare-IT systems reveals that a slow democratic transition from paper
based processes to electronic processes improves adoption and paves the way for
innovation. The resistance to change is a problem that needs to be removed step-by-step
over time. Sudden change makes the frog jump out of the hot water.
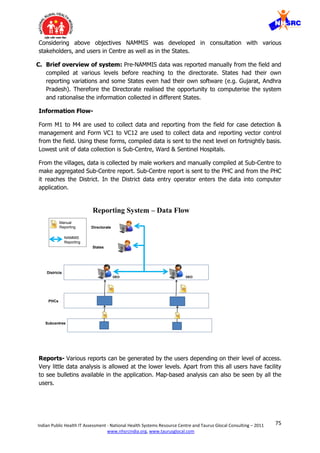
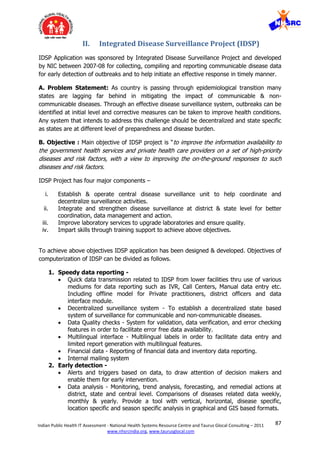
Conceptual Architecture depicting the State Health Information Exchange [HIE] where all the different public
health IT systems, patient based reporting systems and other related systems get integrated.](https://image.slidesharecdn.com/publichealthitsystemstudy-180204120402/85/Public-health-it-system-study-22-320.jpg)
![22Indian Public Health IT Assessment - National Health Systems Resource Centre and Taurus Glocal Consulting – 2011
www.nhsrcindia.org, www.taurusglocal.com
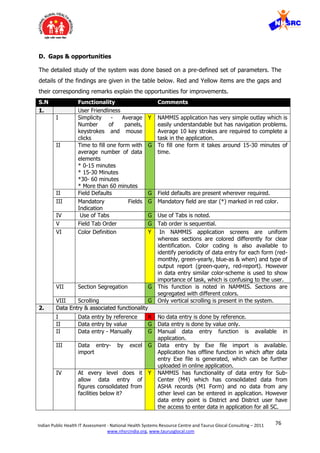
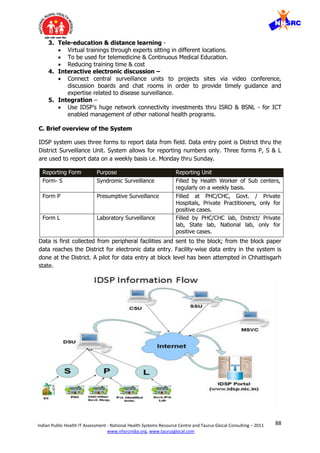
Conceptual Architecture of the National Health Information Network [NHIN] that is essentially an HIE too at
the National level. HIE should be built at every State level and then aggregated into the NHIN at the National
level.](https://image.slidesharecdn.com/publichealthitsystemstudy-180204120402/85/Public-health-it-system-study-23-320.jpg)
![23Indian Public Health IT Assessment - National Health Systems Resource Centre and Taurus Glocal Consulting – 2011
www.nhsrcindia.org, www.taurusglocal.com
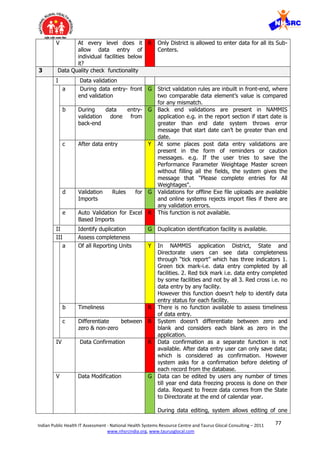
Conceptual Architecture of the components inside the Health Information Exchange [HIE].
The NHIN is also an HIE at the national level; it aggregates the data from various state level
HIEs on demand.
1 – National portal for national level public health agencies to look at the data in the
NHIN/HIE. The portal is a presentation layer that may have multiple repositories behind it.
2- State portal for state level public health agencies to look at the data in the NHIN/HIE.
The portal is a presentation layer that may have multiple repositories behind it.
3- District/Facility portal for District/Facility level public health agencies to look at the data in
the NHIN/HIE. The portal is a presentation layer that may have multiple repositories behind
it.
4- Admin portal to provide access rights to all the stakeholders. Only the person who needs
to see, gets to see it or use it. Data privacy, security and monitoring of the system will be
done by system administrator usually provided by a trusted IT vendor
5- All stake holders can access the system through the advanced mobile platforms like
Blackberry or Palmtops and they can receive SMS on basic mobile phones
6- All stake holders can access the system on laptops or desktops through the
LAN/WAN/Internet network
7- System has a standard terminology dictionary such as SNOMED to make sure that
everyone uses a standard set of keywords e.g. congestive cardiac failure, congestive heart
failure, myocardial infarction are understood as synonyms by the data warehouse and
analytic engine. Similarly the diagnosis, procedures/services are coded by standard codes
such as ICD and CPT respectively.
8- Unique identifier is assigned by the HIE to every person in the registry based on the data
in the registry - demographics and secondary identifiers such as voter ID, ration card #,
PAN# etc. UID/AADHAR can also be used in place of this system generated UID. Till
UID/AADHAR becomes available, Enterprise Master Person Index [EMPI] technology can be
used for system generated UID. The UID is important for uniquely identifying the patient
while pulling the relevant data from the source systems on-demand and also ensuring the
data privacy and data security. The UID will be populated only when patient-based data is
collected. The UID is not populated in basic data entry where only consolidated numbers are
entered into the public health system.
9- Data warehousing and reporting engine is used for data analysis such as slicing and
dicing. It’s a tool used for picking up only the relevant pieces of data from a bigger data set.
It is used when the user demands any analysis/report through the portal.
10- Patient registry is a unique list of all the patients in the system. If a patient shifts from
one location to another, the new location checks the registry before making a new record.
UID database works with the registry to make sure there are no duplicates. The UID is
important for uniquely identifying the patient while pulling the relevant data from the source
systems on-demand and also ensuring the data privacy and data security. The UID will be](https://image.slidesharecdn.com/publichealthitsystemstudy-180204120402/85/Public-health-it-system-study-24-320.jpg)
![26Indian Public Health IT Assessment - National Health Systems Resource Centre and Taurus Glocal Consulting – 2011
www.nhsrcindia.org, www.taurusglocal.com
Canada Health Infoway - Executive Summary
Canada Health Infoway a federally-funded, independent, not-for-profit organization, has
been created to foster and accelerate the development and adoption of electronic health
record (EHR) systems with compatible standards and communications technologies. Infoway
works with the country’s ten provinces and three territories to implement private, secure
EHR systems, enabling best practices and successful projects in one region to be shared or
replicated in other regions for sharing critical healthcare information. Infoway and all levels
of government in Canada have committed to provide the residents of Canada and their
health care providers timely, appropriate and secure access to the right information when
and where they enter into the health care system.
Infoway, together with its 14 jurisdictional partners, developed Vision 2015, an information
and communications technology roadmap for health care in Canada.
It represents the initiatives that jurisdictions want to achieve as a country and consists of 5
key priorities:
Complete the work underway in Electronic Health Records, Telehealth and Public
Health Surveillance,
Implement Electronic Medical Record (EMR) systems in physician offices and Provider
Order Entry systems in hospitals,
Deploy Wait Time Management Systems,
Implement Consumer Health Solutions to support self-care, and
Integrate Chronic Disease Management systems, starting with Diabetes.
Infoway received its most recent funding allocation of $500 million as part of the Federal
Government’s Economic Action Plan. Infoway has dedicated the bulk of this funding to
ensuring that Canadian physicians adopt and use electronic health care information systems
in their office settings.
Canada Health Infoway [CHI], the Healthcare-IT Czar of Canada has published a National
eHealth Architecture [Blue-Print] and attached relevant funding with it. Blue print is a
reference architecture that serves as guidelines for the eHealth projects. The projects get
funded if they comply with the blue-print. Likewise the Regional Health Authorities [RHA]
have published their own flavours of the blue-print and allocated additional funds for
eHealth projects that comply with the blue-print.
The technology Blueprint is a guide for the development of electronic health records. The
EHR Blueprint is reference architecture useful to information technology professionals, in
governments, health regions and hospitals planning to implement electronic health record
solutions. It is also valuable to technology vendors who want to align their products and
services with Canada's vision for the interoperable electronic health record. This architecture
is like a town planner’s blue-print laying down the standards for the buildings, open spaces,
parks, roads, water inlets and sewer outlets etc. – such that all colonies are free to do their
own development as long as they comply to the overall guidelines given in the blue-print
and get integrated seamlessly into the town
The plan to bring a fully functioning electronic health record network to all Canadians calls
for three core components: Storage, Point of Care Systems and Connection. The Storage is
built around six Registries - Client Registry, Provider Registry, Diagnostic Imaging ,
Laboratory Information repositories, Drug Information repositories, Other information](https://image.slidesharecdn.com/publichealthitsystemstudy-180204120402/85/Public-health-it-system-study-27-320.jpg)
![27Indian Public Health IT Assessment - National Health Systems Resource Centre and Taurus Glocal Consulting – 2011
www.nhsrcindia.org, www.taurusglocal.com
repositories - such as clinical and immunization reports. The "point of care systems"
component of the Blueprint makes sure that all health care facilities in Canada have
consistent systems in place to send, retrieve and manage critical health information.
Currently, based on the current systems in place, some facilities can adopt health records
right away, while others need to be upgraded, or need new electronic systems to be built.
The connection component provides the plumbing to allow all types of health information to
move between all points of care in the community, within the province and eventually across
the country.
Infoway will cost a total of $10 billion to implement, $1.5 billion per year to operate and will
generate approximately $6 billion in annual benefits. The benefits would come from
specified improvements in access, quality and productivity to the Canadian health care
system.
To focus the agenda, Infoway drew a line stating that “by 2010, 50 per cent of Canadians
will have their electronic health record available to their authorized health care providers”.
This call to action has been achieved, with 49 per cent of electronic health records available
to authorized providers as of December 2010.
In 2009, the investments in diagnostic imaging had shown cost reductions of almost $1
billion a year.
In 2010, an early evaluation of Infoway funded drug information systems showed that they
generated $436 million worth of annual benefits; resulting from increased productivity of
doctors and pharmacists, increased patient compliance with medications, increased patient
safety and reduced preventable adverse drug events. These are only the initial benefits.
This democratic change management has been a successful paradigm where the States/
Regions are free to develop their own systems for local planning, monitoring and evaluation.
However the IT systems developed by the States, Regions and Disease programs got funded
from the allocated funds if they conformed to the eHealth Architecture [Blue-Print] published
by CHI and RHAs.
References
1. https://www.infoway-inforoute.ca/lang-en/about-infoway
2. https://www2.infoway-inforoute.ca/Documents/Infoway_Sum.Corp.Plan.2011-
2012_EN.pdf.
3. https://www.infoway-inforoute.ca/about-ehr/advancements.](https://image.slidesharecdn.com/publichealthitsystemstudy-180204120402/85/Public-health-it-system-study-28-320.jpg)
![34Indian Public Health IT Assessment - National Health Systems Resource Centre and Taurus Glocal Consulting – 2011
www.nhsrcindia.org, www.taurusglocal.com
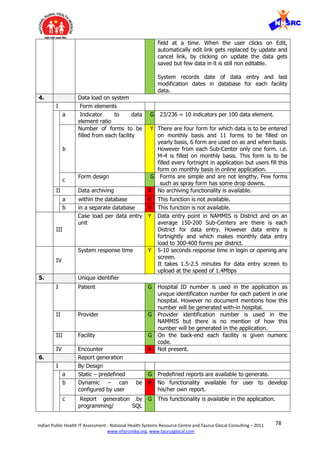
Reproductive Child Health IT Systems
I. National HMIS Web Portal
Web Portal has been developed for HMIS data reporting under NRHM. Web Portal
development was sponsored by MoHFW and technical development was done by iBuilt
technologies in 2008.
A. Problem Statement- MoHFW was getting paper data from the states with
inconsistency in frequency and format and a time lag of 2-3 months. Also the paper
system wasn’t tuned towards district level data analysis for local action.
B. Objectives of developing the system-To build an effective decision support system
to monitor and evaluate the impact of NRHM and provide key inputs for health related
policy formulation and interventions.
This broad objective can be divided into these sub objectives.
1. Real time data reporting- Which will strengthen the monitoring and will enable policy
makers to make better decisions for public health delivery.
2. Data to Information continuum- The portal will help converting the data locally into
useful information, management indicators, trends etc which could be displayed
graphically in the reports.
3. Improving data availability and quality - The new system envisages enhancing the
information flow at various levels and providing useful and timely inputs for program
development, monitoring and midcourse interventions in the policies.
4. Feedback – System will be able to provide feedback to lower facilities.
5. Central hub of all data- Portal will slowly initiate facility-wise data entry and will have
all health related data into one platform.
6. Advance analysis & integration- The portal will be generating unique intelligence
reports using the advanced SAS data warehouse platform and explore and establish
new linkages and advanced analysis for policy initiatives.
C. Brief overview of system
NHRM has undertaken reforms for HMIS which includes rationalisation of data elements,
designing of data sets for data reporting from each facility and defining of information flow.
Three sets of reporting forms [data sets] have been developed - sub centre form, PHC form
and CHC/ Hospital form. Each facility has a mandate to report their monthly data in these](https://image.slidesharecdn.com/publichealthitsystemstudy-180204120402/85/Public-health-it-system-study-35-320.jpg)
![48Indian Public Health IT Assessment - National Health Systems Resource Centre and Taurus Glocal Consulting – 2011
www.nhsrcindia.org, www.taurusglocal.com
II. NRHM- Mother and Child Tracking System
Mother and Child Tracking System [MCTS] was sponsored by MoHFW, Govt of India, and
developed by NIC between 2010-2011 for tracking pregnancies and pushing standard
protocols in order to reduce IMR and MMR.
A. Problem Statement:
Credible and timely data isn’t available for reducing IMR and MMR. By the time the data
gets aggregated and analysed, the pregnancy events/complications have already
occurred.
B. Objective of developing the Electronic System:
Objectives of developing MCTS can be divided into main and supporting objectives.
1. Main Objectives:
I. MCTS was developed for reducing the IMR and MMR.
II. Centralised system for tracking each pregnancy - Name based reporting.
III. Pushing standard protocols based work plan to the ANM and ASHA workers so that
they don’t miss any step in the protocol.
IV. Mother and child gets service in time.
2. Supporting objectives:
I. Analysed data is available for administrative and resource planning purposes
II. Plan and roll-out trainings and skill upgrades as per region based in service levels
C. Brief overview of system
Pre-MCTS the data was reported manually from the field and compiled at various levels
before reaching to the directorate. Some states had their own reporting variations and some
states even had their own software (e.g. eMamata from Gujarat). Therefore the Directorate
felt the need to computerise the system and rationalise the information collected in different
states.
eMamata from Gujarat was taken as a base and technically migrated from .Net 2005 to .Net
2008. In the process, new features were added and the architecture was improved. Extreme
agile methodology was followed to develop the system.
Data is collected in standardised forms from the field. The forms are compiled and data is
sent to the next level on fortnightly basis. Lowest unit of data collection is sub-centre.](https://image.slidesharecdn.com/publichealthitsystemstudy-180204120402/85/Public-health-it-system-study-49-320.jpg)
![52Indian Public Health IT Assessment - National Health Systems Resource Centre and Taurus Glocal Consulting – 2011
www.nhsrcindia.org, www.taurusglocal.com
non-zero
IV Data Confirmation R There is no data confirmation functionality in the
application. User only has option of saving the data by
clicking on “Save details" button. Other than that there is
no functionality to confirm data.
V Data Modification G Data modification can be done anytime with an exception
that some of the encounter dates can not be changed
during subsequent data entry. E.g. LMP date, First ANC
visit date cannot be changed during ANC second or ANC
third visit data entry.
4. Data load on system
I Form elements
a Indicator to data
element ratio
R There are no program management specific indicators
calculated from the application. Only one indicator
“percentage of pregnancy registration” is being
calculated for estimating registration completeness. No
other program specific indicators are generated from the
application.
b
Number of forms to
be filled from each
facility or the Case
load per data entry
unit
R The number of forms to be filled in a patient based
system is significantly larger than facility based
reporting. In patient based reporting the load of data
entry is equal to the patient load under the facility
multiplied by the number of forms per patient.
In this case the only measure of patient load per Block is
birth rate [22.22 births/1000 population] divided by the
total number of Blocks [6000 Blocks] multiplied by the
number of encounters per case.
There are two programs and each program has certain
encounters. Each encounter can be considered as one
form.
Pregnancy tracking- 5 encounter (including registration)
Child tracking- 8 encounter (including registration)
Obviously the system requires a higher number of
human resources to take this data entry load on a slow
network connection.
c
Form design Y Form is simple and is not lengthy but has many
dropdowns. Pages with lot of Dropdowns tend to be
slow to load on slow speed networks.
II Data archiving
a within the database Y Data can be archived within the database but by
developers only. Administrators/ Super Users should also
have limited rights to archive their old data.
b in a separate
database
Y Data can be archived in a separate database by
developers only. However it seems that complete
archiving has not been institutionalized yet.
III
Case load per data
entry unit
R The number of forms to be filled in a patient based
system is significantly larger than facility based reporting.
In patient based reporting the load of data entry is equal
to the patient load under the facility multiplied by the
number of forms per patient.
IV
System response
time
G Takes average 10 sec per page @1.18 mbps speed.
5. Unique identifier](https://image.slidesharecdn.com/publichealthitsystemstudy-180204120402/85/Public-health-it-system-study-53-320.jpg)
![59Indian Public Health IT Assessment - National Health Systems Resource Centre and Taurus Glocal Consulting – 2011
www.nhsrcindia.org, www.taurusglocal.com
4. Monolithic design – The system is following a monolithic design where it is
becoming a sort of EMR for the patient based reporting. In some ways the design is
a parallel to the centralised model that has failed in NHS UK. Ideally the public health
system should be decentralised where the patient based reporting should be left to
the EMR and the public health system gets a consolidated view of the granularity in
the EMR. In the absence of an EMR, there is an attempt by MCTS to fill the gap all
the way down to the patient level. Seems to be too early in the game. The first step
should be to get the field staff into the habit of reporting consolidated figures in the
electronic system. The EMR can be introduced to capture the patient based details at
a later stage – Look at the recommendations section below.
5. System is in flux - The requirements of the system were never frozen and are
constantly changing. It is very disturbing for the end user when confronted with
partly developed/changing functionality and unhandled error messages. This
becomes a huge adoption issue with lower education levels of end users. There is no
evidence of product life cycle management, configuration management and release
management. There is no traceability of any requirements document, design
documents, test plans and test reports. No evidence of version control for each
release. The system has turned into an application that is constantly in flux.
Technically this is a dangerous situation because it renders the system unviable for
the long-term use. A detailed technical evaluation was out of the scope of this study;
however it is recommended to technically audit MCTS as per SDLC, PLM, ITIL and
CMMI standards.
6. Ad Hoc reports - The flexibility to produce your own reports is lacking in the
system. Lots of ad hoc reports are required which couldn’t be thought of at the time
of software system design. NIC spends a lot of time producing these ad hoc reports.
Rather an online analytical processing [OLAP] functionality would have gone a long
way to enable the users to produce their own reports.
7. Master Data for facilities – Different states follow different nomenclature and
classifications of administrative levels e.g. Block, Taluka, CHC etc. Therefore freezing
the master data about different facilities has been a challenge for the system design.
8. Master Data for providers and staff – Uniquely identifying each ANM, ASHA
worker and mapping her mobile number has been a challenge. Therefore there is
difficulty in rolling out the security features such as role-based-access control. Similar
problems are encountered for personalised work plans thru mobile platforms.](https://image.slidesharecdn.com/publichealthitsystemstudy-180204120402/85/Public-health-it-system-study-60-320.jpg)
![62Indian Public Health IT Assessment - National Health Systems Resource Centre and Taurus Glocal Consulting – 2011
www.nhsrcindia.org, www.taurusglocal.com
III. District Health Information Software (DHIS)
District Health Information Software (DHIS) is a public health system from The University of
Oslo’s Society for Health Information Systems Programme [HISP] implemented in India. It
was developed to help strengthen Health Management Information Systems [HMIS] under
National Rural Health Mission (NRHM). It was believed that DHIS will be able to help NRHM
focus on decentralised planning and District health management.
A. Problem Statement: Prior to NRHM, health systems were struggling with timeliness
and poor quality of data reaching up to the decision makers. Some disease programs did
computerisation but resulted in silos of their reporting systems. These fragmented
information systems were too focused on their specific program and were of no help to
address the challenges of District health management.
B. Objective of developing the Electronic System: Objective was “To design and
develop a web-based, free and open-source system for data collection, validation,
analysis, and presentation of aggregate statistical data. This system should allow
distributed data collection and distributed dissemination of data, meeting the
requirements of a health management information system.” Objectives of developing
DHIS can be divided into the following.
1. Main objectives:
I. Should enable local level data analysis and use of information.
II. Should improve information culture and evidence based decision making.
III. Local level program managers must be able to identify problems and take corrective
actions.
2. Supporting objectives:
I. Development of highly flexible system for reporting aggregate facility data.
II. System should be based on open source platforms.
III. System should be able to collect data and provide analysis at each level of hierarchy.
IV. Flexibility for users to customise forms, data elements, indicators and reports.
V. Ability to fit any public health program in any geography.
VI. Ability to be integrated with other reporting systems.
VII. Provide data validation and data quality check.
VIII. Provide dashboards for decision makers.](https://image.slidesharecdn.com/publichealthitsystemstudy-180204120402/85/Public-health-it-system-study-63-320.jpg)
![71Indian Public Health IT Assessment - National Health Systems Resource Centre and Taurus Glocal Consulting – 2011
www.nhsrcindia.org, www.taurusglocal.com
4 Flexibility for users to
customise forms, data
elements, indicators and
reports.
DHIS provides full flexibility for users to customise forms,
data elements, indicators and reports.
5 Ability to fit any public
health program in any
geography.
DHIS has the ability to be implemented for any public
health program.
6 Ability to be integrated with
other reporting systems.
DHIS can be integrated with other systems via a
standard. However it lacks HL7 support.
7 Provide data validation and
data quality check.
DHIS provides function to define rules for data validation
and data quality check.
8 Provide dashboards for
decision makers.
DHIS provides a dashboard function for advanced level
users. However the usage of the system at local levels
hasn’t reached the desired levels due to lack of effective
capacity building by the states and change management
measures.
Discussions:
1. Flexibility to adapt to other programs- DHIS is a very flexible system. It has the
ability to be implemented for any public health program. The user can do primary level
of customisation such as defining their own data elements and indicators. A skilled user
(developer) can do further customisation of designing data entry Forms and defining
report formats.
2. Low Adoption - The existing paradigm gives high [75-90%] attention to hardware and
software and low [10-25%] attention to capacity building. This is lopsided because
change management in Public Health requires considerable time and efforts. The system
was started in 2008 and 20-22 States adopted the DHIS for deployment. With time its
usage dwindled. Currently only 12 states are using DHIS for their HMIS data reporting.
Some of the issues related to its low adoption are given below-
a. Ownership of system- Some States have taken the ownership of DHIS application and
are doing ok. Whereas many others have not adopted DHIS as their own application and
are looking towards NHSRC for providing external support.
b. Duplication and confusion- After the arrival of NRHM web portal and MCTS,
duplication of the systems and processes has created confusion in the minds of the users.
Lack of clear direction has led many States to stop using DHIS. Many of them have not
even switched completely to web portal/MCTS. The valuable data has therefore become a
casualty. This is a death knell for change management from paper based system to the
electronic system. If the confusion prevails for too long the users will become weary of
the situation and dump electronic systems all together.
c. Lack of local DHIS experts - States lack DHIS experts for hand holding the users. The
flexibility of the system will remain unused if the local user does not graduate from basic](https://image.slidesharecdn.com/publichealthitsystemstudy-180204120402/85/Public-health-it-system-study-72-320.jpg)
![74Indian Public Health IT Assessment - National Health Systems Resource Centre and Taurus Glocal Consulting – 2011
www.nhsrcindia.org, www.taurusglocal.com
National Program IT Systems
I. National Anti Malaria Management Information System
(NAMMIS)
National Anti Malaria Management Information System [NAMMIS] was sponsored by
National Anti Malaria Programme (NAMP), now renamed as National Vector Borne Disease
Control Programme (NVBDCP), and developed by TCS between 2002-2003 for reporting
malaria incidence and timely intervention.
A. Problem Statement:
Early detection, prompt treatment and effective vector control has been an issue in the
manual system. Evidence based Logistic planning has been a distant dream due to lack of
timely access and analysis of the data in manual systems. Manual systems haven’t been
effective for staff training, effective feedback, monitoring and evaluation.
B. Objective of developing the Electronic System:
National Malaria Control Program has been developed with a focus on Early case Detection
and Prompt Treatment (EDPT) and Vector Control (VCT). It was expected that
computerisation should also help in Logistics Planning (LPL) in addition to the some
information on expenditure, entomology, IEC and training. Objectives of developing NAMMIS
can be divided into main and supporting objectives.
1. Main Objectives:
I. Early case Detection and Prompt Treatment - Information for timely intervention
wasn’t available from manual system. It gave the relevant information with a delay
of 2.5 months.
II. Local analysis and use of information -Analysis of data at the District, Block and PHC
level was required so that they could get actionable information at the local level
itself.
III. Data Sharing - Sharing of data between States was required because diseases don’t
know state boundaries.
IV. Real time data need- Real time alerts of Malaria Falciparum are required for
prevention of spread. Traditionally alerts were sent via telegram.
V. Vector Control (spraying activities) – Optimise spraying as per disease spikes.
VI. Urban Malaria Scheme (UMS) - Optimise intervention as per disease spikes.
2. Supporting objectives:
I. Logistics Planning - stock entry and planning of requirement for insecticides, anti-
malarials and larvicides.
II. Sentinel Hospitals - capture of patient-wise details from certain hospitals for research
and analysis.
III. Information, Education and Communication (IEC) regarding the disease
IV. Training - detail of training activities
V. Key elements related to expenditure and staffing
VI. Malaria health map
VII. Entomology - capture of vector density and vector susceptibility](https://image.slidesharecdn.com/publichealthitsystemstudy-180204120402/85/Public-health-it-system-study-75-320.jpg)
![84Indian Public Health IT Assessment - National Health Systems Resource Centre and Taurus Glocal Consulting – 2011
www.nhsrcindia.org, www.taurusglocal.com
VII. Information overload is another contributory cause of fatigue and loss of interest.
Out of 24 mandatory fields in every module, only 2-3 fields are really required for
taking action and rest can be optional for additional information.
VIII. Application also had offline feature, its usage remained minimal because no support
was provided to the users for offline data entry.
IX. Slow system response- Forms have to load a lot of options from the database, thus
slowing down the system. It takes a long time for the user to do data entry. Slow
system response is one of the reasons for low adoption.
3. Local level data analysis & use of information –
I. Just as in the paper based system analytics was not provided at every level.
Only the higher levels [Centre, State & in some cases District] had the
analysis capability and the facilities in the lower hierarchy would be informed
on need to know basis. Therefore there was no motivation in the lower
hierarchy to enter data in electronic systems. There was nothing in it for
them.
II. Online analytical processing – The system has fixed predefined report
formats. The flexibility to produce your own reports is lacking in the system.
Lots of ad hoc reports are required which couldn’t be thought of at the time
of software system design.
4. Integration with other systems - The focus on NAMMIS was significantly reduced
because the central agencies and states were asked to migrate to the new National Web
Portal. The need for integration with the web portal was felt and discussed but was not
implemented due to technical and administrative structural rigidities.
F. Recommendations
Get the data into the electronic system. We can’t leave the data out. Add a new system to
plug the gap.
1. Upgrade - It is very important to get the data into the electronic system. Can’t leave
out the Districts that are no longer reporting the data in electronic system. The
whole concept of going electronic will collapse because partial data is meaningless in
the long-run. The existing NAMMIS system is archaic and has lived beyond its life –
in terms of function and technology [built in .Net 2003]. Extremely poor adoption is
evidence enough that the system has been rejected by the users. The Directorate
obviously needs to upgrade to a better system [NAMMIS+].
2. Procurement process for NAMMIS+ - NAMMIS+ should follow a well-defined
procurement process starting from a workshop to write the detailed requirements.
To make sure the system delivers as per the requirements - proper documentation of
functional design, technical design, rigorous testing and long-term support services is
required.
3. NAMMIS+ should be a fully configurable and user friendly system. New system
should be built based on the technical & operational learning from current system.
Some of the issues which should be included in new system are discussed below-](https://image.slidesharecdn.com/publichealthitsystemstudy-180204120402/85/Public-health-it-system-study-85-320.jpg)
![85Indian Public Health IT Assessment - National Health Systems Resource Centre and Taurus Glocal Consulting – 2011
www.nhsrcindia.org, www.taurusglocal.com
i. Inputs – System should be flexible to take inputs in various ways - Consolidated
numbers from District/Block; or Facility-wise; or Patient-based. Based on readiness of
the States/Districts, the system should provide flexibility to define reporting periodicity
and levels of reporting. Its ok to allow 1 state to enter consolidated numbers from
District/Block; another state to do Facility-wise; and third state to accept Patient-
based reports from the local HIS/EMR. The ASHA/ANM in another state should be
able to enter data using mobile phones and interactive voice response [IVR]. The
system should be flexible to convert all these inputs into consolidated data and
indicators for public health management decision making.
ii. Analysis at all levels –Analytics capability should be provided at every facility so that
they need not wait for actionable information of their own area. The local facility
should be responsible for the health of their area rather than look upwards to the
State and Centre. This is a great tool for change management as it motivates the staff
to adopt the electronic system.
iii. Dedicated dashboard for data analysis with all OLAP functions- System should have
OLAP functions for data analysis such as drill-down, slicing-dicing and consolidation
features, roll-up, pivot. Dashboard should provide flexibility for the users to design
their own reports for personalised data analysis.
iv. Clear policy of Data archiving & data back-up- Any system may get overloaded after
some time if all data is stored in the system. There should be clear data archiving and
data back-up policy defined for better system load management. No data archiving
facility is currently available in NAMMIS.
v. System should support data privacy and have inbuilt data security features.
vi. Integration and interoperability standards- System should follow interoperability
standards for data transfer.
vii. Disease & procedure codes- System should support disease and procedure codes for
uniformity across all systems.
viii. Software & Hardware support- Current system adoption was low due to the lack of
hardware support. Software life cycle management principle should be followed for
better updates.
4. Integration with other systems - HL7 or XML based integration should be
explored between old NAMMIS and the proposed NAMMIS+ system, to ensure that
the data is not lost.
5. Change Management - Although the system seems to have been designed as per
specifications given by the users, it suffers from adoption issues because of
ineffective change management from paper based system to electronic system.
History of Healthcare-IT systems clearly indicates that one can’t achieve adoption by
forcing the workers to do anything. The only successful model to improve adoption is
a democratic way which is inclusive and not the autocratic way. Therefore there
needs to be greater and sustained focus on capacity building and change
management. Constant interventions are required to change the human behaviour.
Current challenges stem from adoption issues related to training and hand-holding.
Initial class room training should be followed by virtual Audio-Visual trainings and
then computer based trainings and FAQs to help the user learn at will. Centralised
call centre goes a long way in logging the problems of the users and provide help](https://image.slidesharecdn.com/publichealthitsystemstudy-180204120402/85/Public-health-it-system-study-86-320.jpg)
![91Indian Public Health IT Assessment - National Health Systems Resource Centre and Taurus Glocal Consulting – 2011
www.nhsrcindia.org, www.taurusglocal.com
b
Number of forms to be
filled from each facility
G On weekly basis one S-Form has to be filled from
every sub-center. Other facilities need to fill one P-
Form per week and L-Form is used by the Lab
wherever Laboratory has to report anything for any
week.
c
Form design G Form is very simple and has only text boxes to
enter numeric data.
II Data archiving R Data archiving function is not available currently.
However clustering is being planned. After that only
last 2-3 years data will be available online, rest will
be archived.
a within the database R This function is not available.
b in a separate database R This function is not available.
III
Case load per data entry
unit
Y District is the Data entry unit. Every week the
District receives S-Form data from each Sub-center
and P and L Forms from other facilities. Total form
load per data entry unit on an average is 180-200
forms/ week.
IV
System response time G 3-5 seconds response time in login or opening any
screen. It takes 30-45 seconds to generate a report
at the speed of 2.2971Mbps.
5. Unique identifier
I Patient Y This function is not available in IDSP. Line listing
[Patient-based] data entry is being done without
any identifier. Difficult to identify duplicates without
identifiers. Ideally the line listing should have
Patient ID and Encounter ID.
II Provider R This function is not available. The login ID is role
specific but not provider [person] specific.
III Facility G For each facility numeric codes is used as identifier.
IV Encounter R This function is not available. Ideally the line listing
should have Patient ID and Encounter ID.
6. Report generation
I By Design
a Static – predefined G All reports are static and are available to user in
predefined format.
b Dynamic – can be
configured by user
R There is no flexibility for the user to configure their
own reports.
c Report generation by
programming/ SQL Queries
G This function is available through which IT team at
IDSP generates ad-hoc reports.
d Online Analytical
Processing (OLAP) for user
R All reports are static and are available to user in
predefined format.
i Consolidation Y Consolidation is done at block, district & state.
However monthly consolidation is not possible in
application.
ii Drill down Y System can produce predefine reports only.
Flexibility of Drill-down in reports is not available.
However limited drill-down is available for hierarchy
of facilities i.e. the user can see facility wise
breakup.](https://image.slidesharecdn.com/publichealthitsystemstudy-180204120402/85/Public-health-it-system-study-92-320.jpg)
![92Indian Public Health IT Assessment - National Health Systems Resource Centre and Taurus Glocal Consulting – 2011
www.nhsrcindia.org, www.taurusglocal.com
iii Slicing-dicing Y System can produce predefine reports only.
Flexibility of Slicing-Dicing of data is not available.
II By use
a Number based aggregated
only
G Number based aggregated report can be
generated.
b Analyzed (indicator based) R System doesn’t generate any program management
indicator based reports. Some data status reports
can be shown in % [indicator].
III
User can generate
aggregated report for his
level and level below.
Y Reports can show disaggregated data for each
facility under a block; as well as aggregated data
for all blocks under one district, and all districts
aggregated data under one state.
IV
User can generate
disaggregated report for
his level and level below.
Y Reports can show disaggregated data for each
facility under a block; as well as aggregated data
for all blocks under one district, and all districts
aggregated data under one state.
V Data Mart R This function is not available.
VI Dashboard for decision
makers
R Dashboards are not available. However some
reports can show disaggregated data, aggregated
data and graphical representation in a single
window – this is too much data and too little
actionable information for any decision maker.
a Showing values only
i Numbers and tables G This function is available. Reports can show
disaggregated data and aggregated data in a
tabular form.
ii Indicators R System does not show any program management
indicators.
b Graphical – Charts G This function is available. Some reports can show
disaggregated data, aggregated data and graphical
representation in a single window.
VII
GIS-Map based data
analysis
R This function is not available.
7. System Flexibility (to define your own)
I Data fields R This function is not available. The system doesn’t
allow any flexibility.
II Indicators R This function is not available. The system doesn’t
allow any flexibility.
III Forms R This function is not available. The system doesn’t
allow any flexibility.
IV Formats R This function is not available. The system doesn’t
allow any flexibility.
V Reports R This function is not available. The system doesn’t
allow any flexibility.
VI Dashboard R This function is not available. The system doesn’t
allow any flexibility.
VII Rules Engine – To define
Clinical Protocol and
Disease Management
based Rules
R This function is not available. The system doesn’t
allow any flexibility.
VIII Workflow Engine – To
define user defined public
R This function is not available. The system doesn’t
allow any flexibility.](https://image.slidesharecdn.com/publichealthitsystemstudy-180204120402/85/Public-health-it-system-study-93-320.jpg)
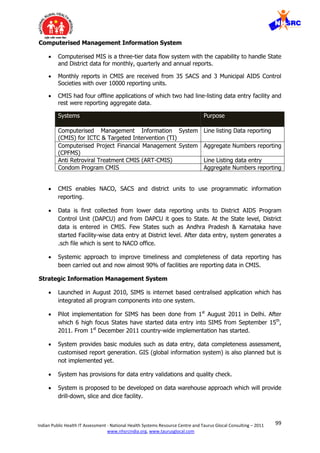
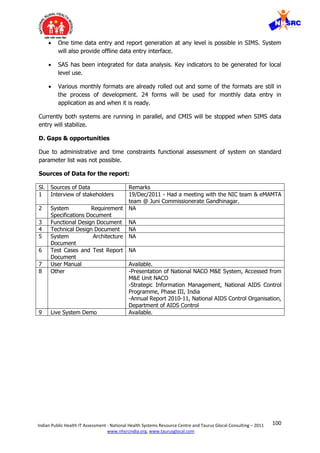
![101Indian Public Health IT Assessment - National Health Systems Resource Centre and Taurus Glocal Consulting – 2011
www.nhsrcindia.org, www.taurusglocal.com
State Public health IT Systems
I. Tamil Nadu HMIS
TN State has a rich history of ICT innovations in health care. Currently there are 15-18 data
sources from different programs. TN Healthcare Management Information System [HMIS]
and Hospital Management System [HMS] are sponsored by the State and developed by TCS.
A. Brief History of Health IT Systems:
1992 – Foxpro based public health IT system. The data entry was at district level.
1993 – Malaria tracking IT system was developed by NIC. The data entry was at
district level.
1999 – OCR based ISMR project by DANIDA for Institutional services monitoring
report. This helped build the electronic data culture in the state’s public health setup.
2002 – Pulse polio data entry system was adopted in TN.
2005 – NAMMIS and EDSIS/IDSP were rolled out in TN and was adopted well.
2007 – The electronic data culture was well established in public health. Many new
IT systems were added for monitoring the public health programs. TCS started
implementing the HMIS in 2007.
TN has developed a culture of dealing with electronic data due to a long history of
Healthcare IT systems. TN state has now established the state health data resource centre
[SHDRC] to integrate most the following data sources and build a data ware house for data
driven planning, monitoring and evaluation. DHIS is working with SHDRC to build a data
warehouse by integrate IT systems from Directorate of Medical Services [DMS], Directorate
of Public Health [DPH] and Directorate of Medical Education [DME].
SHDRC has done an initial assessment of different data sources but a detailed analysis of
data elements is planned for developing the Architecture for integrating everything. The list
of data sources is attached in the table below.
Sl. Directorate/ Dept. IT System/ Data Source
1 Directorate of
medical and rural
health services
[DMS]
120 out of 270 hospitals have started using HMS for patient based
tracking. HMS can feed the consolidated public health data to HMIS.
107 out of 270 hospitals have become CEMONC – comprehensive
emergency obstetrics and new born care hospitals. Adoption of HMS
and HMIS is improving because it has screens for CEMONC.
Rest of the District hospitals and sub-district hospitals report their
consolidated public health data in paper and the District enters the
data into Excel/ISMR format. Parts of this data are also uploaded
into HMIS. Wide scale adoption of HMIS hasn’t happened in DMS
due to hardware, network, capacity building, and change
management issues.
2 Directorate of public
health and
preventive medicine
[DPH]
DPH is a good user of HMIS but is suffering from paucity of human
resource, capacity building and change management issues. 75% of
PHCs are doing the Data entry online because good network
connectivity is provided at PHC level. Data cards are provided](https://image.slidesharecdn.com/publichealthitsystemstudy-180204120402/85/Public-health-it-system-study-102-320.jpg)
![102Indian Public Health IT Assessment - National Health Systems Resource Centre and Taurus Glocal Consulting – 2011
www.nhsrcindia.org, www.taurusglocal.com
wherever internet is not available.
3 Directorate of
medical education
[DME]
Piloting HMS in 2 medical colleges. Will adopt HMS based on the
readiness of the medical colleges and the outcomes of the pilot.
HMS can feed the consolidated data to HMIS.
4 TN medical services
corporation
IT system for procurements – requirements, tender, responses,
short listing, purchase etc.
5 TN state AIDS
control society
TN has its own MIS for AIDS. Will be moving to SMIS from NACO.
6 Directorate of Indian
medicine
Paper based data. Wish to convert the manuscripts to electronic
formats.
7 Directorate of family
welfare
PICME system for pregnancy and infant cohort monitoring and
evaluation. Was implemented in 2008 for tracking all RCH data.
PICME is a TN equivalent of MCTS. It is a patient based tracking
system where the system generates a UID for all mothers. The
women are given additional benefits if the woman produces her UID
card for every service.
8 State TB cell RNTCP - National system for tracking TB
9 National leprosy
eradication program
National system for tracking leprosy
10 State blindness
control society
National system for tracking Blindness
11 State health
transport corporation
Hospitals run by TN State transport department
12 Directorate of drug
controller
IT system for procurement, monitoring and control of drugs
13 National rural health
mission
DHIS2 – takes data from HMIS
14 Revised national TB
control project
RNTCP - National system for tracking TB
15 TN Dr MGR
university
Medical university has paper based research data and its own IT
systems
16 Corporation of
Chennai
Municipal Hospitals for urban health in Chennai
17 Municipal
administration
Health centres run by municipalities in other cities
18 State bureau of
health intelligence
National system
B. Brief overview of HMIS
Area wise reporting: HMIS system is area wise reporting based on the family health register.
The system was designed for HSC level reporting; later option of consolidated as well as
granular data entry was given from PHC level. The ANM/VHN identifies every pregnant
woman based on family health register. The ANM/VHN tracks the pregnant woman even if
she migrates or gets the services done in another facility and reports the services from her
area. Area wise reporting helps in taking care of the entire population in the area. However
this has a flip side - this method makes it difficult to track facility wise utilisation and
productivity.](https://image.slidesharecdn.com/publichealthitsystemstudy-180204120402/85/Public-health-it-system-study-103-320.jpg)
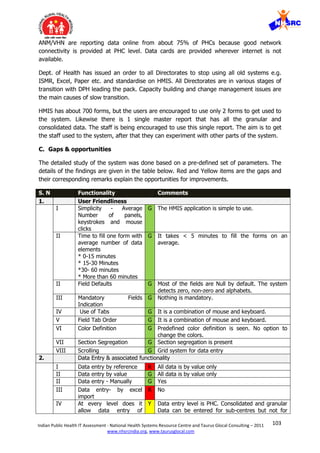
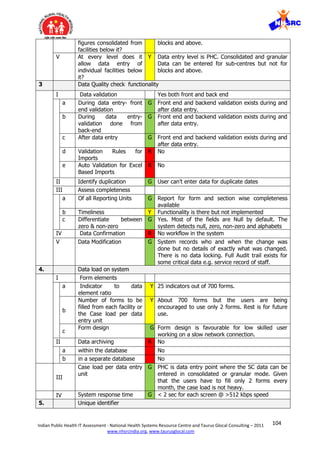
![108Indian Public Health IT Assessment - National Health Systems Resource Centre and Taurus Glocal Consulting – 2011
www.nhsrcindia.org, www.taurusglocal.com
Cycle Management management. However this has been developed as
an application for single use, not like a product. It
is not modular and configurable like a product that
is ready for implementations in different public
health programs.
XI Hardware upgrades
being done?
G TNHSP, 3 yrs AMC
XII Infrastructure for
scalability – e.g. SAN,
Data Centre, Web Farm
G Lcot datacentre
XIII Capex or Opex financing
model?
G Capex
D. Did the system achieve the objective?
After HMIS implementation RCH monitoring in TN state has become data driven and
care is based on protocols. ANM/VHN are reporting data online from about 75% of PHCs.
65% of the deliveries are done in Govt facilities now. This is an indication of people
getting a reasonable service.
Discussion:
1. Reporting time delay – TN HMIS has reduced time for reporting data from field.
Reports are available to the staff and officials soon after the data gets converted from
paper to electronic format from the PHC level.
2. Federated design – HMIS is for reporting consolidated SC data from PHC level. The
HMS is the patient based reporting from hospitals and point of care. The consolidated
numbers from HMS can be uploaded to HMIS. This is a good design to delink public
health data from patient-based tracking.
3. Mismatch between HR capacity and reporting needs - The human resource was
designed for paper based system where the data from SC, PHC, and Block was
aggregated at the District level and all aggregated reporting to the state and centre was
done by the District. Whereas TN HMIS system is designed for reporting directly from
PHC. The resources at PHC level were assigned with an additional task of entering the
data received from Sub-centres. Data entry is an additional burden on the PHC
resources.
4. Local analysis and use of information– The users have predefined report formats
only. Local level users are not provided with options to analyse their own data for
decision making. The flexibility to produce your own reports is lacking in the system. An
online analytical processing [OLAP] functionality would have gone a long way to enable
the users to produce their own reports.
5. Integration with other systems – TN HMIS uses web services [XML] to integrate
with DHIS2. The data from HMIS is uploaded to DHIS2 for data warehousing and data
analysis.
6. Private sector and urban areas data - Currently data is not reported from urban
area and from private providers. Private providers are not comfortable with sharing data.
We all know that diseases don’t know boundaries and narrow domestic walls. Therefore
the big picture of epidemiology is still a distant dream.](https://image.slidesharecdn.com/publichealthitsystemstudy-180204120402/85/Public-health-it-system-study-109-320.jpg)
![109Indian Public Health IT Assessment - National Health Systems Resource Centre and Taurus Glocal Consulting – 2011
www.nhsrcindia.org, www.taurusglocal.com
I. Recommendations
Capacity building required for improving adoption of the existing systems. Integrate data
sources to build a health information exchange.
1. Mismatch between human resource and data entry load – It is recommended to
add dedicated staff at PHC level for data entry. Current adoption suffers from mismatch
between human resource and data entry load.
2. Change Management - History of Healthcare-IT systems clearly indicates that one
can’t achieve adoption by forcing the workers to do anything. The only successful model
to improve adoption is a democratic way which is inclusive and not the autocratic way.
Therefore there needs to be greater and sustained focus on capacity building and
change management. Constant interventions are required to change the human
behaviour. The resistance to change is a problem that needs to be removed step-by-step
over time. Sudden change makes the frog jump out of the hot water.
3. Integration and Data Analysis – TN is well positioned to build a state level health
information exchange [HIE]. The SHDRC move to integrate various data sources for data
warehouse and data analysis is the right direction.
Sources of Data for the report:
Sl. Sources of Data Remarks
1 Interview of stakeholders 14/Dec/2011 - Had a meeting with the
TNHSP, DPH, DME, DMS and TCS teams in
Chennai.
2 System Requirement Specifications
Document
NA
3 Functional Design Document NA
4 Technical Design Document NA
5 System Architecture Document NA
6 Test Cases and Test Report Document NA
7 User Manual NA
8 Other NA
9 Live System Demo Available.](https://image.slidesharecdn.com/publichealthitsystemstudy-180204120402/85/Public-health-it-system-study-110-320.jpg)
![111Indian Public Health IT Assessment - National Health Systems Resource Centre and Taurus Glocal Consulting – 2011
www.nhsrcindia.org, www.taurusglocal.com
C. Brief overview of the Gujarat public health IT system
Gujarat has developed a culture of dealing with electronic data due to a long history of
Healthcare IT systems. Gujarat state has now decided to integrate most the following data
sources to build the big picture for better planning, monitoring and evaluation.
ACCOUNTABILITY TRANSPARENCY RESPONSIVENESS DECISION MAKING
Dept website,
Hospitals website,
Medical college
website
Intra-FDCA
application [Food
and Drug Control
Admin]
GPS mobile van
monitoring system
eMamta, HMIS
Customized Tally –
ERP for NRHM funds
Medical education
admission
committee
GVK – EMRI 108
[Emergency
Management and
Research Institute]
GHMIS [Gujarat
Hospital Management
Information System]
School health
program
DLIMS [Drug
Logistics
Information
System]
IDSP [Integrated
Disease Surveillance
Project]
BADEA [Birth, Death
entry application and
reporting system]
eMamta : The idea of tracking immunisation and pregnancy services ante-natal to post-
natal and beyond has led to the conceptualisation & development of eMamta system. Similar
initiatives were taken in Rajasthan where the mother was registered in the system during
ANC registration. However Gujarat went one step ahead and included Annual District Family
Health Survey (DFHS) data in the application as baseline and linked tracking of each
pregnant mother with their family records. The system works in three phases:
I. Family Health Survey: Gujarat State was doing Annual District Family Health Survey
(DFHS) from Community Need Assessment Approach (CNAA-2000) but data was kept on
paper. This DFHS survey is done by health workers. They compile it and send it to the
respective blocks, from blocks it is compiled and sent to District and from District it
reaches the State. With the eMamta this data has become electronic and is included as
the baseline data for eMamta; DFHS survey data is now directly entered electronically at
PHC level. First time DFHS data entry was done in 2009-10 and now each it is updated
electronically after the DFHS survey in Q1 every year. In the application each family is
provided with a unique family healthcare ID, which helps capture the migration details
and prevent loss of cases due to migration. In other words eMamta is designed for Area-
wise reporting. Currently system has 4.5 crore family records against total 6 crore
families in the state.
II. Registration of pregnant mothers and children: The system generates the Health
ID primarily based on DFHS# but it also has place to record 9 other supporting IDs such
as Voter ID, Ration card#, PAN# etc. eMamta can switch to ADHAAR when it becomes
available universally. All women who get pregnant and children of age up to 6 years are
registered and are provided a unique mother/child health ID.
III. Tracking of healthcare services through monthly work plans: The services
provided to the pregnant mothers including ANC, delivery, PNC and immunization are
captured in eMamta. Data is collected in standardised paper forms from the SC and from](https://image.slidesharecdn.com/publichealthitsystemstudy-180204120402/85/Public-health-it-system-study-112-320.jpg)
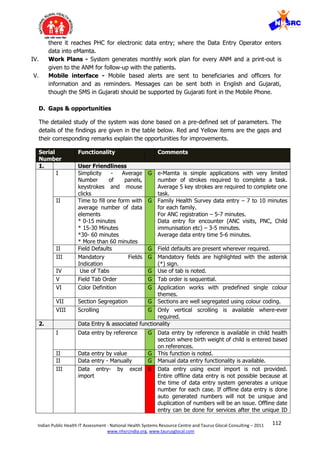
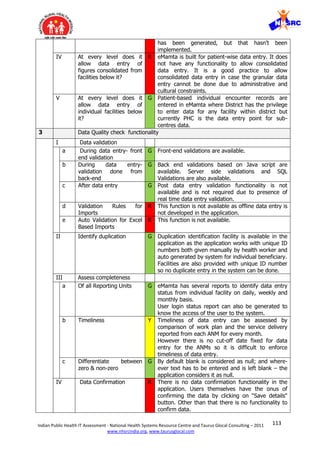
![114Indian Public Health IT Assessment - National Health Systems Resource Centre and Taurus Glocal Consulting – 2011
www.nhsrcindia.org, www.taurusglocal.com
V Data Modification G Data modification can be done before some specific
milestone events have occurred, after that some of
the encounter data can not be changed. E.g. Data
can be changed for services rendered before
delivery, but the system doesn’t allow any change
after the delivery data is entered. You require
administrative privileges to change data after the
milestone.
4. Data load on system
I Form elements
a Indicator to data
element ratio
Y 8 indicators and 126 data elements.
b
Number of forms to be
filled from each facility or
the Case load per data
entry unit
R The number of forms to be filled in a patient based
system is significantly larger than facility based
reporting. In patient based reporting the load of
data entry is equal to the patient load under the
facility multiplied by the number of forms per
patient.
In this case the only measure of patient load per
Block is birth rate [22.22 births/1000 population]
divided by the total number of PHCs multiplied by
the number of encounters per case.
In eMamta data entry starts with the updation of
records in family health survey. After this there are
two programs and each program has certain
encounters. Each encounter can be considered as
one form.
- Pregnancy tracking- 5 encounter (including
registration)
- Child tracking- 8 encounter (including
registration)
Obviously the system requires a higher number of
human resources to take this data entry load.
c
Form design Y Form is simple and is not lengthy but has many
dropdowns. Pages with lot of Dropdowns tend to
be slow to load on slow speed networks.
II Data archiving R Data archiving function is not available in the
application. However system has 4.5 Crore family
records as baseline data-base.
a within the database R This function is not available.
b in a separate database R This function is not available.
III
Case load per data entry
unit
R The number of forms to be filled in a patient based
system is significantly larger than facility based
reporting. In patient based reporting the load of
data entry is equal to the patient load under the
facility multiplied by the number of forms per
patient.
IV
System response time G < 2 sec per page @ speeds > 512 kbps. The
system response time is not a problem because
there is a dedicated ICT cell in the Dept of Health
which takes care of hardware and network
procurement and maintenance. Also there is a](https://image.slidesharecdn.com/publichealthitsystemstudy-180204120402/85/Public-health-it-system-study-115-320.jpg)
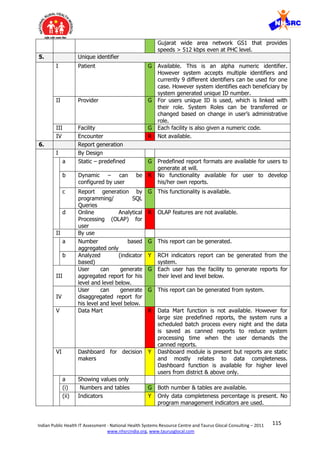
![116Indian Public Health IT Assessment - National Health Systems Resource Centre and Taurus Glocal Consulting – 2011
www.nhsrcindia.org, www.taurusglocal.com
b Graphical – Charts Y Few charts are used to show data completeness.
VII
GIS-Map based data
analysis
R This functionality is not available.
7. System Flexibility (to define your own)
I Data fields R User cannot define their own data fields
II Indicators R User cannot define their own indicators
III Forms R User cannot define their own forms
IV Formats R User cannot define their own formats
V Reports R User cannot define their own reports
VI Dashboard R User cannot define their own dashboard
VII Rules Engine – To define
Clinical Protocol and
Disease Management
based Rules
R User cannot define their own rules.
VIII Workflow Engine – To
define user defined
public healthcare
program specific
workflow
R User cannot define their workflow. (user has to
follow the predefined hierarchy)
8. Standards
I Data Definitions –
a Vocabulary Standards
(i) For local - G Vocabulary used as per standard MCH tracking
format from NRHM
(ii) For global – eg SNOMED, R Not defined in any documentation.
b Size R Not defined in any documentation.
c Type R Not defined in any documentation.
II Disease & Diagnosis code
sets – Local codes, ICD
9, ICD 10
R Not defined in any documentation.
III Procedure & Service
Code sets – eg Local
codes, CPT, CAP
R Not defined in any documentation.
IV Interoperability standards
for integration – eg HL7,
DICOM, SDMX.HT
Y No interoperability standards are used in eMamta.
Uses web services [XML] for integration with some
systems.
9. Data Privacy
I Role-based access G This function is available.
II Data locking Y Data locking functionality is milestone based. i.e.
data gets locked when user completes data entry
for some encounters.
III Password Protection Y Users have been assigned with ID & password and
password expires in every 180 days. Special
characters are required in password. However
Password protection is weak.
IV Field Based Access Rights R This functionality is not available.
10. Data Security
I Data Changes/ Error G System has facility to detect what changes done by](https://image.slidesharecdn.com/publichealthitsystemstudy-180204120402/85/Public-health-it-system-study-117-320.jpg)
![117Indian Public Health IT Assessment - National Health Systems Resource Centre and Taurus Glocal Consulting – 2011
www.nhsrcindia.org, www.taurusglocal.com
corrections (Audit trails) whom and when. However the system doesn’t have
the details of what was changed to enable roll-
back.
II Roll-back functionality R Roll-back functionality is not available in
application.
III Data back-up including
tiered backup
G Data back-up is taken in the NIC servers and NIC
decides periodicity of backup.
IV Encryption - PKI usage G This function is available.
V Digital Signature
Certificate Usage
R Digital signature functionality is not available.
11. System Functions
I Search G Search option is available to search individual
cases. Records can be searched by using name or
by using ID.
II Feedback G Helpdesk option exists for feedback to the
developers and designers of system.
Call centre [help desk] is developed at State Office
to help solve user queries and record their issues.
From call centre technical issues are forwarded to
IT cell and other issues are forwarded to
implementation unit in State office.
III Help Y Help files were available earlier but now removed
from the system. However sustained trainings and
help desk is very effective.
IV System flexible to adapt
to any Disease Program?
Y Programmatically same design can be used for
another program; however it is not flexible for the
administrator to apply to another program.
V Disease Specific
Educational Content
R Disease specific or RCH program specific
educational content is not available.
VI Error handling G Error handling is fair. User receives error alerts with
options and not unhandled error messages.
VII Deployment Online only
a Online G eMamta is currently functioning online and offline is
not planned.
b Offline R There is no offline function in the application.
12. Other
I Mobile user interface Y System can send registration status SMS and due
service SMS to users and beneficiaries.
The system has capability to send work plans on
the mobile of the users, but is not implemented
yet.
II Capacity building/Change
Management
Methodology after initial
implementation
Y Capacity building for use of eMamta was done by
the State with the help of NIC.
a Skill Building G Skill building is done in mostly as class room hands-
on training. Initial orientations for districts is done
at state level followed by phase-wise trainings at
regional level where five districts were called in
each training for hands-holding and support.
(i) One time training G One time trainings were provided to the districts
with subsequent phase-wise trainings.](https://image.slidesharecdn.com/publichealthitsystemstudy-180204120402/85/Public-health-it-system-study-118-320.jpg)
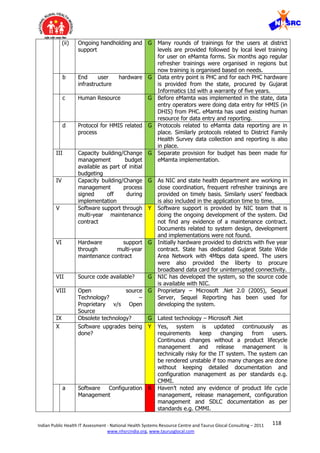
![120Indian Public Health IT Assessment - National Health Systems Resource Centre and Taurus Glocal Consulting – 2011
www.nhsrcindia.org, www.taurusglocal.com
3. Monolithic design – The system is following a monolithic design where it is becoming
a sort of EMR for the patient based reporting. In some ways the design is a parallel to
the centralised model that has failed in NHS UK. Ideally the public health system should
be decentralised where the patient based reporting should be left to the EMR and the
public health system gets a consolidated view of the granularity in the EMR. In the
absence of an EMR, there is an attempt by eMamta to fill the gap all the way down to
the patient level. Seems to be too early in the game. The first step should be to get the
field staff into the habit of reporting consolidated figures in the electronic system. The
EMR can be introduced at the point of care to capture the patient based details at a later
stage.
4. Local analysis and use of information– Local level users are not provided with
options to analyse their own data for decision making. However they have predefined
report formats. Work plans are also provided to ANMs based on standard protocols.
5. Ad Hoc reports - The flexibility to produce your own reports is lacking in the system.
Lots of ad hoc reports are required which couldn’t be thought of at the time of software
system design. NIC spends a lot of time producing these ad hoc reports. Rather an
online analytical processing [OLAP] functionality would have gone a long way to enable
the users to produce their own reports.
6. System is in flux - The requirements of the system were never frozen and are
constantly changing. It is very disturbing for the end user when confronted with partly
developed/changing functionality and unhandled error messages. This becomes a huge
adoption issue with lower education levels of end users. There is no evidence of product
life cycle management, configuration management and release management. There is
no traceability of any requirements document, design documents, test plans and test
reports. No evidence of version control for each release. The system has turned into an
application that is constantly in flux. Technically this is a dangerous situation because it
renders the system unviable for the long-term use. A detailed technical evaluation was
out of the scope of this study; however it is recommended to technically audit eMamta
as per SDLC, PLM, ITIL and CMMI standards.
7. Integration with other systems – eMamta uses web services [XML] to integrate with
MCTS. The data from eMamta is uploaded to MCTS every night as a scheduled batch
process.
8. Private sector and urban areas data - Currently data is not reported from urban
area and from private providers. DFHS is not organised in urban area therefore baseline
data is unavailable. Private providers are not comfortable with sharing data in eMamta.
We all know that diseases don’t know boundaries and narrow domestic walls. Therefore
the big picture of epidemiology is still a distant dream.
III. Recommendations
Capacity building required for improving adoption of the existing systems. Integrate data
sources to build a health information exchange.
1. Add consolidated reporting – System should allow granular reporting as well as
consolidated reporting at different levels. Based on capacity building, let the Districts
decide the granularity level from which they want to report. Therefore it is](https://image.slidesharecdn.com/publichealthitsystemstudy-180204120402/85/Public-health-it-system-study-121-320.jpg)
![121Indian Public Health IT Assessment - National Health Systems Resource Centre and Taurus Glocal Consulting – 2011
www.nhsrcindia.org, www.taurusglocal.com
recommended to add functionality in eMamta to allow consolidated reporting for
districts/ blocks/ CHCs/ PHCs. Then do a massive change management to push the
facilities that are lagging behind in adopting the reporting in electronic systems.
2. Change Management - Patient based reporting is the right thing to do but it is a huge
cultural change from the traditional paper based system that works on aggregated data.
History of Healthcare-IT systems clearly indicates that one can’t achieve adoption by
forcing the workers to do anything. The only successful model to improve adoption is a
democratic way which is inclusive and not the autocratic way. Therefore there needs to
be greater and sustained focus on capacity building and change management. Constant
interventions are required to change the human behaviour. The resistance to change is a
problem that needs to be removed step-by-step over time. Sudden change makes the
frog jump out of the hot water.
3. Fix the technical issues related to requirements, design, product life cycle
management, release management etc. Technically stabilise the system so that the long-
term viability improves and the data is secure.
4. Integration and Data Analysis – Gujarat is well positioned to build a state level
health information exchange [HIE]. The thought process to integrate various data
sources for data warehouse and data analysis is the right direction.
Sources of Data for the report:
Sl. Sources of Data Remarks
1 Interview of stakeholders 19/Dec/2011 - Had a meeting with the NIC team &
eMamta team @ Juni Commissionrate Gandhinagar.
2 System Requirement
Specifications Document
NA
3 Functional Design
Document
NA
4 Technical Design Document NA
5 System Architecture
Document
NA
6 Test Cases and Test Report
Document
NA
7 User Manual Available.
8 Other - Presentation on eMamta from
nrhm.hmmis.nic.in/.../EMamta%20Mother%20and%20C
hild%20 on 12/12/2011, 12:00 PM
- eMamta Name Based Mother & Child Tracking
Application, An e-Governance Bulletin from GUJARAT
INFORMATICS LTD Accessed from
http://www.gujaratinformatics.com/pdf/E-Mamta.pdf ,
on 12/12/2011, 3:30 PM
9 Live System Demo Available.](https://image.slidesharecdn.com/publichealthitsystemstudy-180204120402/85/Public-health-it-system-study-122-320.jpg)

![127Indian Public Health IT Assessment - National Health Systems Resource Centre and Taurus Glocal Consulting – 2011
www.nhsrcindia.org, www.taurusglocal.com
Appendix- I
List of Parameters for the Study
S. No. Functionality Comments
1. User Friendliness
I Simplicity -
Average Number
of panels,
keystrokes and
mouse clicks
A good gauge of simplicity is often the number of panels
that must be displayed and the number of mouse clicks or
keystrokes that are required to accomplish a particular
task. All of these should be minimized. The fewer things
users have to see and do in order to get their work done,
the happier and more effective they will be. This is
especially important on slow speed connection to the
server. [http://cfg.cit.cornell.edu/design/concepts.html]
II Average Time to
fill one form in
the application:
* 0-15 minutes
* 15-30 Minutes
* 30- 60 minutes
* More than 60
minutes
In a good design, all the forms should be of approximately
same length and similar data element types and should
take approximately the same amount of time to fill. It’s a
bad design to have forms of different lengths. A long form
should be split into 2 if it needs a lot of scrolling.
Long and heavy forms are slow to load on a slow speed
network connection. It is frustrating for the user to keep
waiting for a long and heavy form to load.
III Field Defaults Fields should have relevant defaults. Leaving it blank
always isn’t a good idea. Nor is it a good idea to pre-
populate things that you want the user to pay attention
and select. Field Default should help the user to fill the
form quickly but also it shouldn’t act as spoon feeding.
IV Mandatory Fields
Indication
Mandatory fields should be marked by an * or different
color or some method to attract attention. Users should
know what is optional and what must be filled.
V Use of Tabs User should be able to navigate the form with Tab key
without using a mouse.
VI Field Tab Order Tab order should follow the field order in the form. Else
the user takes much more time to navigate and search the
field.
VII Color Definition The entire application should have a uniform color
definition. Pages with different color schemes confuse the
user. No color is also ok if it is consistent across the
application.
VII
I
Section
Segregation
Sections should be properly segregated to help the user to
quickly identify the section of interest.
IX Scrolling Ideally the form design should not require any scrolling at
all. However 2 pages of vertical scroll are usually
acceptable. Horizontal scroll is a bad design because it
slows down the users work.
2. Data Entry & associated functionality
I Data entry by
reference
Data is entered based on reference number from a coding
table or external source.
II Data entry by
value
Data is entered by alphanumeric/numeric value as per the
users own will.
II Data entry - Manual data entry is the most common form of input.](https://image.slidesharecdn.com/publichealthitsystemstudy-180204120402/85/Public-health-it-system-study-128-320.jpg)
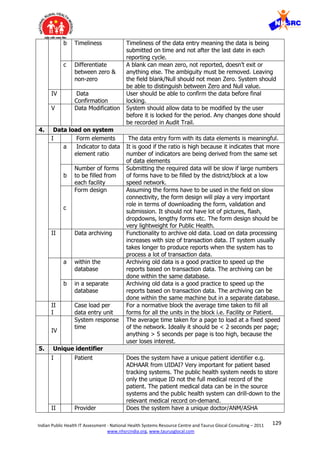
![130Indian Public Health IT Assessment - National Health Systems Resource Centre and Taurus Glocal Consulting – 2011
www.nhsrcindia.org, www.taurusglocal.com
identifier? Very important to provide role-based access and
ensure only the person who needs to see the data can see
the data [data security]. Also required for strict Audit
Trails.
II
I
Facility Does the system have a unique identifier for the facilities?
Very important for data analysis, resource planning and
plotting on the GIS.
IV Encounter Does the system have a unique identifier for the medical
record generated in every encounter/visit? The public
health system needs to store only the unique ID not the
full encounter data. The encounter data can be in the
source system and the public health system can drill-down
to the medical record of the relevant encounter/visit on-
demand.
6. Report generation
I By Design
a Static –
predefined
Predefined reports that can’t be changed by the user.
b Dynamic – can
be configured by
user
User can make changes to the report format or generate
his/her own reports.
c Report
generation by
programming/
SQL Queries
Programmer can produce the report as per user’s
requirements. User can’t do the reports on his/her own.
d Online Analytical
Processing
(OLAP) for user
The user can easily drag-and-drop and create his/her own
reports and save format for further use. User can navigate
through the database and screen for a particular subset of
the data, changing the data's orientations and defining
analytical calculations - slice, dice, drill-down, drill-up, roll-
up, pivot.
II By use
a Number based
aggregated only
Report shows only aggregated numbers.
b Analyzed
(indicator based)
Reports analyze the indicators and display the inference.
II
I
User can
generate
aggregated
report for his
level and level
below.
Users have the right to generate reports on aggregated
data for his own level and below.
IV
User can
generate
disaggregated
report for his
level and level
below.
Users have the right to generate reports on granular data
for his own level and below.
V Data Mart Data marts or data cubes built for producing specific
reports.
VI Dashboard for Customized Dashboards for key decision makers - where](https://image.slidesharecdn.com/publichealthitsystemstudy-180204120402/85/Public-health-it-system-study-131-320.jpg)
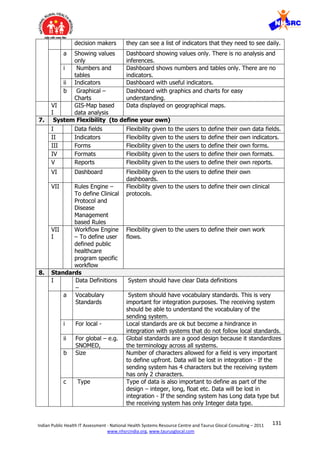
![134Indian Public Health IT Assessment - National Health Systems Resource Centre and Taurus Glocal Consulting – 2011
www.nhsrcindia.org, www.taurusglocal.com
d Protocol for
HMIS related
process
Were the paper based processes modified to suite
Electronic systems?
III Capacity
building/Change
management
budget available
as part of initial
budgeting
Budget was available for capacity building?
IV Capacity
building/Change
management
process signed
off during
implementation
Capacity building was part of the implementation project
plan or contract?
V Software support
through multi-
year
maintenance
contract
Software vendor or in-house technical team should provide
constant patches, upgrades and support.
VI Hardware
support through
multi-year
maintenance
contract
Hardware needs constant support during usage. Hardware
vendor or in-house technical team should provide constant
support. This includes server, network, datacenter, and
end user devices – desktop, laptop, tablet etc.
VII Source code
available?
Best option- The Software vendor should handover the
software source code to the Govt. so that Govt. can setup
their own technical team to manage the software after/if
the vendor exits. Else very tight long-term maintenance
contracts must be negotiated with the proprietary software
vendor.
VII
I
Open source
Technology? –
Proprietary v/s
Open Source
Open source technology gives a sense of control because
the source code of open source is available and in-house
teams can manage it in absence of a vendor.
For proprietary software - need to have a multi-year [10
yrs] maintenance contract negotiated with the Proprietary
software vendor and option to extend.
Although cost wise it is the same in the long-term. Open
source costs less initially as there is no license cost but
maintenance costs are high unless the maintenance cost is
shared across many implementations.
IX Obsolete
technology?
Technology lifecycle is about 3-5 years. Technology gets
obsolete and is ready for replacement. A good
software/hardware vendor offers constant upgrades.
X Software
upgrades being
done?
The software vendor is providing patches, upgrades and
support?
a Software
Configuration
Management
Software product versions are being managed in a
dedicated configuration management server by the vendor
or in-house team? It’s a good practice, because lot of
software working and software compatibility depends on
versions.](https://image.slidesharecdn.com/publichealthitsystemstudy-180204120402/85/Public-health-it-system-study-135-320.jpg)
![145Indian Public Health IT Assessment - National Health Systems Resource Centre and Taurus Glocal Consulting – 2011
www.nhsrcindia.org, www.taurusglocal.com
© 2005 Dr Pankaj Gupta | Slide 6 ICMIT 27 Feb 05- 01 Mar 0528 Feb 05
Learn from Others
“NHS UK has failed in building a fully
integrated centralised electronic care
records system.
NHS has spent 6.4B out of 11.4B pounds
in 9 years, but failed to meet its initial
deadline and abandoned its original
architecture”
CHI Canada has learnt from mistakes
done in UK and is successfully developing
a fully integrated de-centralised
electronic care records system
Canada has published a standards based
Healthcare-IT Architecture [blue print]
and the financing to the states is subject
to compliance with the blue print
NEHTA Australia and MoH Singapore are
learning from UK and Canada to improve
the public health informatics model
further
India can learn from these successes and
failures.
•INTEGRATED VIEW
Clinicians Integrated View
Diagnostic
Hospital
Emergency
Homecare
Emergency
Services
EHR SOLUTION (EHRS)
EHR INFOSTRUCTURE (EHRi)
EHR Viewer
Point of
Service
Application
Point of
Service
Application
Ancillary
Data &
Services
Health
Information
Data
Warehouse
EHR
Data &
Services
Registries
Data &
Services
LongitudinalRecord Services
Health Information AccessLayer
Standardized
Technical
Architecture
Standardized
Interfaces
Standardized
Data Structures
Standardized
Vocabularies,
Code Sets
Standardized
Functional
Architecture
Standardized
Registries
Source: https://www.infoway-inforoute.ca/lang-en/
© 2005 Dr Pankaj Gupta | Slide 7 ICMIT 27 Feb 05- 01 Mar 0528 Feb 05
12th Plan Commitments-
1. Setting Standards
Centre to define standards for data and
interoperability and appoint a Committee/
Authority to ensure compliance
Define Data policy – how long stored, in
what form, back ups, rights to access,
security, privacy
Committee/ Authority to develop/adopt
software product lifecycle standards such
as ISO, ISMS, CMMI, ITIL and PMBOK
Technical Architecture – standards of
interoperability, security standards,
privacy, consistent with integration and
future evolution needs
Functional Architecture – user friendliness,
processes of validation, confirmation,
error correction ( who does what, when
and where)
Financing of Health Information systems
linked to compliance to standards
Standardized
Technical
Architecture
Standardized
Interfaces
Standardized
Data Structures
Standardized
Vocabularies,
Code Sets
Standardized
Functional
Architecture
Disability
I/O Standards](https://image.slidesharecdn.com/publichealthitsystemstudy-180204120402/85/Public-health-it-system-study-146-320.jpg)

This document summarizes an assessment of public health IT systems in India. It finds that while various programs and states have developed their own IT systems, most have failed to achieve their objectives due to issues with change management of people, processes, and technology adoption. It provides recommendations to establish a National eHealth Authority to define an overall healthcare IT architecture and allow states flexibility in developing compliant systems. This would help overcome current data silos and issues of duplication across the fragmented existing systems.


