Download to read offline


![8
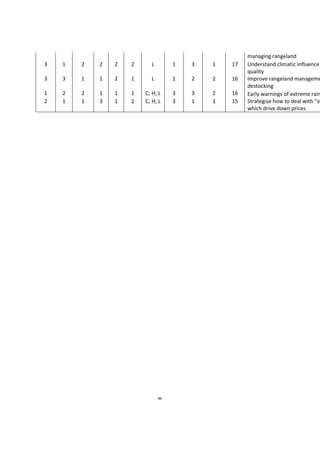
List of Figures
Figure 1: Annual mean total precipitation for each grid cell for the period 1981-2014. Data taken
from the CHIRPS dataset. Units [mm]....................................Erro! Marcador não definido.
Figure 2: Rainfall anomalies for each grid cell. Data taken from the CHIRPS dataset. Units [mm]Erro!
Marcador não definido.
Figure 3: Annual mean temperature for each grid cell for the period 1981-2014. Data taken from the
CRU TS3.23 dataset. Units [Celsius].......................................................................................24
Figure 4: Difference between decadal maximum mean temperature and maximum mean
temperatures for the entire period from 1981 to 2012 (a-c), decadal minimum mean
temperatures and minimum mean temperatures for the entire period from 1981 to 2012
(d-f). Data taken f m CRU TS3.23 dataset. Units [degree Celsius].........................................25
Figure 5: Climatological rainfall onset month (a) and cessation month (b), averaged for the period
1981 to 2014. Based on data from the CHIRPS dataset........................................................25
Figure 6: Decadal mean annual rainfall onset (a) and cessation (b) trends for the period 1981 to
2014. Based on data from the CHIRPS dataset. Units [days/decade]...................................26
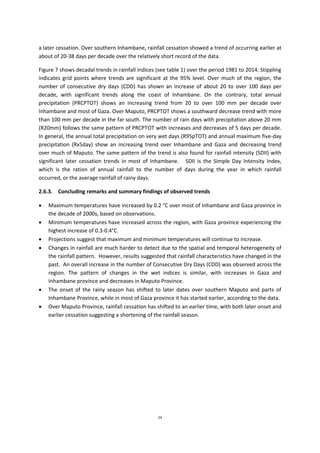
Figure 7: Decadal trends in precipitation indices (table 1) over the period 1981 to 2014. Indices
shown at the top left and units in the top right. Based on data from the CHIRPS dataset.
Stippling indicates regions where trends are significant at the 95% level............................26
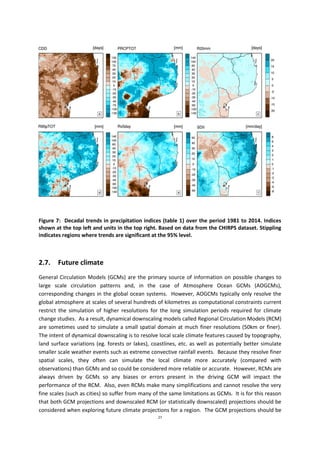
Figure 8 Projected multi-model mean changes (in %) in precipitation indices (table 1) for the period
from 2036 to 2065 under RCP8.5 emission scenario, relative to the reference period from
1976 to 2005. Stippling indicates grid points with changes that are not significant at the
95% level................................................................................................................................29
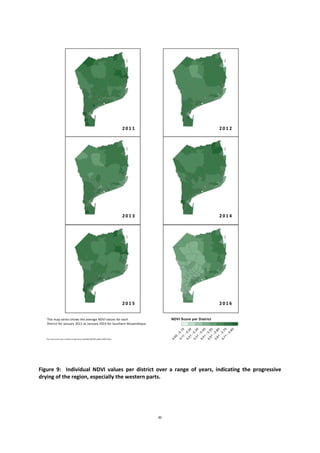
Figure 9 Individual NDVI values per district over a range of years, indicating the progressive drying of
the region, especially the western parts...............................................................................45
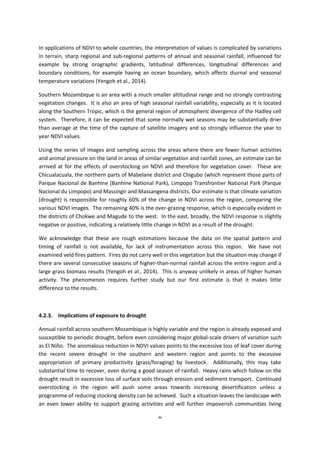
Figure 10: Within-season NDVI comparisons for the districts of southern Mozambique, indicating
how close each district was to the medium-term average for January. Redder colours
indicate the largest deficits. ..................................................................................................48
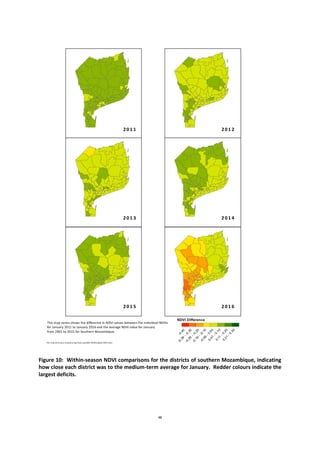
Figure 11: The NDVI anomaly for January 2016 at the height of the drought, relative to the long-
term mean for Januarys (2001-2015). The gold colours represent drought impacts on near
natural vegetation, influenced by national parks. The orange and red colours represent the
drought and human impacts on vegetation cover................................................................49
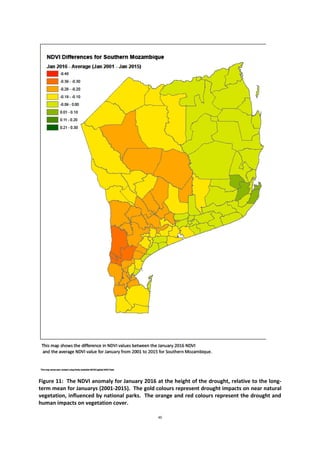
Figure 12: Flooding hazard map of southern Mozambique, based on satellite images of historically
flooded areas, in relation to districts. Source: FEWS NET (2014).........................................50
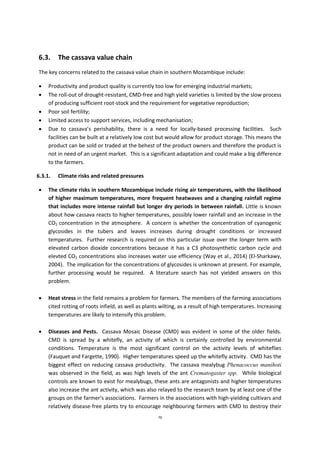
Figure 13 Priority areas (Postos) for value chain interventions - red meat and horticulture...............67
Figure 14 The First to fourth order model/schema of climate impacts (Source: (Petrie et al., 2014). 77
List of Tables
Table 1: PROSUL project provinces and districts for the value chains of red meat, horticulture and
cassava (Source: PROSUL, 2016). ..........................................................................................11](https://image.slidesharecdn.com/prosulclimatechangeadaptationthematicstudy-170321135754/85/Prosul-climate-change-adaptation-thematic-study-8-320.jpg)


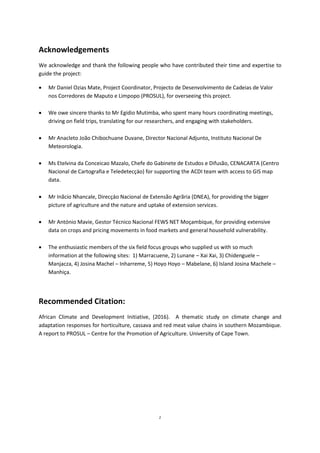
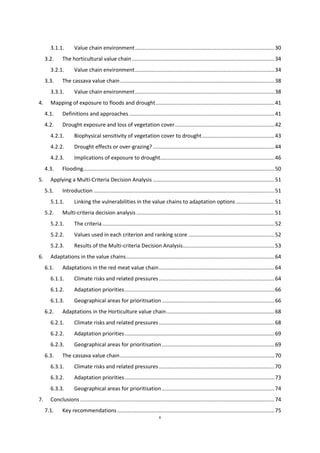
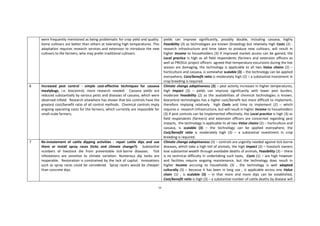
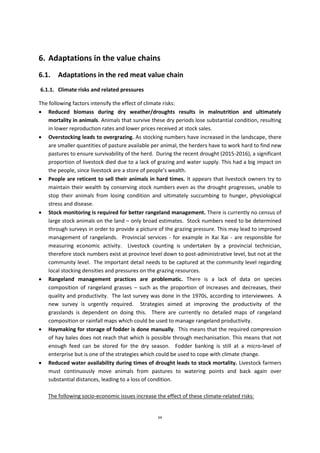
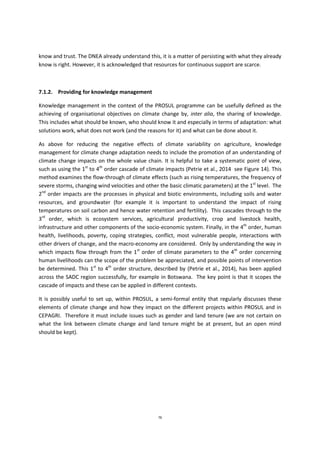
![20
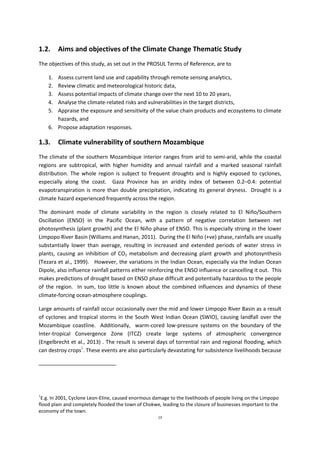
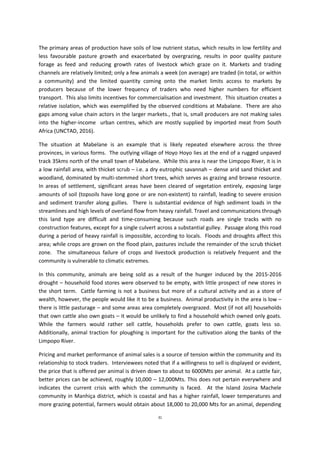
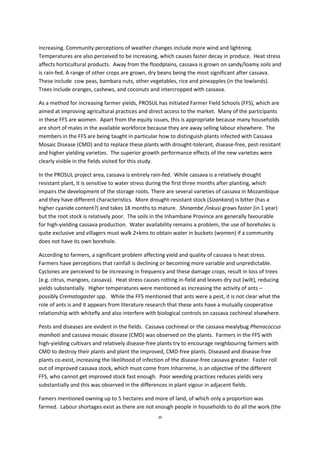
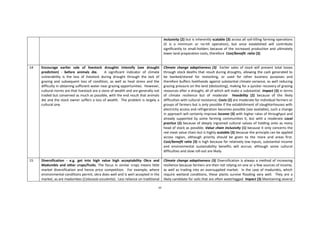
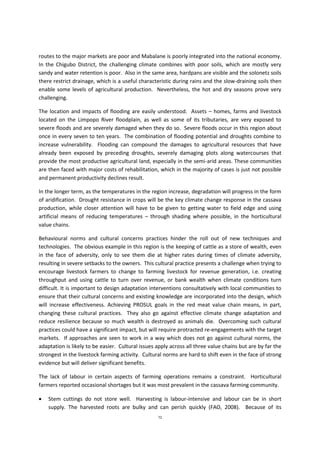
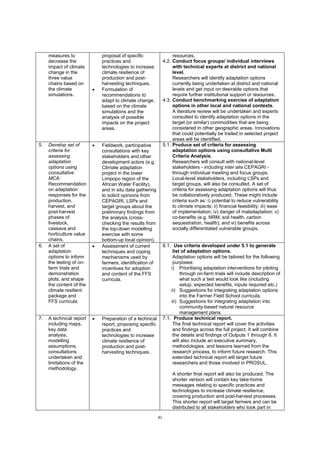
Figure 1: Annual mean total precipitation for each grid cell for the period 1981-2014. Data taken
from the CHIRPS dataset. Units [mm]](https://image.slidesharecdn.com/prosulclimatechangeadaptationthematicstudy-170321135754/85/Prosul-climate-change-adaptation-thematic-study-20-320.jpg)
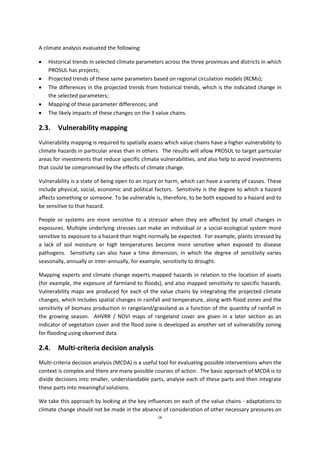
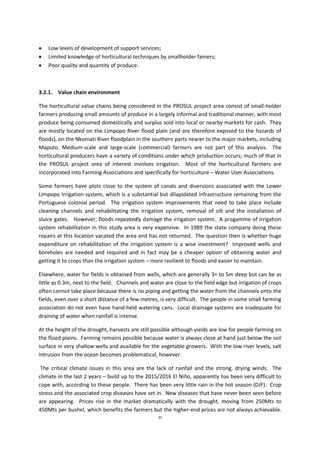
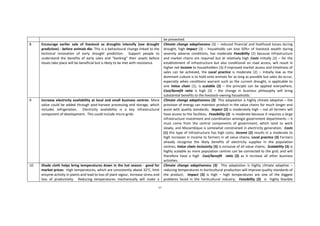
![21
Figure 2: Rainfall anomalies for each grid cell for rainfall data from 1981-2014. Data were taken
from the CHIRPS dataset. Units [mm]
This chapter provides a trend analysis of historical climate data and downscaled rainfall projections
over southern Mozambique. Projections of temperature change from the various sources discussed
(Section 2.7) do not show the range of variations of rainfall during the downscaling process,
especially as altitudinal changes across the study region are small. Temperature changes are taken as
is from the GCM ensembles. The historical trend analysis reviews the period 1981-2014, while
projections focus on the 2036-2065 period under a high level emission scenario (RCP 8.5). For the
historical analysis, we have used two observed gridded data sets, CRU TS (monthly temperature
statistics) and CHIRPS (daily rainfall) respectively. The results of this analysis of historical
temperature data show a clear warming trend. Both maximum and minimum temperatures were
warmer, on average in the decade of 2000s. An analysis of extreme climate indices suggests that
rainfall is becoming more intense, yet with longer dry-spell durations in between. There are also
indications of a later onset of the rainfall season and an earlier cessation of rain, reflecting an overall
shortening of the rainfall season. We have used dynamically downscaled data from the Coordinated
Downscaling Experiment (CORDEX) for developing the future climate projections. Under a high-
emission scenario (RCP8.5 – which is what the world is currently tracking), projections indicate that
towards mid-century (2036-2065), the number of rainfall events may increase. This is coupled with
longer dry spell periods, indicating that rainfall may become more concentrated and intense into the
future.
2.6. Recent climate trends (1981-2014)
Studies of recent historical changes in climate in Africa, including Mozambique, are hampered by the
availability of meteorological station data. Gridded products based on satellite derived precipitation
estimates or merged satellite data and station observations are an alternative, provided their
accuracy is well known. Due to these constraints in observational weather station data, rainfall and
temperature data from Climate Research Unit (CRU TS 3.21, Harris et al., 2014) and Climate Hazards
Group InfraRed Precipitation with Stations (CHIRPS, Peterson et al., 2013) are used to study the
historical changes. The CRU TS data is made up of monthly time series of various climate variables,
which include maximum and minimum temperature and rainfall. The data, which is based on over
4000 global weather stations, is available for the period 1901-2014 and is gridded to 0.5 x 0.5 degree
spatial resolution. The CHIRPS data, on the other hand, comprises daily rainfall data only. It is a
combination of satellite and weather station rainfall data and is available for the period 1981-2014,
gridded to 0.05 x 0.05 degree spatial resolution. Historical trends are calculated using linear
regression for each grid point for both CHIRPS and CRU datasets. The Mann-Kendall test was then
used to evaluate the statistical significance of trends at 95% confidence level. Statistical significance
implies that the result is unlikely to have occurred by chance. A lack of statistical significance does
not imply that changes have not occurred, but rather that they are most likely a result of
randomness rather than an underlying process.](https://image.slidesharecdn.com/prosulclimatechangeadaptationthematicstudy-170321135754/85/Prosul-climate-change-adaptation-thematic-study-21-320.jpg)
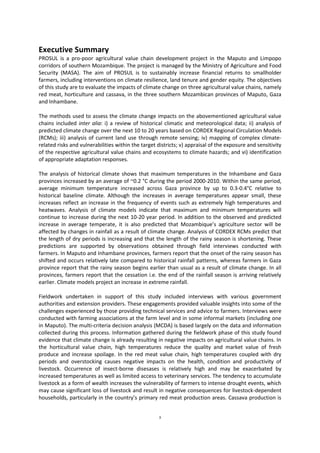
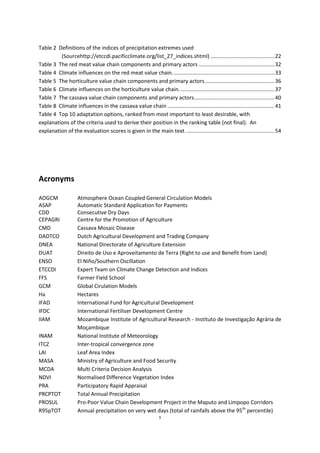
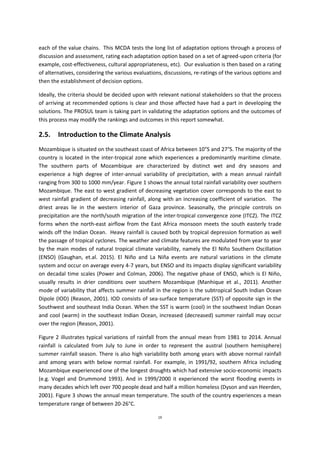
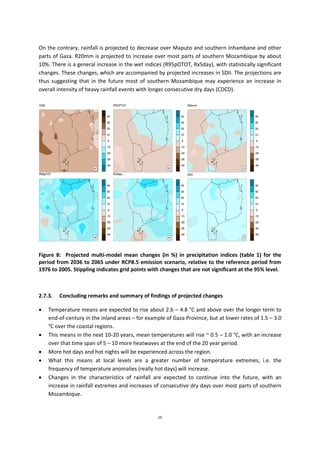
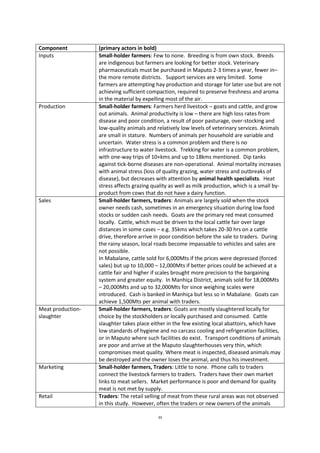
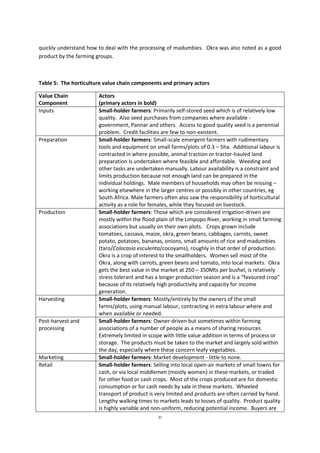
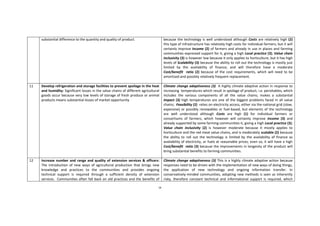
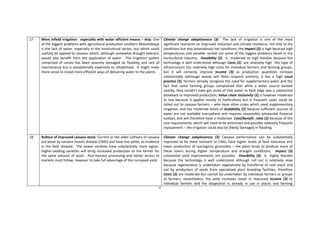
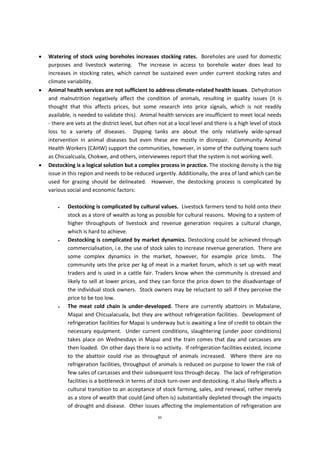
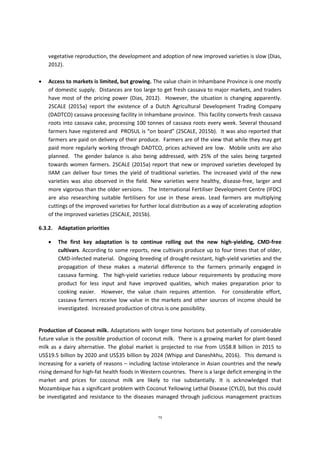
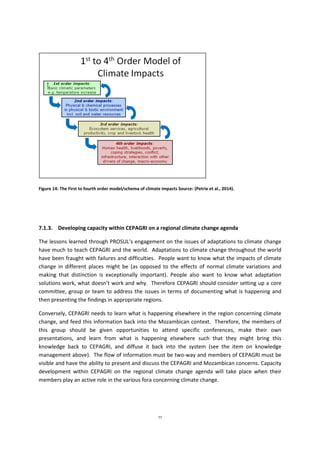
![23
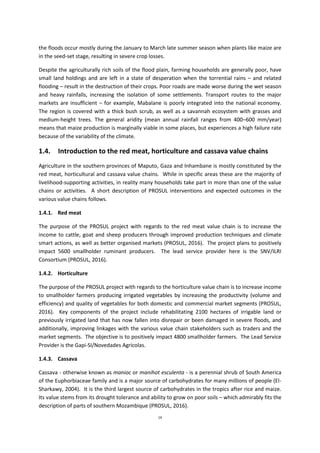
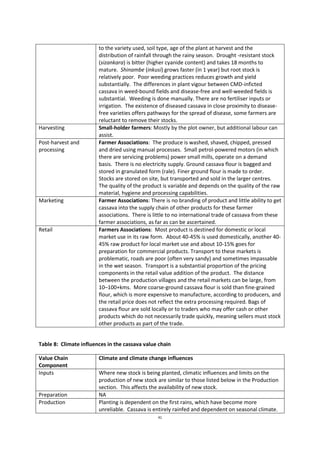
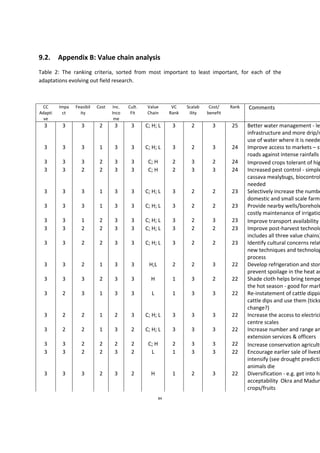
Figure 5 shows the climatological rainfall onset and cessation month for the region based on CHIRPS
dataset. Onset and cessation are defined from anomalous rainfall accumulation in a given day
[A(day)] as:
( ) ∑ ( )
Where R(n) is the daily rainfall and Rs is the long-term (1981-2014) daily mean (Liebmann et al.,
2007). The calculations used 1 July as the starting date, which is, climatologically, the driest month.
The date on which this sum [A(day), or anomalous accumulation] is a minimum is the date of onset,
while the date of the maximum sum marks the rainy season withdrawal. This method is both
objective and defined locally - that is, based on the climate of the area of interest.
Over Maputo province, rainfall starts in November while over Gaza and Inhambane it starts in the
following month of December. The cessation of rainfall over Gaza and Inhambane is in February
while over Maputo it is in February and March. For the period of 1981-2014, rainfall onset has
shown an increase in days, i.e., starting late by 5-15 days per decade over southern Maputo and
parts of Inhambane province (Figure 6) (note – the values of 5-15 days per decade is the response
only for the period of data viewed and does not imply a stable trend). In most of Gaza province
rainfall onset has shown a decrease of about 10-25 days per decade, which means that there is a
trend towards an earlier start of rainfall season. Over most of Maputo and parts of Gaza the rainfall
onset has shown a trend toward an earlier cessation of about 10-25 days, which means that the
rainfall season is getting shorter. In other regions of southern Mozambique, there is a trend towards](https://image.slidesharecdn.com/prosulclimatechangeadaptationthematicstudy-170321135754/85/Prosul-climate-change-adaptation-thematic-study-23-320.jpg)
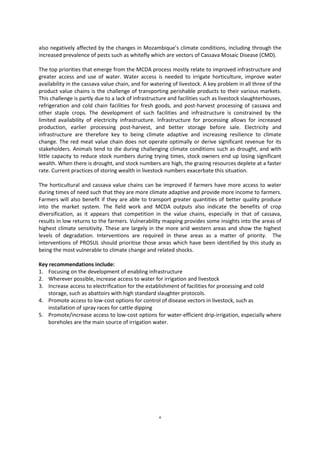
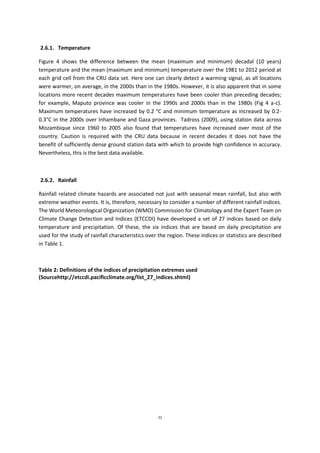
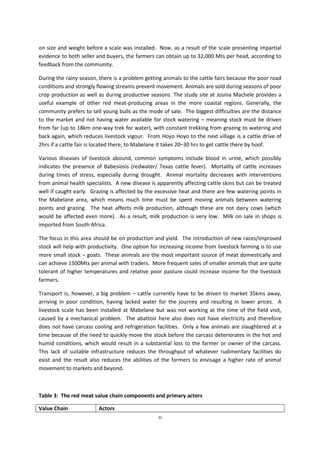
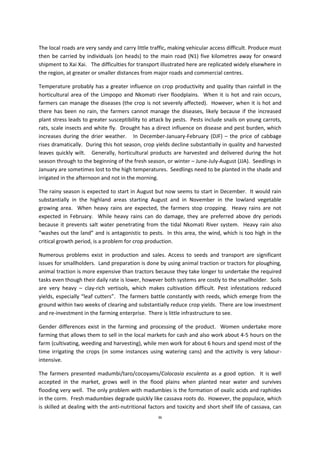
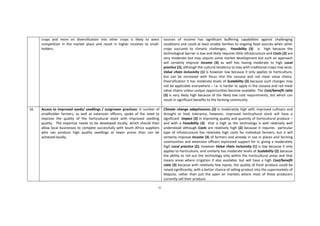
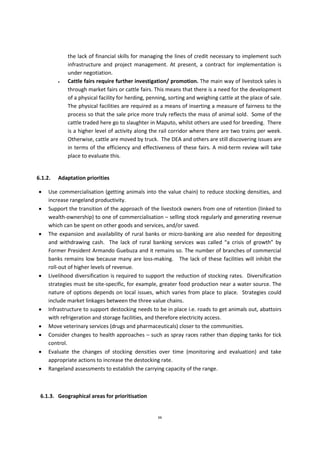
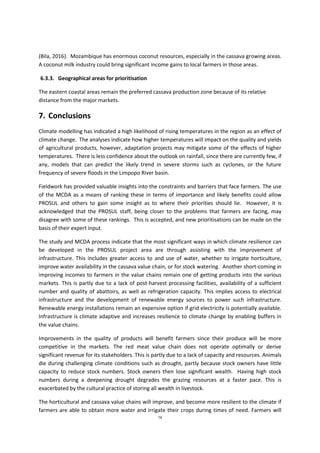
![25
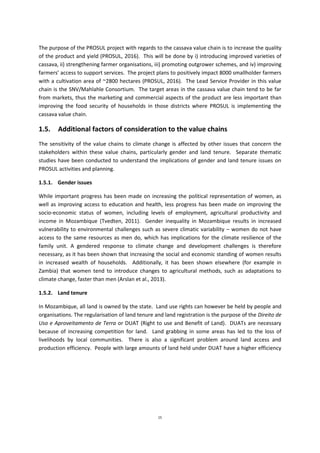
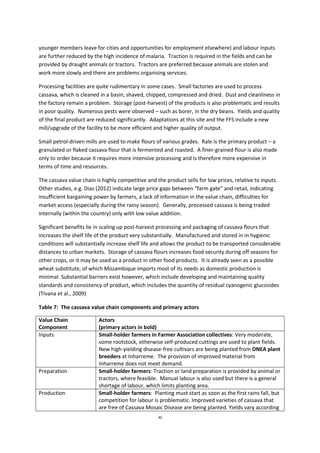
Figure 3: Annual mean temperature for each grid cell for the period 1981-2014. Data taken from
the CRU TS3.23 dataset. Units [Celsius].
Figure 4: Difference between decadal maximum mean temperature and maximum mean
temperatures for the entire period from 1981 to 2012 (a-c), decadal minimum mean temperatures
and minimum mean temperatures for the entire period from 1981 to 2012 (d-f). Data were taken
from CRU TS3.23 datasets. Units [degree Celsius].](https://image.slidesharecdn.com/prosulclimatechangeadaptationthematicstudy-170321135754/85/Prosul-climate-change-adaptation-thematic-study-25-320.jpg)
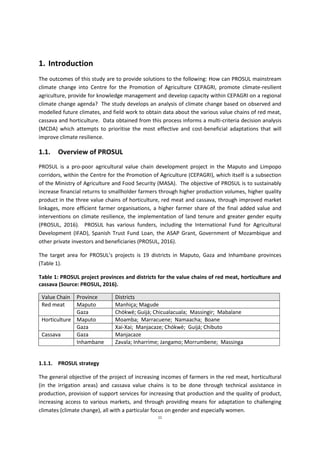
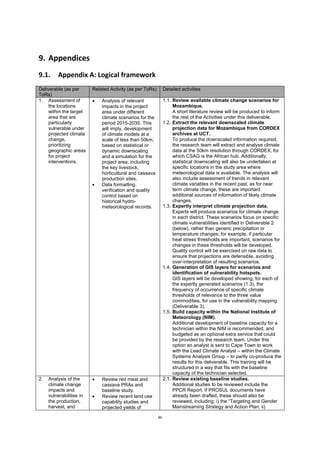
![26
Figure 5: Climatological rainfall onset month (a) and cessation month (b), averaged for the period
1981 to 2014. Based on data from the CHIRPS dataset.
Figure 6: Decadal mean annual rainfall onset (a) and cessation (b) trends for the period 1981 to
2014. Based on data from the CHIRPS dataset. Units [days/decade].](https://image.slidesharecdn.com/prosulclimatechangeadaptationthematicstudy-170321135754/85/Prosul-climate-change-adaptation-thematic-study-26-320.jpg)

![78
8. References
2SCALE, 2015a. 2SCALE | More Cassava from Mozambique [WWW Document]. URL
http://2scale.org/1010 (accessed 3.19.16).
2SCALE, 2015b. 2SCALE | DADTCO [WWW Document]. URL http://2scale.org/757 (accessed 3.19.16).
Arslan, A., McMcCarthy, N., Lipper, L., Asfaw, S., Cattaneo, A., 2013. Adoption and intensity of
adoption of conservation farming practices in Zambia, ESA Working paper No. 13-01.
Agricultural Development Economics Division Food and Agriculture Organization of the
United Nations.
Bila, J., 2016. Coconut Lethal Yellowing Phytoplasma Disease in Mozambique: Diversity, Host Range,
and the Impact of Farming Practices on Disease Incidence (Doctoral Thesis). Faculty of Forest
Sciences Department of Forest Mycology and Plant Pathology, Swedish University of
Agricultural Sciences, Uppsala, Uppsala.
Bournez, L., Cangi, N., Lancelot, R., Pleydell, D.R.., Stachurski, F., Bouyer, J., Martinez, D., Lefrançois,
T., Neves, L., Pradel, J., 2015. Parapatric distribution and sexual competition between two
tick species, Amblyomma variegatum and A. hebraeum (Acari, Ixodidae), in Mozambique.
Parasit. Vectors 8, 504. doi:10.1186/s13071-015-1116-7
Dias, P., 2012. Analysis of incentives and disincentives for cassava in Mozambique (Techniucal notes
series). MAFAP, FAO, Rome.
Dittrich, R., Wreford, A., Moran, D., 2016. A survey of decision-making approaches for climate
change adaptation: Are robust methods the way forward? Ecol. Econ. 122, 79–89.
doi:10.1016/j.ecolecon.2015.12.006
Dosio, A., Panitz, H.-J., 2016. Climate change projections for CORDEX-Africa with COSMO-CLM
regional climate model and differences with the driving global climate models. Clim. Dyn. 46,
1599–1625. doi:10.1007/s00382-015-2664-4
Engelbrecht, C.J., Engelbrecht, F.A., Dyson, L.L., 2013. High-resolution model-projected changes in
mid-tropospheric closed-lows and extreme rainfall events over southern Africa. Int. J.
Climatol. 33, 173–187. doi:10.1002/joc.3420
Eucker, D., Reichel, B., 2012. Final Evaluation: Joint Programme on Environmental Mainstreaming
and Adaptation to Climate Change In Mozambique (Final Report No. UNJP/MOZ/085/SPA).
Millennium Development Goal Achievement Fund - Secretariat.
FAO, 2008. FAO: Agriculture: Cassava [WWW Document]. URL
http://www.fao.org/ag/agp/agpc/gcds/ (accessed 3.19.16).
FAO, 2004. Drought impact mitigation and prevention in the Limpopo River Basin: A situation
analysis. FAO Land and Water Division, Food and Agriculture Organiastion of the United
Nations, Rome.
Fauquet, C., Fargette, D., 1990. African Cassava Mosaic Virus: Etiology, Epidemiology, and Control.
Plant Dis. 74, 404–411.
Favretto, N., Stringer, L.C., Dougill, A.J., Dallimer, M., Perkins, J.S., Reed, M.S., Atlhopheng, J.R.,
Mulale, K., 2016. Multi-Criteria Decision Analysis to identify dryland ecosystem service trade-
offs under different rangeland land uses. Ecosyst. Serv. 17, 142–151.
doi:10.1016/j.ecoser.2015.12.005
FEWS NET, 2014. USGS FEWS NET Data Portal: Africa. FEWS NET.
Fontana, V., Radtke, A., Bossi Fedrigotti, V., Tappeiner, U., Tasser, E., Zerbe, S., Buchholz, T., 2013.
Comparing land-use alternatives: Using the ecosystem services concept to define a multi-
criteria decision analysis. Ecol. Econ. 93, 128–136. doi:10.1016/j.ecolecon.2013.05.007
Füssel, H.-M., Klein, R.J.T., 2006. Climate Change Vulnerability Assessments: An Evolution of
Conceptual Thinking. Clim. Change 75, 301–329. doi:10.1007/s10584-006-0329-3
Meneses-Tovar, C., 2011. NDVI as an indicator of degradation. Unasylva 238 Vol 62 20112 62 (2).](https://image.slidesharecdn.com/prosulclimatechangeadaptationthematicstudy-170321135754/85/Prosul-climate-change-adaptation-thematic-study-78-320.jpg)
![79
Niang, I., Ruppel, O.C., Abdrabo, M.A., Essel, A., Lennard, C., Padgham, J., Urquhart, P., 2014. Africa,
in: Barros, V.R., Field, C.B., Dokken, D.J., Mastrandrea, M.D., Mach, K.J., Bilir, T.E., Chatterjee,
M., Ebi, K.L., Estrada, Y.O., Genova, R.C., Girma, B., Kissel, E.S., Levy, A.N., MacCracken, S.,
Mastrandrea, P.R., White, L.L. (Eds.), Climate Change 2014: Impacts, Adaptation, and
Vulnerability. Part B: Regional Aspects. Contribution of Working Group II to the Fifth
Assessment Report of the Intergovernmental Panel of Climate Change. Cambridge University
Press, Cambridge, United Kingdom and New York, NY, USA, pp. 1199–1265.
Omuto, C.T., Vargas, R.R., Alim, M.S., Paron, P., 2010. Mixed-effects modelling of time series NDVI-
rainfall relationship for detecting human-induced loss of vegetation cover in drylands. J. Arid
Environ. 74, 1552–1563. doi:10.1016/j.jaridenv.2010.04.001
Petrie, B., Chapman, R., Midgley, A., Parker, R., 2014. Risk, vulnerability and Resilience in the
Limpopo River Basin: Climate change, water and biodiversity - a synthesis.
PROSUL, 2016. Annual Progress Reports 2015 (January-December 2015). PROSUL, Centre for the
Promotion of Agriculture, Ministry of Agriculture and Food Security, Republic of
Mozambique.
Sruthi, S., Aslam, M.A.M., 2015. Agricultural Drought Analysis Using the NDVI and Land Surface
Temperature Data; a Case Study of Raichur District. Aquat. Procedia, INTERNATIONAL
CONFERENCE ON WATER RESOURCES, COASTAL AND OCEAN ENGINEERING (ICWRCOE’15) 4,
1258–1264. doi:10.1016/j.aqpro.2015.02.164
Tezara, W., Mitchell, V.J., Driscoll, S.D., Lawlor, D.W., 1999. Water stress inhibits plant
photosynthesis by decreasing coupling factor and ATP. Nature 401, 914–917.
doi:10.1038/44842
Tivana, L., Da Cruz Francisco, J., Bergenståhl, B., Dejmek, P., 2009. Cyanogenic Potential of Roasted
Cassava (Manihot esculenta Crantz) roots Rale from Inhambane Province, Mozambique.
Czech J. Food Sci. 27, S375–S378.
Tvedten, I., 2011. Mozambique Country Case Study: Gender Equality and Development (World
Development Repor 2012: Gender Equality and Development: Background Paper). World
Bank Group, Washington, DC.
UNCTAD, 2016. Merchandise trade matrix, exports and imports to world by product groups, annual,
1995-2014 - Mozambique Data Portal [WWW Document]. Knoema. URL
http://mozambique.opendataforafrica.org//UNCTADMTMEIWCG2016/merchandise-trade-
matrix-exports-and-imports-to-world-by-product-groups-annual-1995-2014 (accessed
12.6.16).
Way, D.A., Katul, G.G., Manzoni, S., Vico, G., 2014. Increasing water use efficiency along the C3 to C4
evolutionary pathway: a stomatal optimization perspective. J. Exp. Bot. 65, 3683–3693.
doi:10.1093/jxb/eru205
Whipp, L., Daneshkhu, S., 2016. Big business identifies appetite for plant-based milk [WWW
Document]. Financ. Times. URL https://www.ft.com/content/7df72c04-491a-11e6-8d68-
72e9211e86ab (accessed 11.22.16).
Williams, C.A., Hanan, N.P., 2011. ENSO and IOD teleconnections for African ecosystems: evidence of
destructive interference between climate oscillations. Biogeosciences 8, 27–40.
doi:10.5194/bg-8-27-2011
Yengoh, G., Dent, D., Olsson, L., Tengberg, A., Tucker, C., 2014. The use of the Normalized Difference
Vegetation Index (NDVI) to assess land degradation at multiple scales: a review of the
current status, future trends, and practical considerations. Lund University Center for
Sustainability Studies (LUCSUS), and The Scientific and Technical Advisory Panel of the
Global Environment Facility (STAP/GEF).
2SCALE, 2015a. 2SCALE | More Cassava from Mozambique [WWW Document]. URL
http://2scale.org/1010 (accessed 3.19.16).
2SCALE, 2015b. 2SCALE | DADTCO [WWW Document]. URL http://2scale.org/757 (accessed 3.19.16).](https://image.slidesharecdn.com/prosulclimatechangeadaptationthematicstudy-170321135754/85/Prosul-climate-change-adaptation-thematic-study-79-320.jpg)


The document outlines a pro-poor agricultural value chain development project in southern Mozambique, assessing the impacts of climate change on horticulture, cassava, and red meat value chains. It identifies rising temperatures and changing rainfall patterns as significant challenges to these agricultural sectors while emphasizing the need for improved infrastructure, access to water, and climate-resilient practices. Recommendations include prioritizing infrastructure development, enhancing water access for irrigation, and promoting disease control in livestock to improve farmers' resilience to climate change.