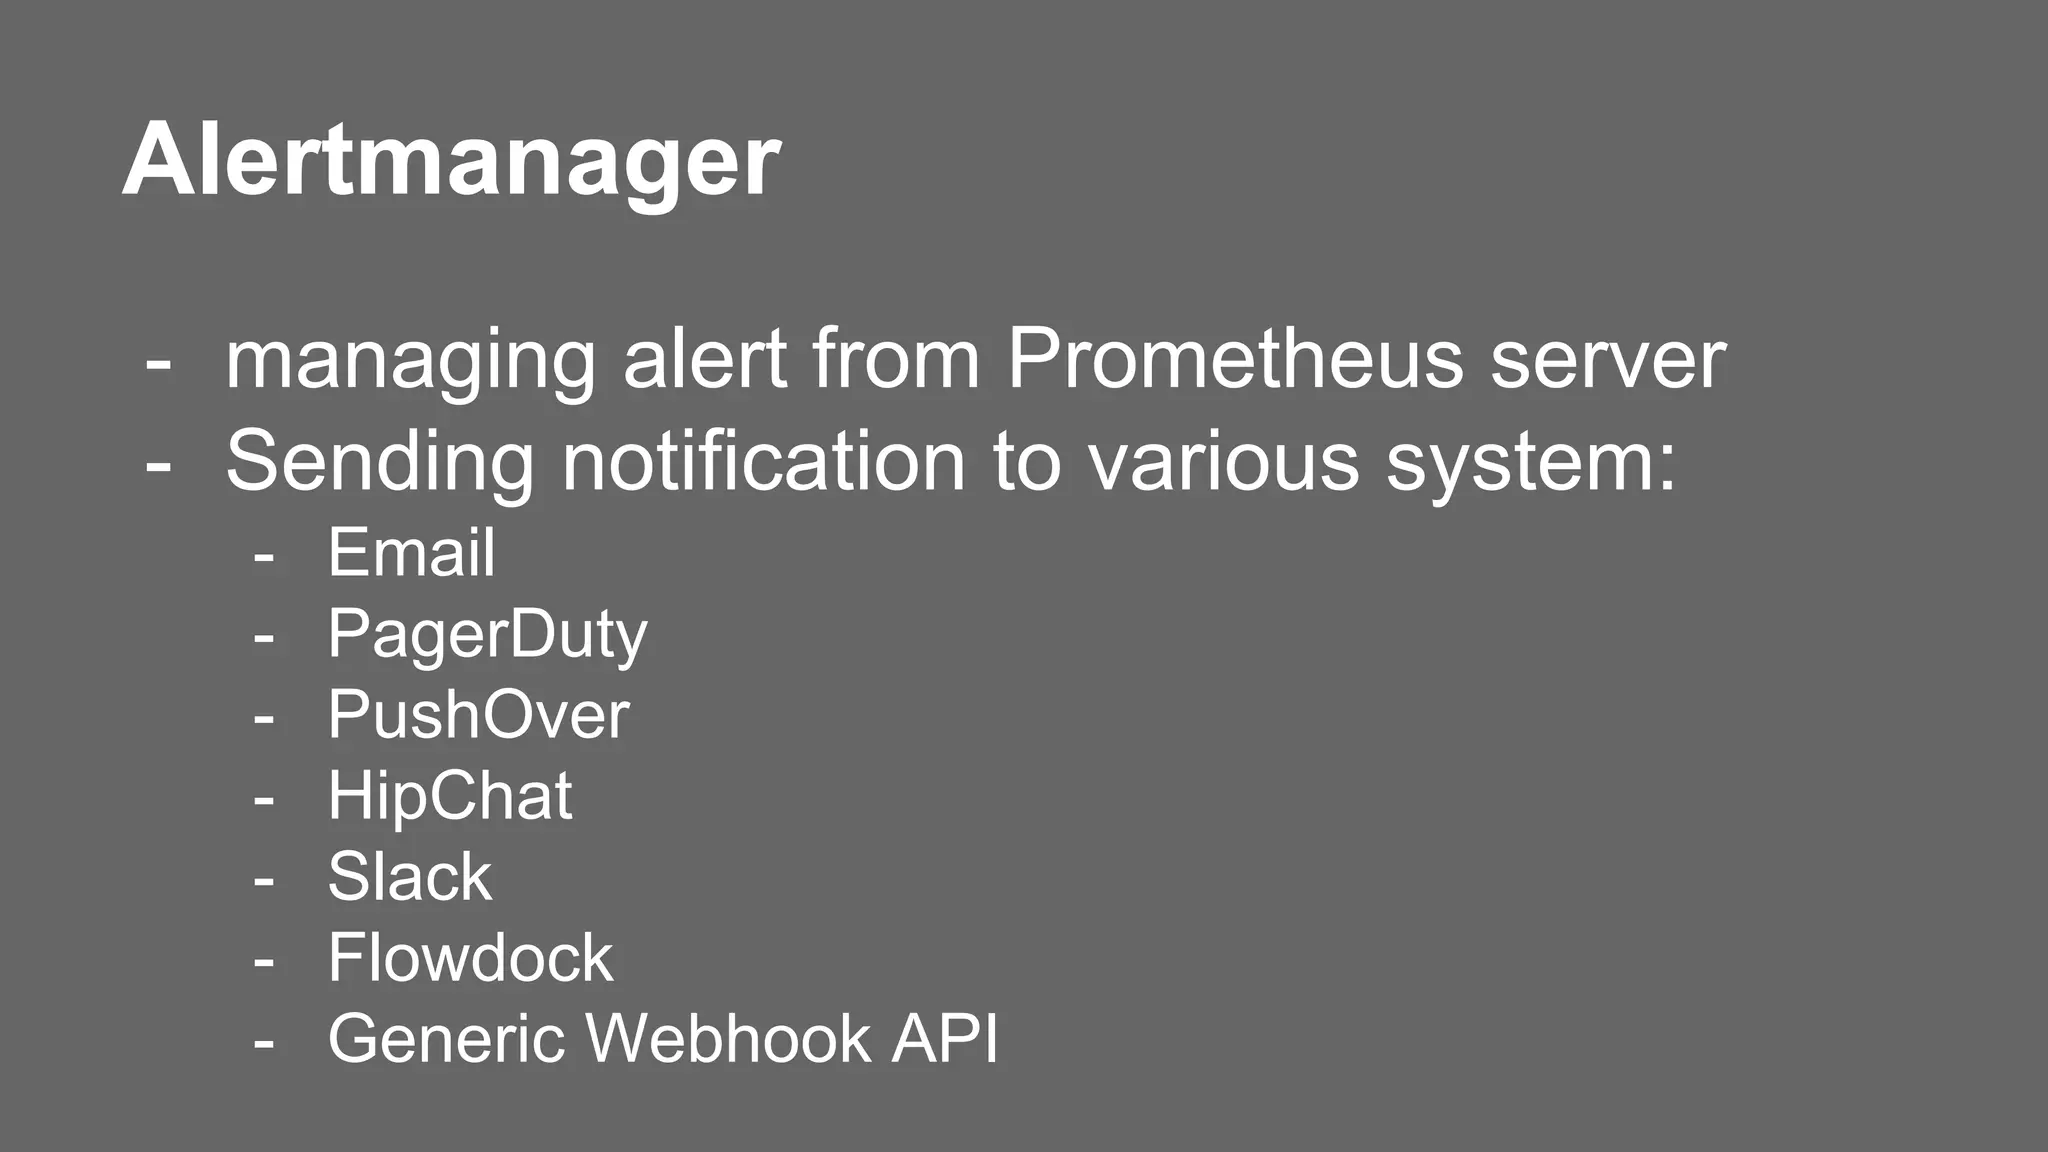
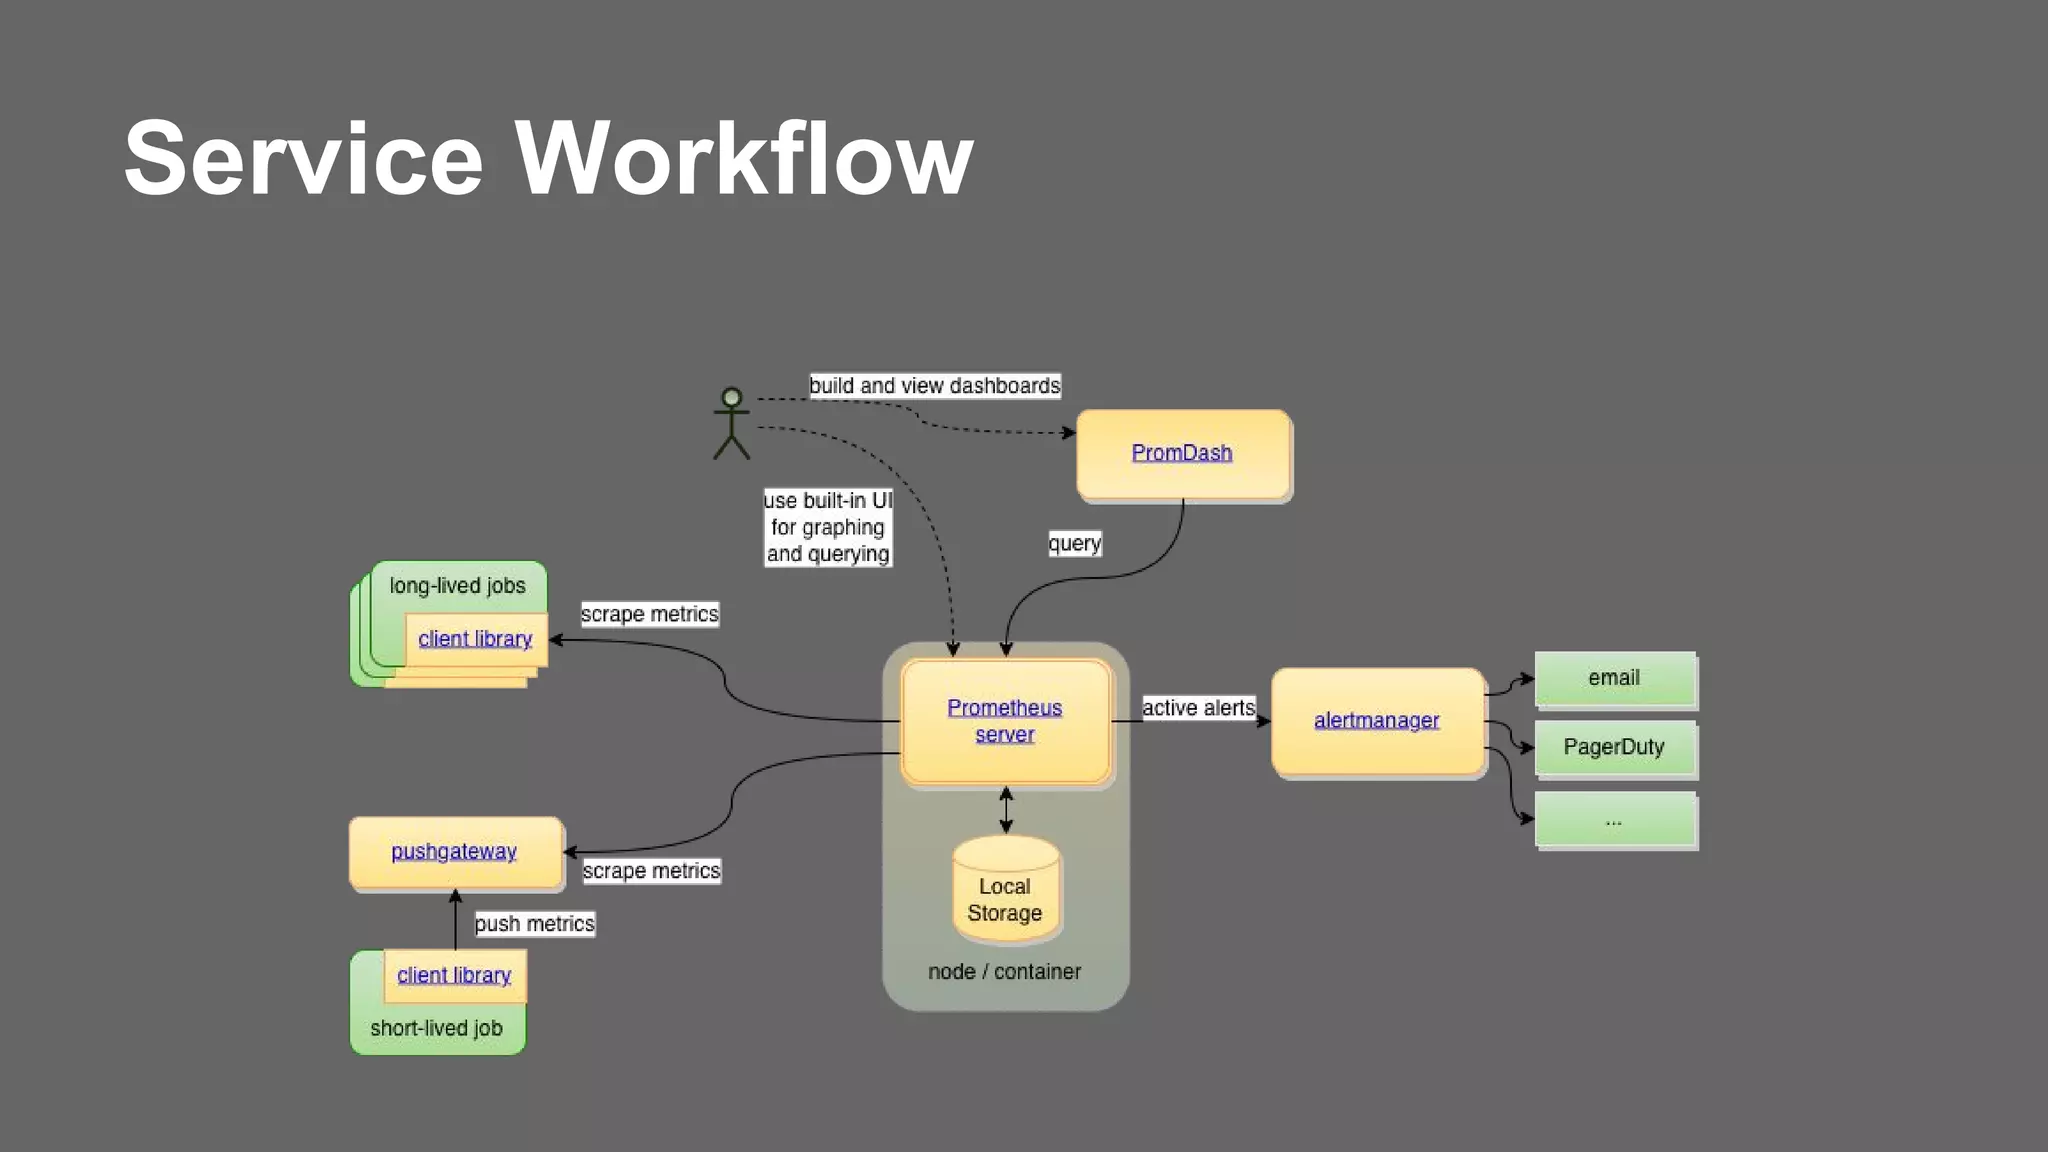
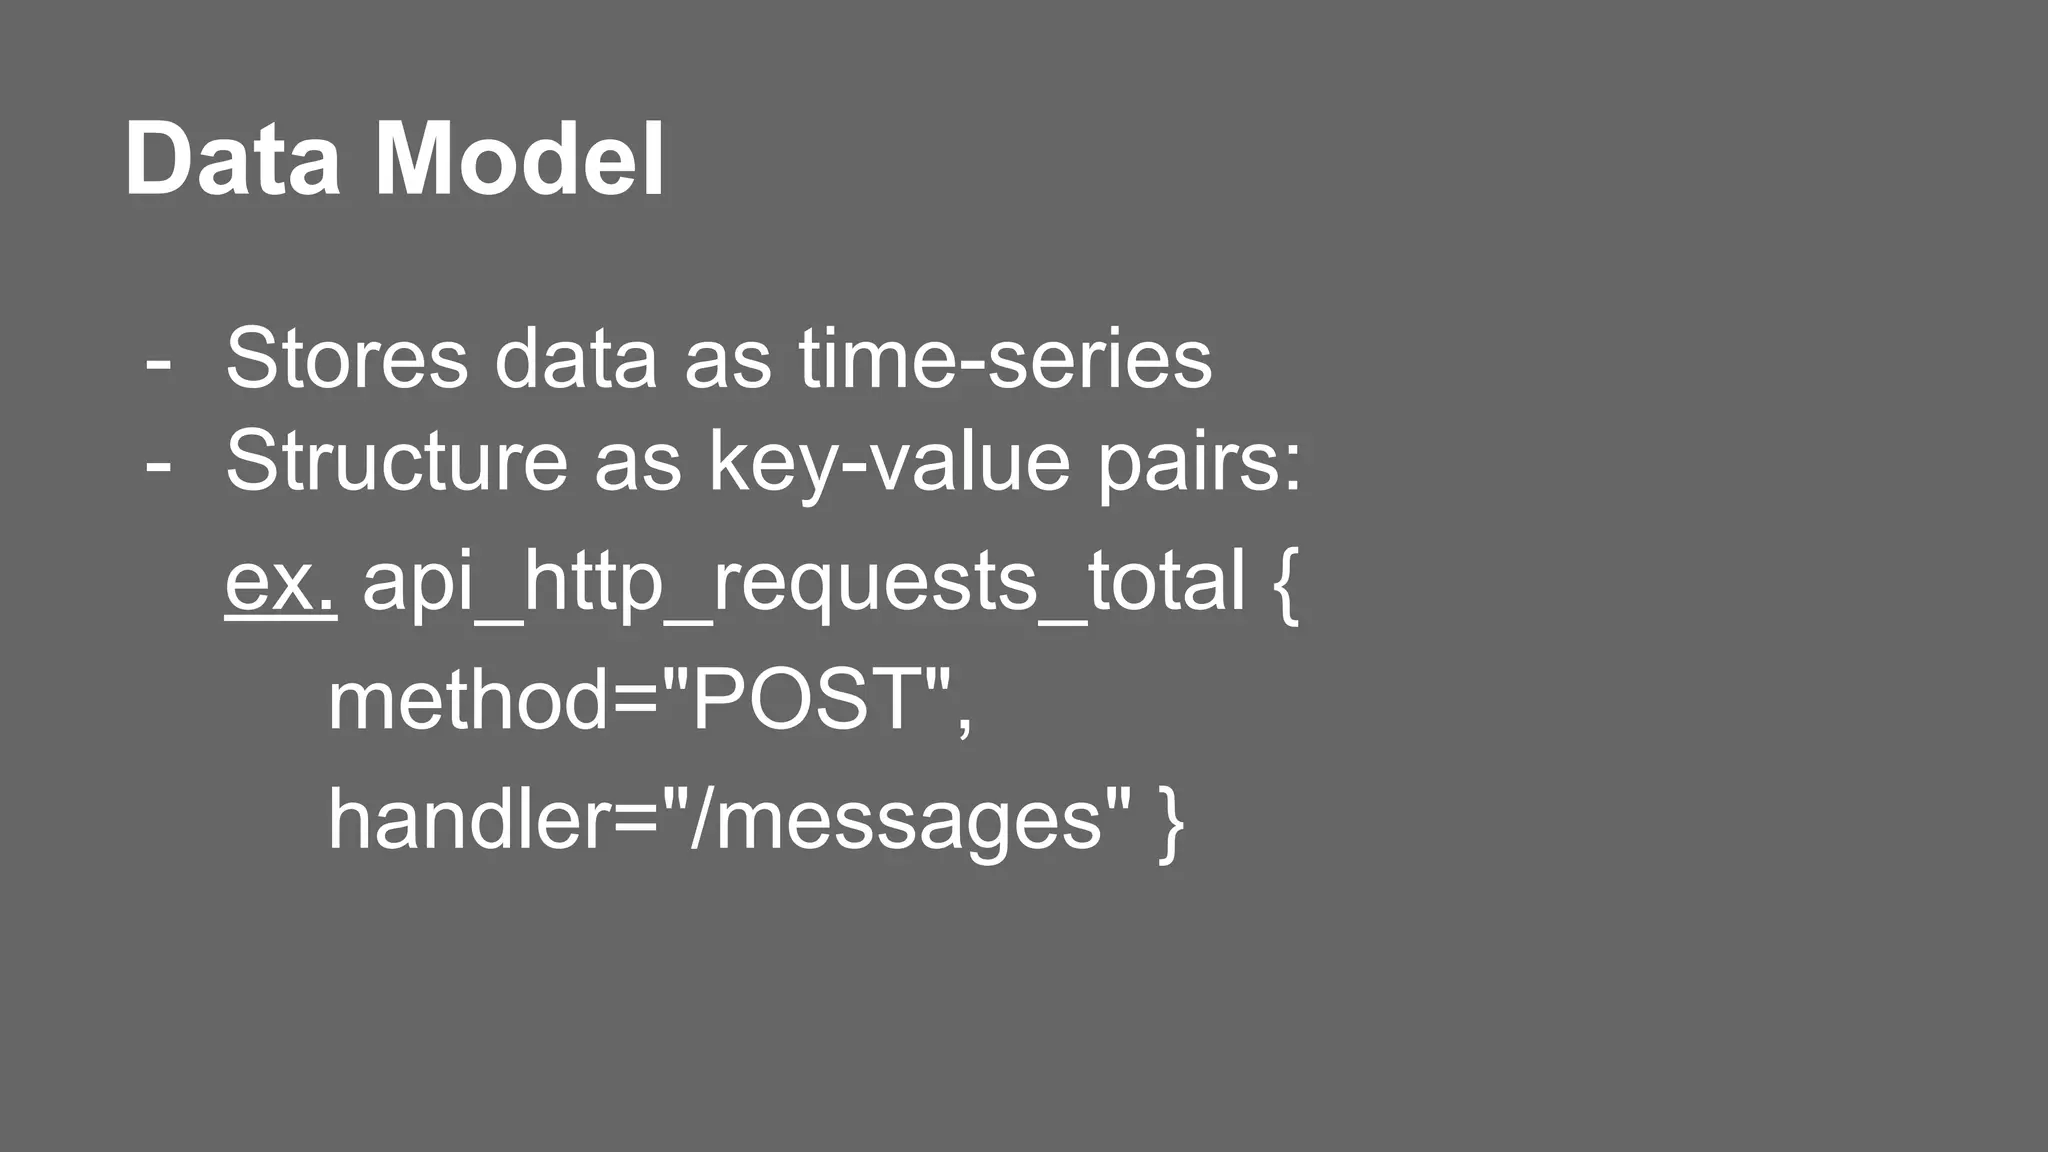
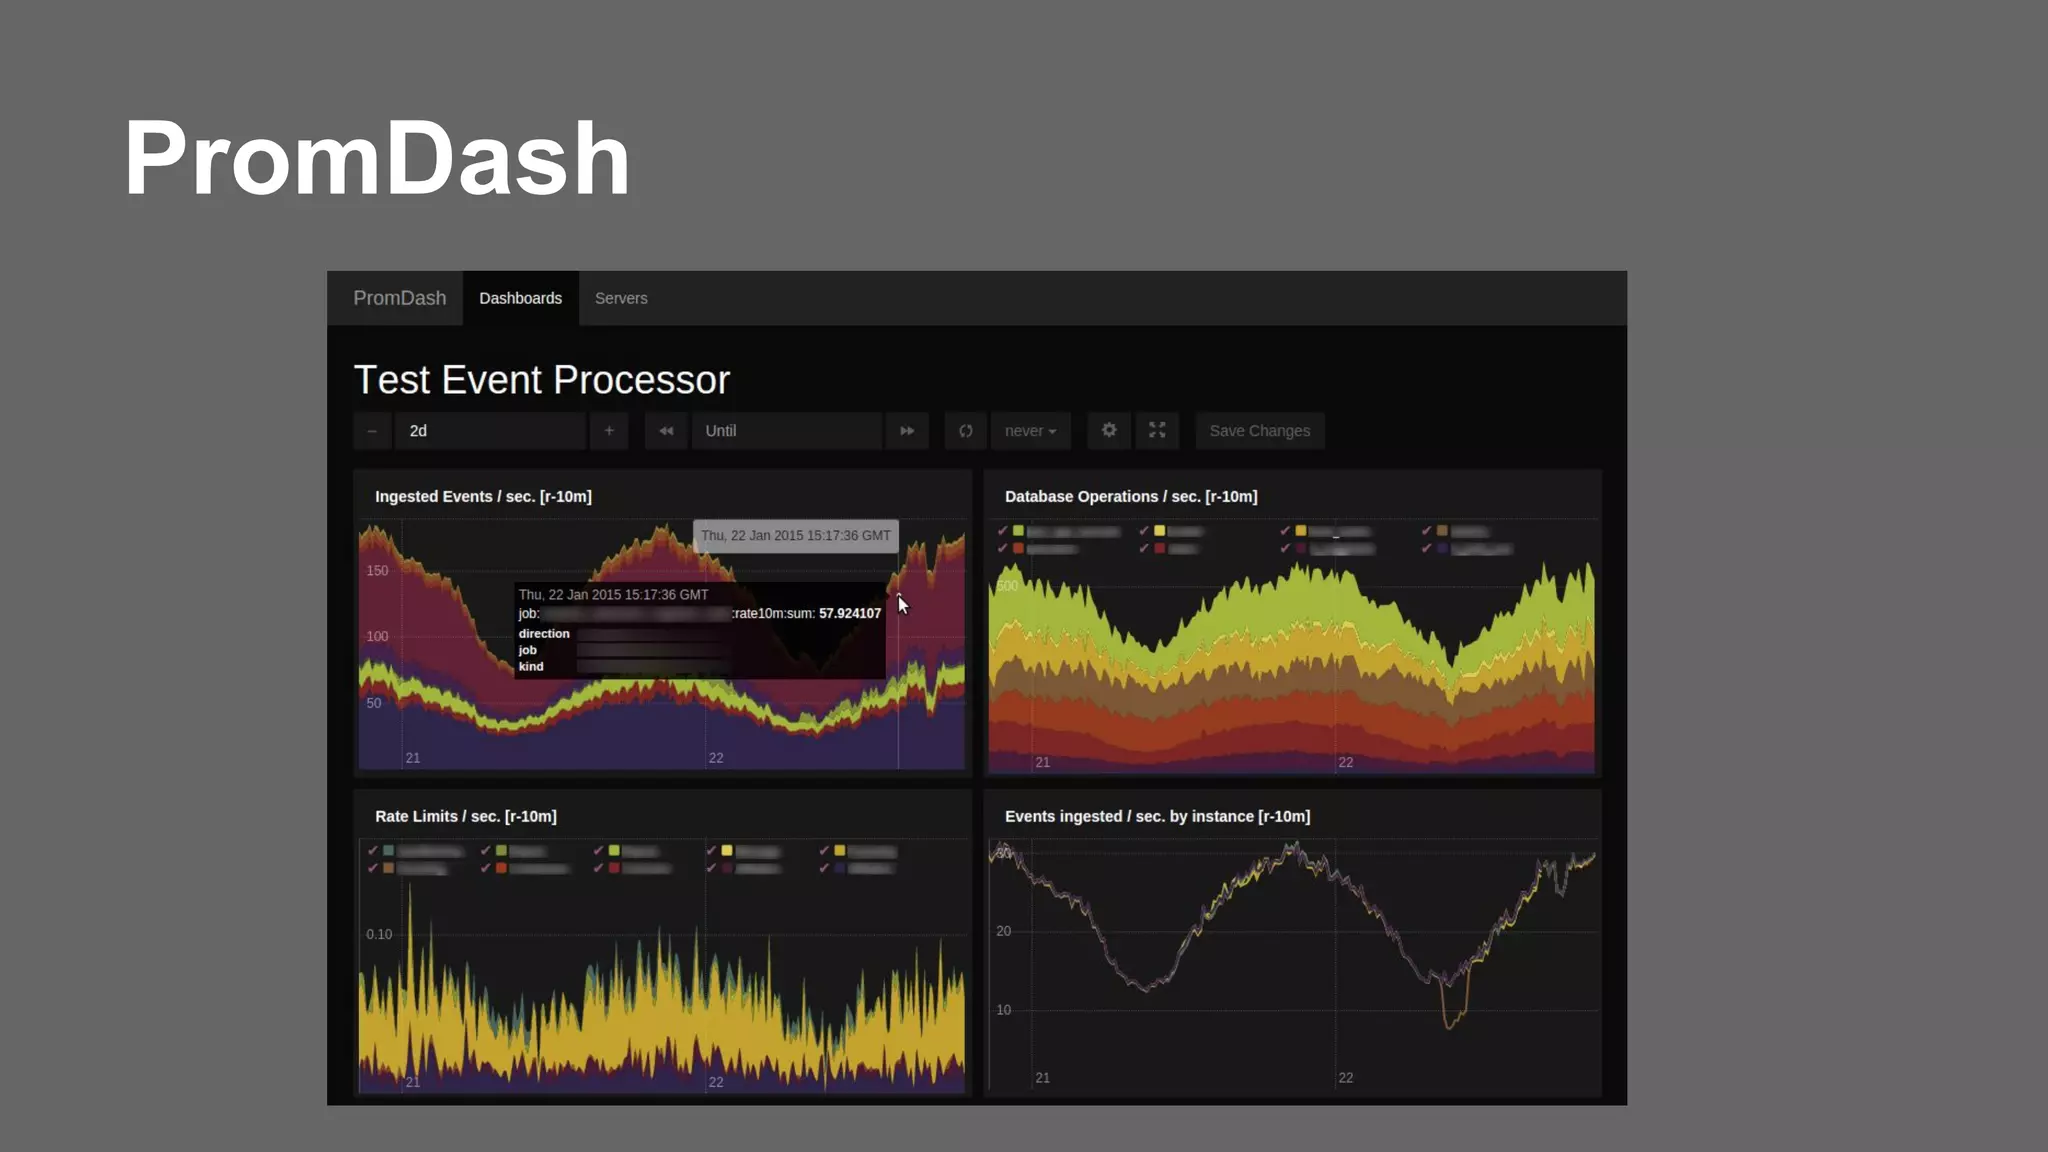
Prometheus is an open-source monitoring system that stores time-series data in a time-stamped database. It includes components like a Prometheus server to store time-series data, exporters to collect metrics, PromDash or Grafana for visualization, and Alertmanager to handle alerts. It uses a simple query language to select and aggregate time-series data and can generate alerts based on rules defined on the Prometheus server.
![Query language
- Query metrics from server using expression
ex. rate(http_requests_total[5m]):
total HTTP request as measured over the
last 5 minutes.](https://image.slidesharecdn.com/prometheus-151210075925/75/Prometheus-Proteus-Operations-9-2048.jpg)
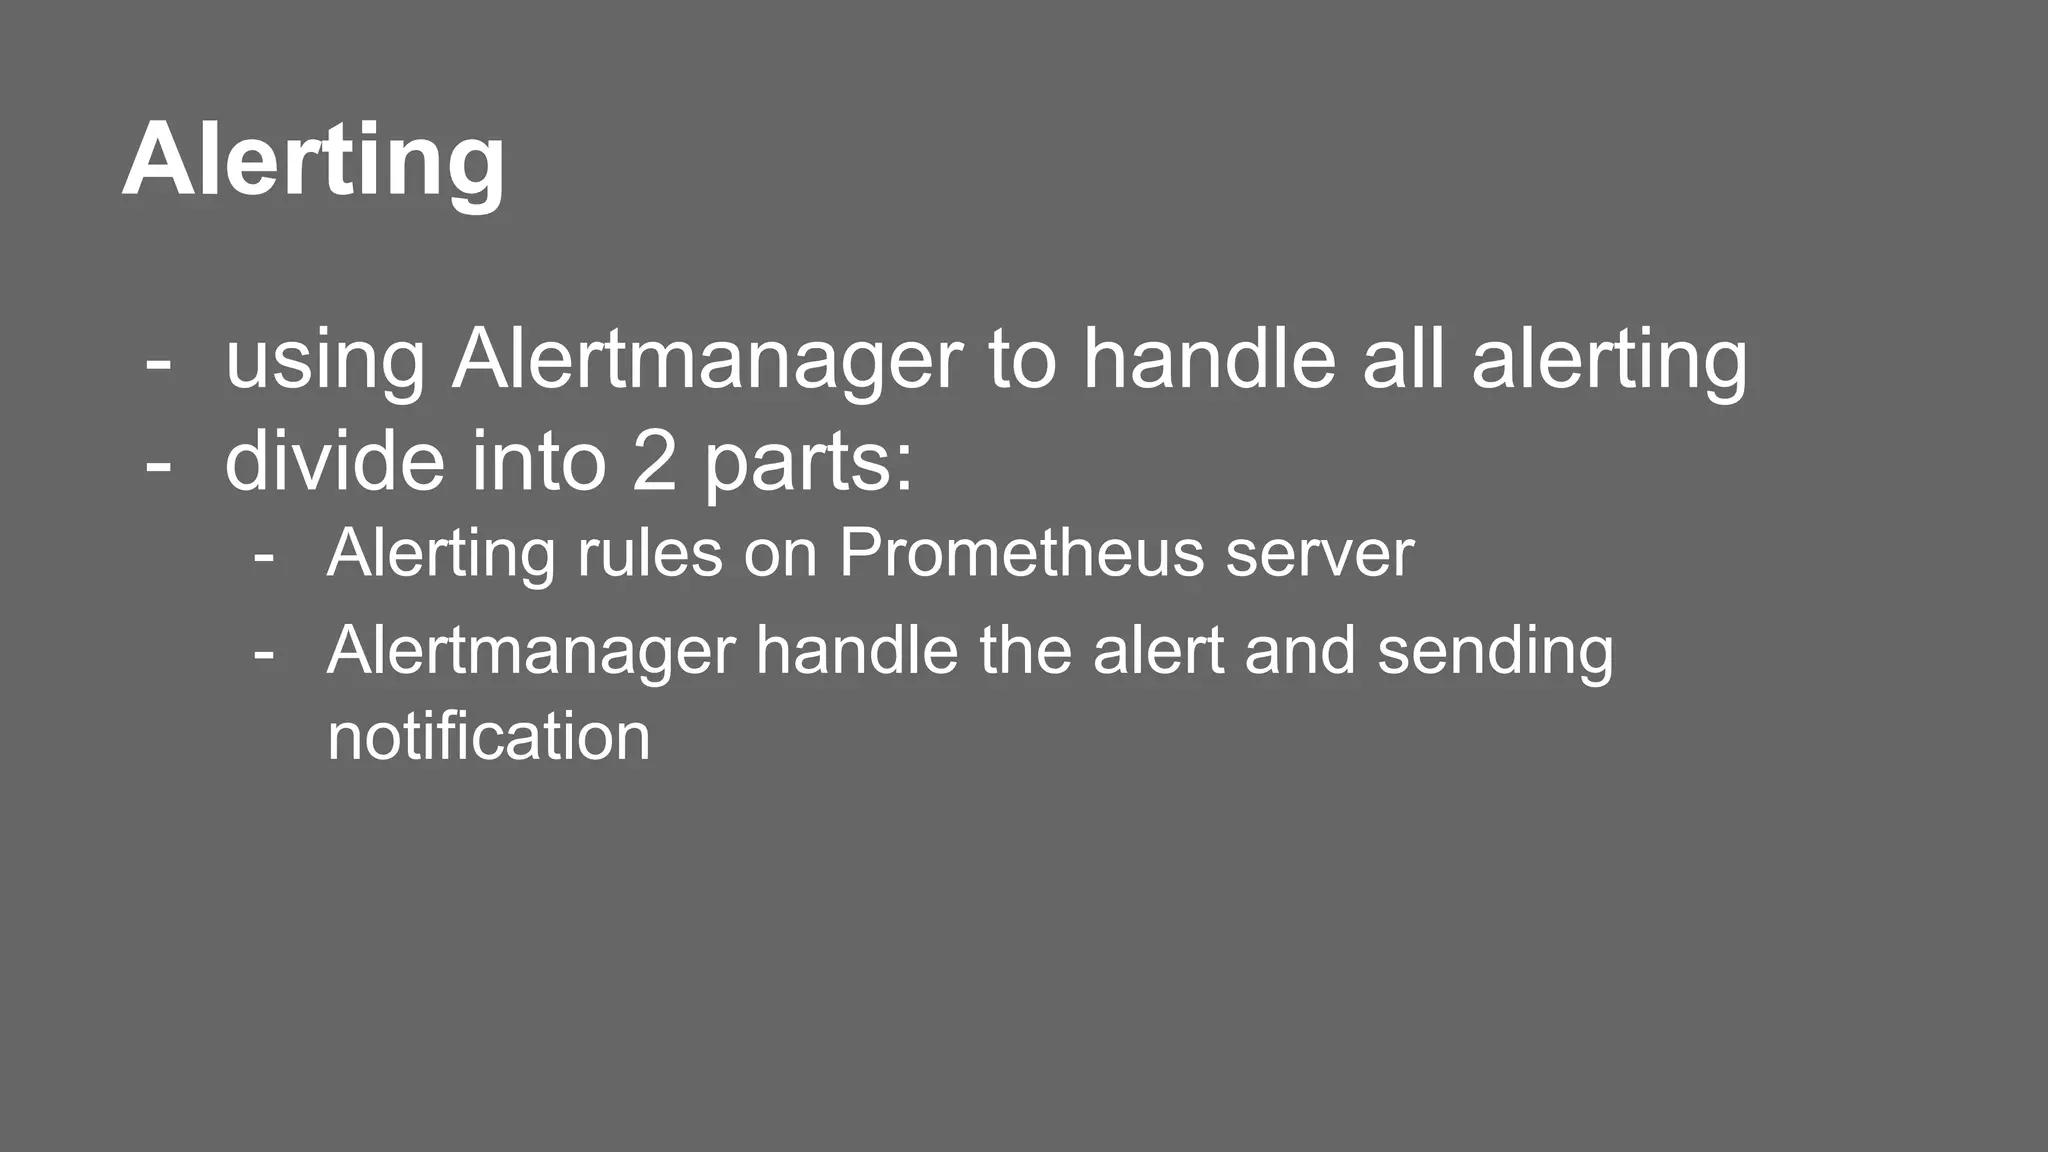
![Alerting rules
- Define what to alert on Prometheus server
- Prometheus send the alert to alertmanager
ex.
ALERT <alert name>
IF <expression>
[FOR <duration>]
[WITH <label set>]
SUMMARY "<summary>"
DESCRIPTION "<description>"](https://image.slidesharecdn.com/prometheus-151210075925/75/Prometheus-Proteus-Operations-13-2048.jpg)