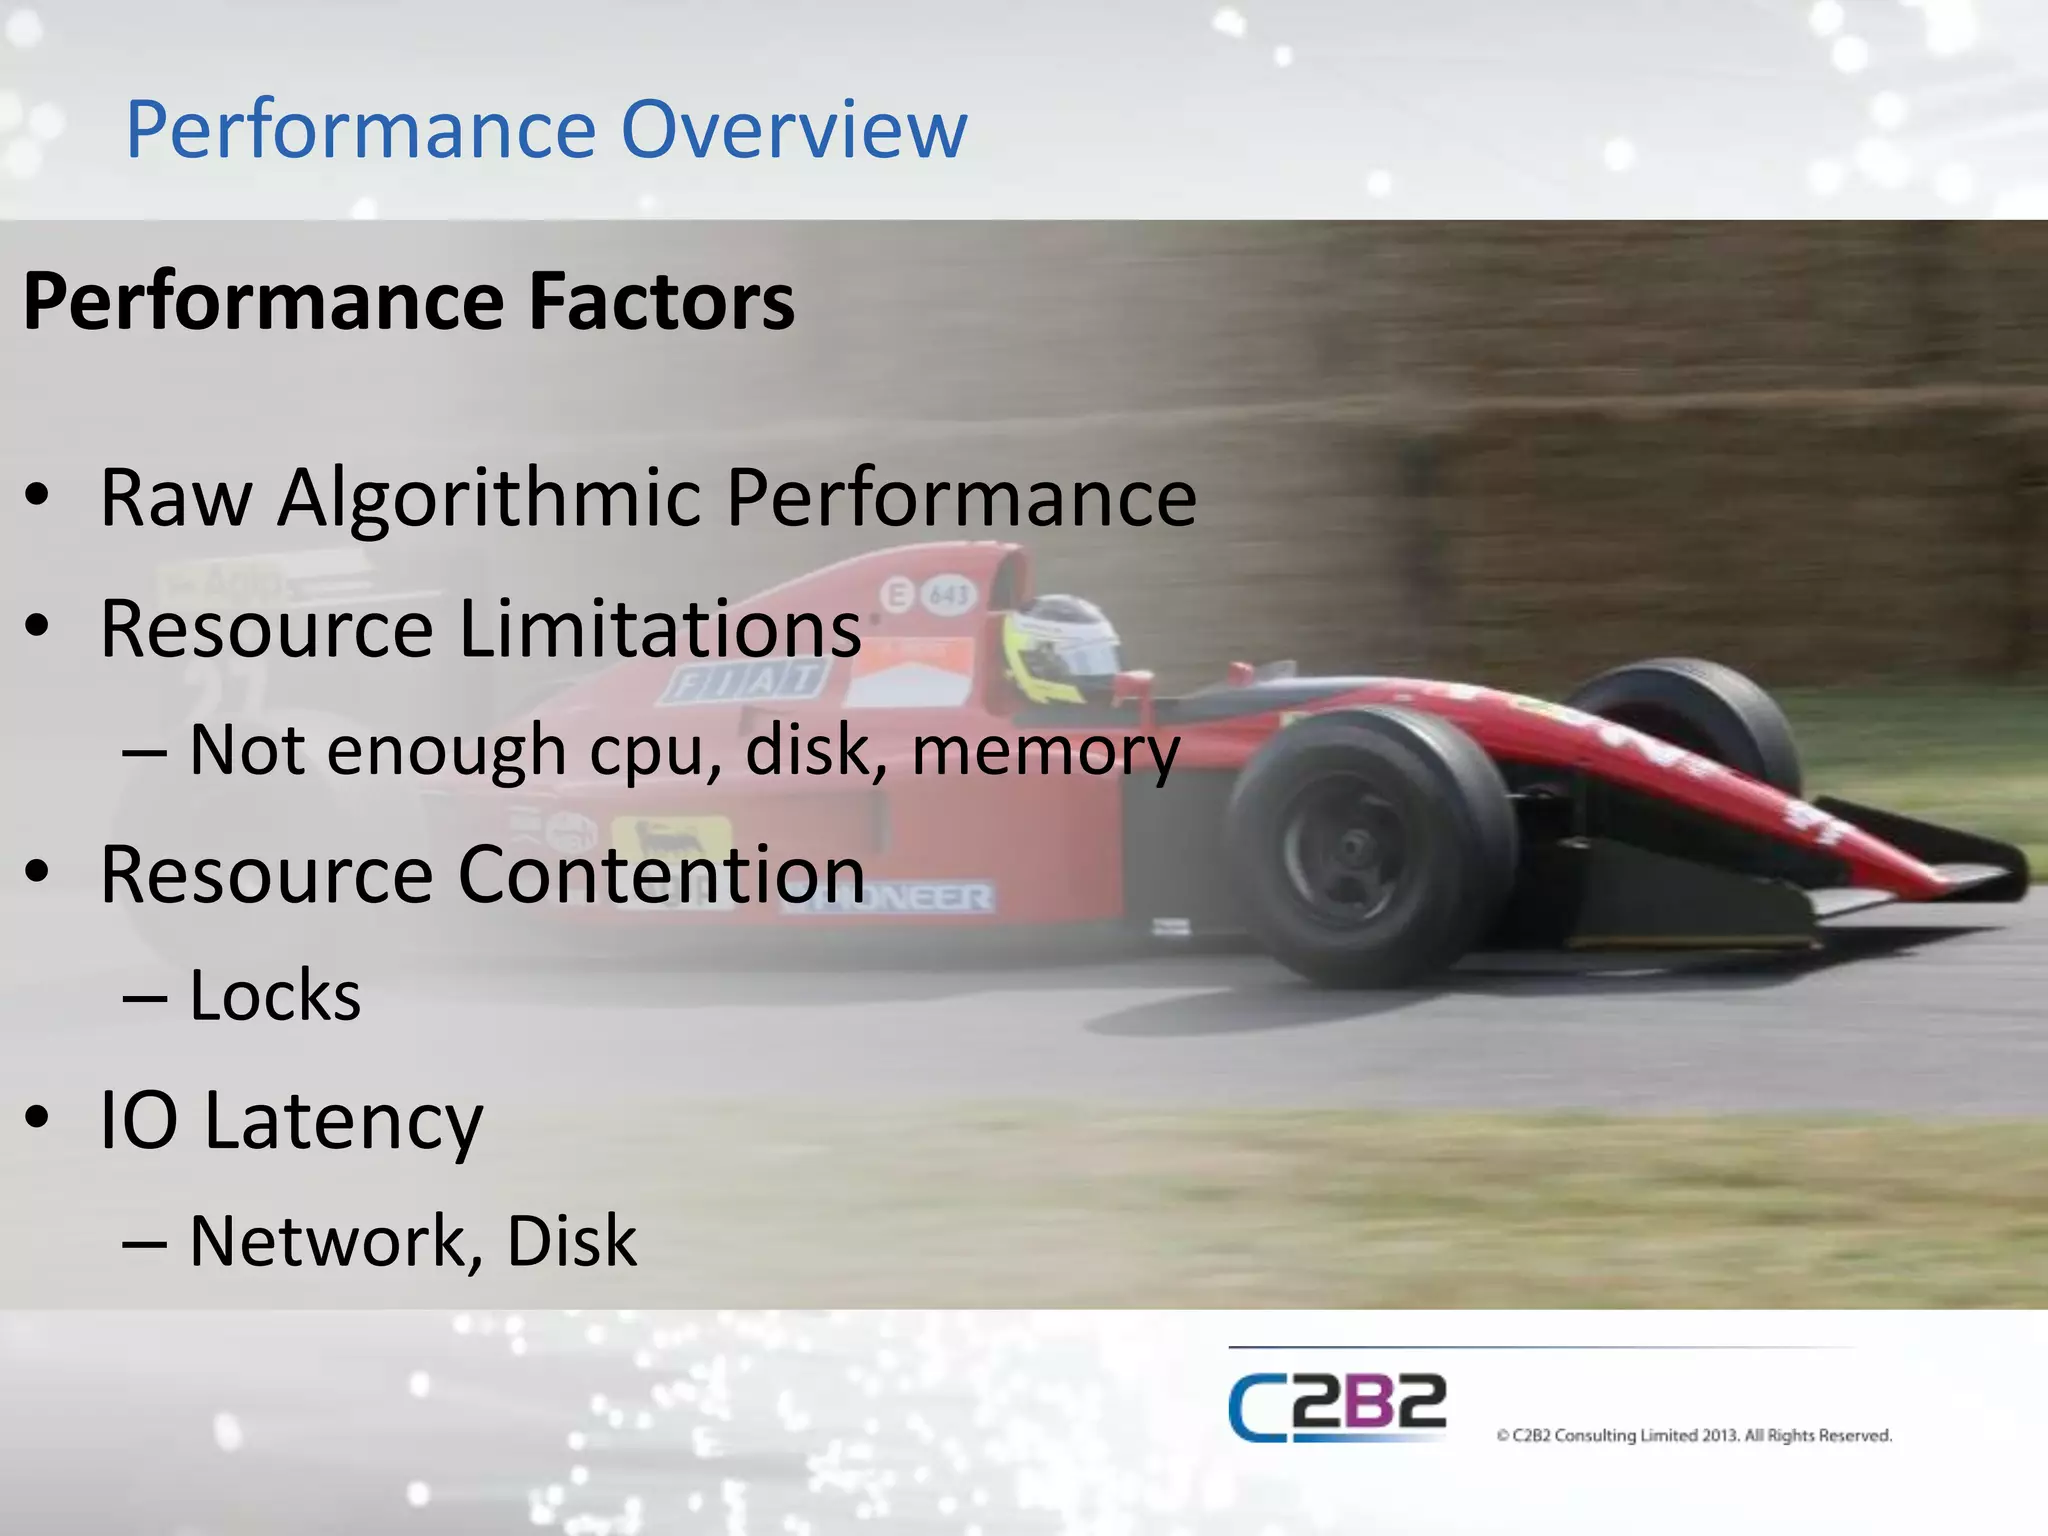
The science of performance
Mike Croft
Hands-on Performance Workshop
Who are you?
Who Am I?
• C2B2 Expert Support consultant
• Ex-IBM
• Snowboarder
• @croft
Why are we here?
• Hands-on performance!
– Hands on what?
• See what tools are available
• Get experience of using some tools
• Learn how to apply knowledge
• Why do you want to be here?
Agenda
• Introduction
• Environment setup
• Performance Overview
• Collecting Data
– Presentation
– Practical
• How do we interpret the data?
– Tools
• Example app analysis
What Won’t We Talk About?
• Profiling
– Covered by Simon Maple of ZeroTurnaround
earlier this week
• Code examples
• Microbenchmarks
– Aleksey Shipilev and JEP 230 have that covered :-)
– http://openjdk.java.net/jeps/230
Extension Activities
• Two extra activities if you finish others early
• Deliberately left with very little instruction
• Use techniques which are most useful to you
Hands-on Performance Workshop
Environment Setup
Environment Setup
• Download Instructions and follow the first part
• Make sure all necessary resources are downloaded
• Make sure the app is deployed and JMeter can run
load through it
https://s3-eu-west-1.amazonaws.com/devoxx2015/instructions.docx
https://s3-eu-west-1.amazonaws.com/devoxx2015/extension-activities.docx
Hands-on Performance Workshop
Performance Overview
Performance Factors
• Raw Algorithmic Performance
• Resource Limitations
– Not enough cpu, disk, memory
• Resource Contention
– Locks
• IO Latency
– Network, Disk
Performance Overview
Latency Factors
• Network Distance
• Network Reliability
• Data Size
• Operation Granularity
• Resource Contention
• JVM GC
Performance Overview
Hands-on Performance Workshop
Collecting Data
Collecting Data
• Garbage Collection
• Verbose GC
• Heap size
– New size and old size
– Before collection
– After collection
• Pause time
Collecting Data
• Thread dumps
– Kill -3
– JStack
• Thread state
– Wait
– Sleep
– Blocked
– Running
• Full stack trace
Collecting Data
• Heap dumps
• Entire contents of the heap
– Very Large!
– Can take time to collect on large
heaps
• Can auto-dump on OOME
Hands-on Performance Workshop
Interpreting Data
Interpreting Data
• Tools
– Live monitoring
• VisualVM
• MissionControl
• JMX
– Historical analysis
• Memory Analyzer Tool
• Flight Recorder (commercial)
• Threadlogic
• GCViewer
Hands-on Performance Workshop
Tuning for Performance
Strategy
• Planning
– What is your definition of success?
– What settings are available to tune?
– Can you prioritise which to tune first?
• Execution
– Test

Hands-on Performance Tuning Lab - Devoxx Poland

Editor's Notes

  • #3 Firstly – who are you? I want to know who my audience is so I can avoid teaching Grandma to suck eggs! Who works with Java EE middleware? Standard Java EE or Spring? Who is a developer? Who is operations or support?
  • #4 C2B2 Expert Support consultant This doesn’t mean much – I handle all sorts of problems with Java middleware. Includes WebLogic/SOA Suite; Jboss/WildFly; GlassFish/Payara; Tomcat etc Ex-IBM Used to work with WebSphere too Still follow WebSphere’s activity Liberty Profile is pretty cool Very intuitive to build a profile Snowboarder I love speed! Dodgy collarbone to prove it Wondering if I’d rather be snowboarding? The answer is always “yes”  @croft Tweet me!
  • #12 Performance in middleware comes down to: How fast does a single transaction take to execute? Faster Performance = Happier Customers Faster Performance = More Transactions HOWEVER Performance is the P in R-A-S-P and the other letters should be ignored to your peril! There is always a trade-off to consider!
  • #13 Performance vs Latency Performance Factors = what things do you have that can make you run faster? Latency Factors = what things do you have which might slow you down? How to maximise performance and minimise latency Raw Algorithmic Performance Just improving the way your algorithms work Venkat has done a few talks about lazy evaluation in Java 8 Rather than process an entire collection for each operation, it only does as much work is needed to satisfy the final operation Use someone else’s algorithm JSR 107 – JCache – is coming. The simplest implementation of JCache is just a ConcurrentHashMap, but writing the code to manage the hashmap yourself is asking for trouble! Hazelcast, Infinispan, Coherence, etc etc all implement the JCache standard, so they will manage your data, ensure best performance for synchronisation and help you avoid excessive memory usage. Because it’s a standard API, you can be loosely coupled enough to swap out your provider by changing your maven dependency Resource Limitations Not enough cpu, disk, memory Think of lunchtime! We have a few stations to serve people one of two options, but there is a limit to the amount of food that can go in each container. Once the container is finished, we have to fetch more. We can’t fetch more too soon, because it will get cold and flies might get on it, so we have a stop-the-food pause  Remedy here is to add another station which can keep the food warm and serve it at the same time. We don’t want too many food stations, because they are expensive (wages, energy, etc) and if there are too many then there won’t be enough people to eat the food and keep all the stations busy. Resource Contention Locks Back to the food station! If there are two lines with two types of food to share then we can serve both lines in parallel If there is only one serving spoon, then we can only serve the two lines concurrently While the Chicken line is being served, they have a lock on the serving spoon If this lock is held for too long, it could slow down performance a lot How is the spoon cleaned? A bucket with hot soapy water and a cloth at the station is the quickest way If the spoon has to go back to the kitchen to be cleaned, the lock will be held for far too long! IO Latency Network, Disk Had a customer who was writing logs to SAN based storage, with a massive Gigabit pipe. They were running on SOA Suite, which has a lot of moving parts that no-one understands, so it was very difficult to convince the network guys that they needed to take a look at their SAN configuration. They had a very low latency Gigabit pipe, so they thought it couldn’t possibly be their fault. It turned out that the network was configured to send data from the SOA Suite domain to the SAN by going through a very low capacity switch, which was introducing latency of seconds for each write! Also had a customer who wanted to use log-based monitoring, by using logstash. Their solution (in production!) was to write logs directly to and AWS instance, which was located in Ireland
  • #14 LATENCY = Time delay in requesting an operation and it being initiated Key factor in large scale distributed applications Typically not taken into account during development
  • #15 Lots of controls, with some knowledge of how each control works Unlikely to have full understanding of how each control works individually Highly unlikely to have full understanding of how all work together Impossible (?) to have full understanding of how all work together with your code on top!
  • #18 Flight Recorder (commercial feature only)
  • #19 Simon Maple earlier this week: “Thread dumps make very good bedtime reading, cause they’ll put you to sleep!” They don’t have to! You don’t need to be a performance engineering ninja to find some usefulness in a thread dump (Although the right tools help)
  • #22 Tips: Look for what’s obvious! Don’t spend hours/days/weeks/months looking in the same place, when there are other unexplored areas You can always (and should) revisit a data set
  • #24 Planning What is your definition of success? What settings are available to tune? Can you prioritise which to tune first? Execution Test