Download as PDF, PPTX

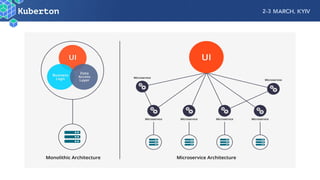


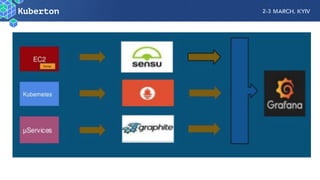
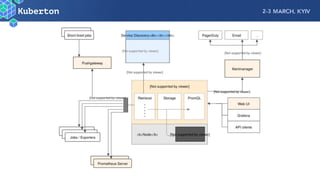
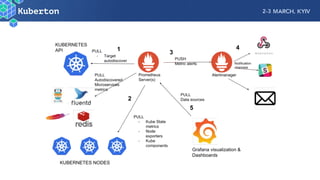


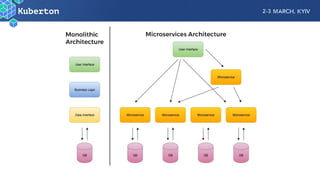
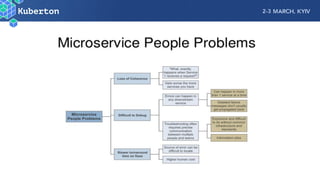
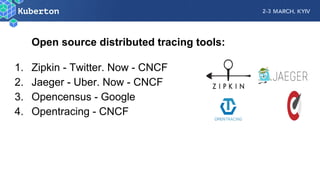


Microservices add complexity to monitoring that was not present with monolithic architectures. While microservices provide benefits, they also introduce significant monitoring challenges around communication between services. Prometheus has emerged as a powerful open source solution for monitoring microservices as it was designed to address issues of scale and flexibility that monitoring microservices requires.


![[2015-11월 정기 세미나] Cloud Native Platform - Pivotal](https://cdn.slidesharecdn.com/ss_thumbnails/openstack-usergroups-26th-nov-2015-151201151958-lva1-app6891-thumbnail.jpg?width=640&height=640&fit=bounds)
![[OpenStack Day in Korea 2015] Track 3-1 - OpenStack Storage Infrastructure & ...](https://cdn.slidesharecdn.com/ss_thumbnails/31-150213065505-conversion-gate01-thumbnail.jpg?width=640&height=640&fit=bounds)
![[OpenStack Days Korea 2016] Track1 - Red Hat enterprise Linux OpenStack Platform](https://cdn.slidesharecdn.com/ss_thumbnails/13redhat-160226171603-thumbnail.jpg?width=640&height=640&fit=bounds)
![[OpenStack Day in Korea 2015] Track 1-6 - 갈라파고스의 이구아나, 인프라에 오픈소스를 올리다. 그래서 보이...](https://cdn.slidesharecdn.com/ss_thumbnails/16-150213044916-conversion-gate02-thumbnail.jpg?width=640&height=640&fit=bounds)


![[OpenStack 하반기 스터디] Interoperability with ML2: LinuxBridge, OVS and SDN](https://cdn.slidesharecdn.com/ss_thumbnails/openstackteam5interoperabilitywithml2-151221120433-thumbnail.jpg?width=640&height=640&fit=bounds)