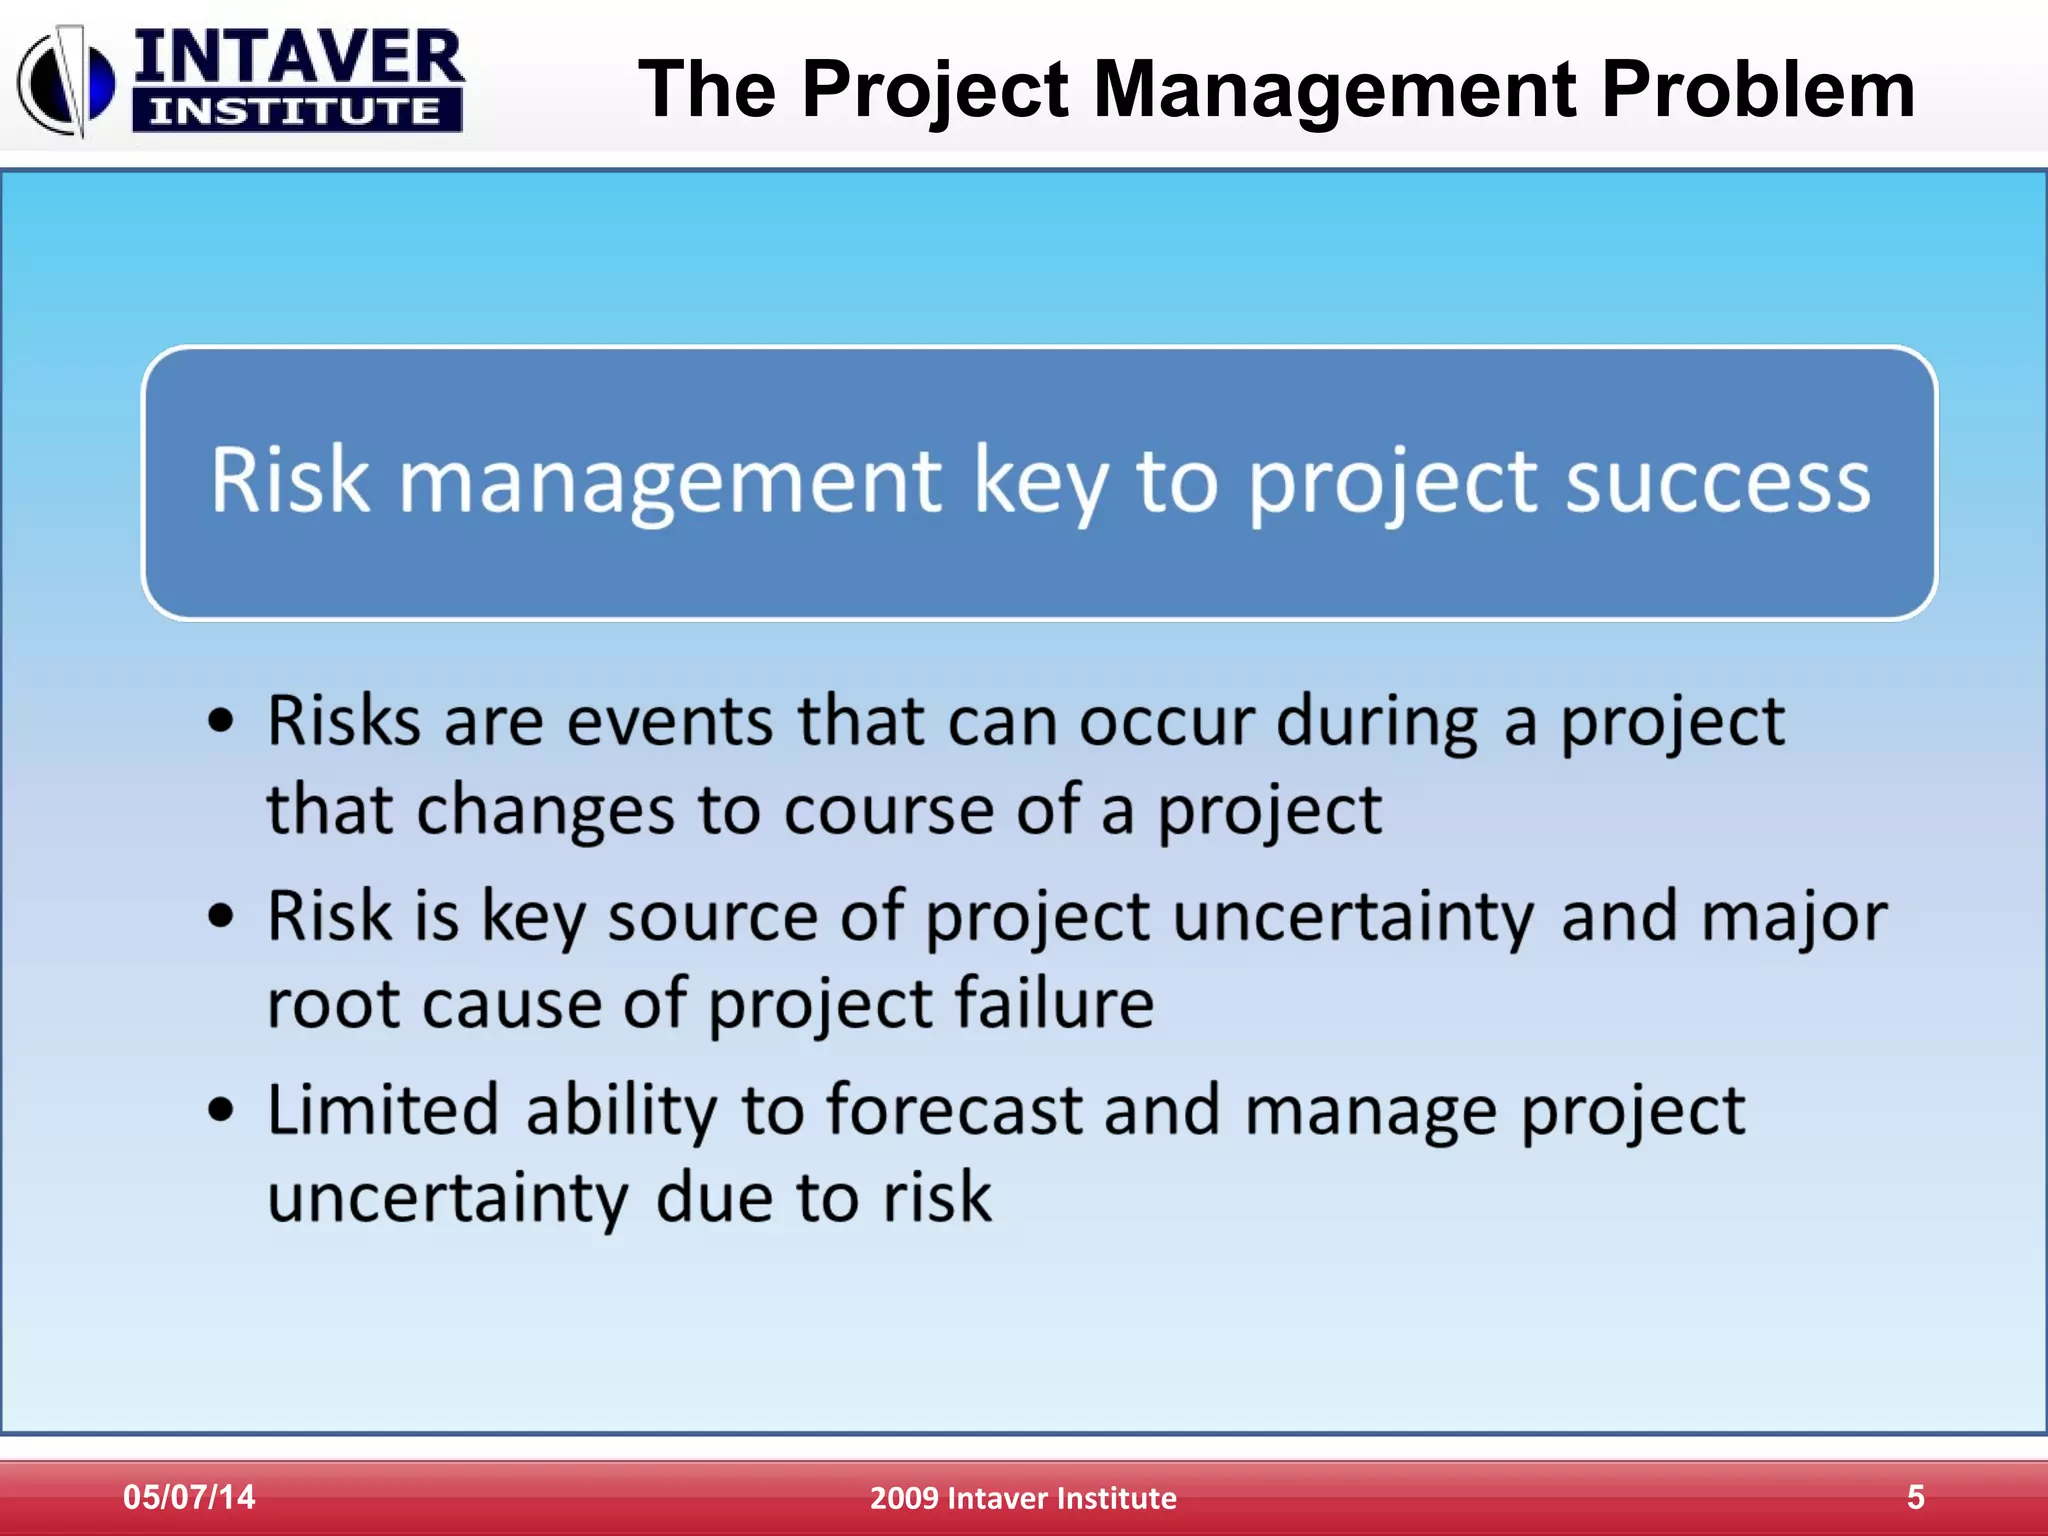
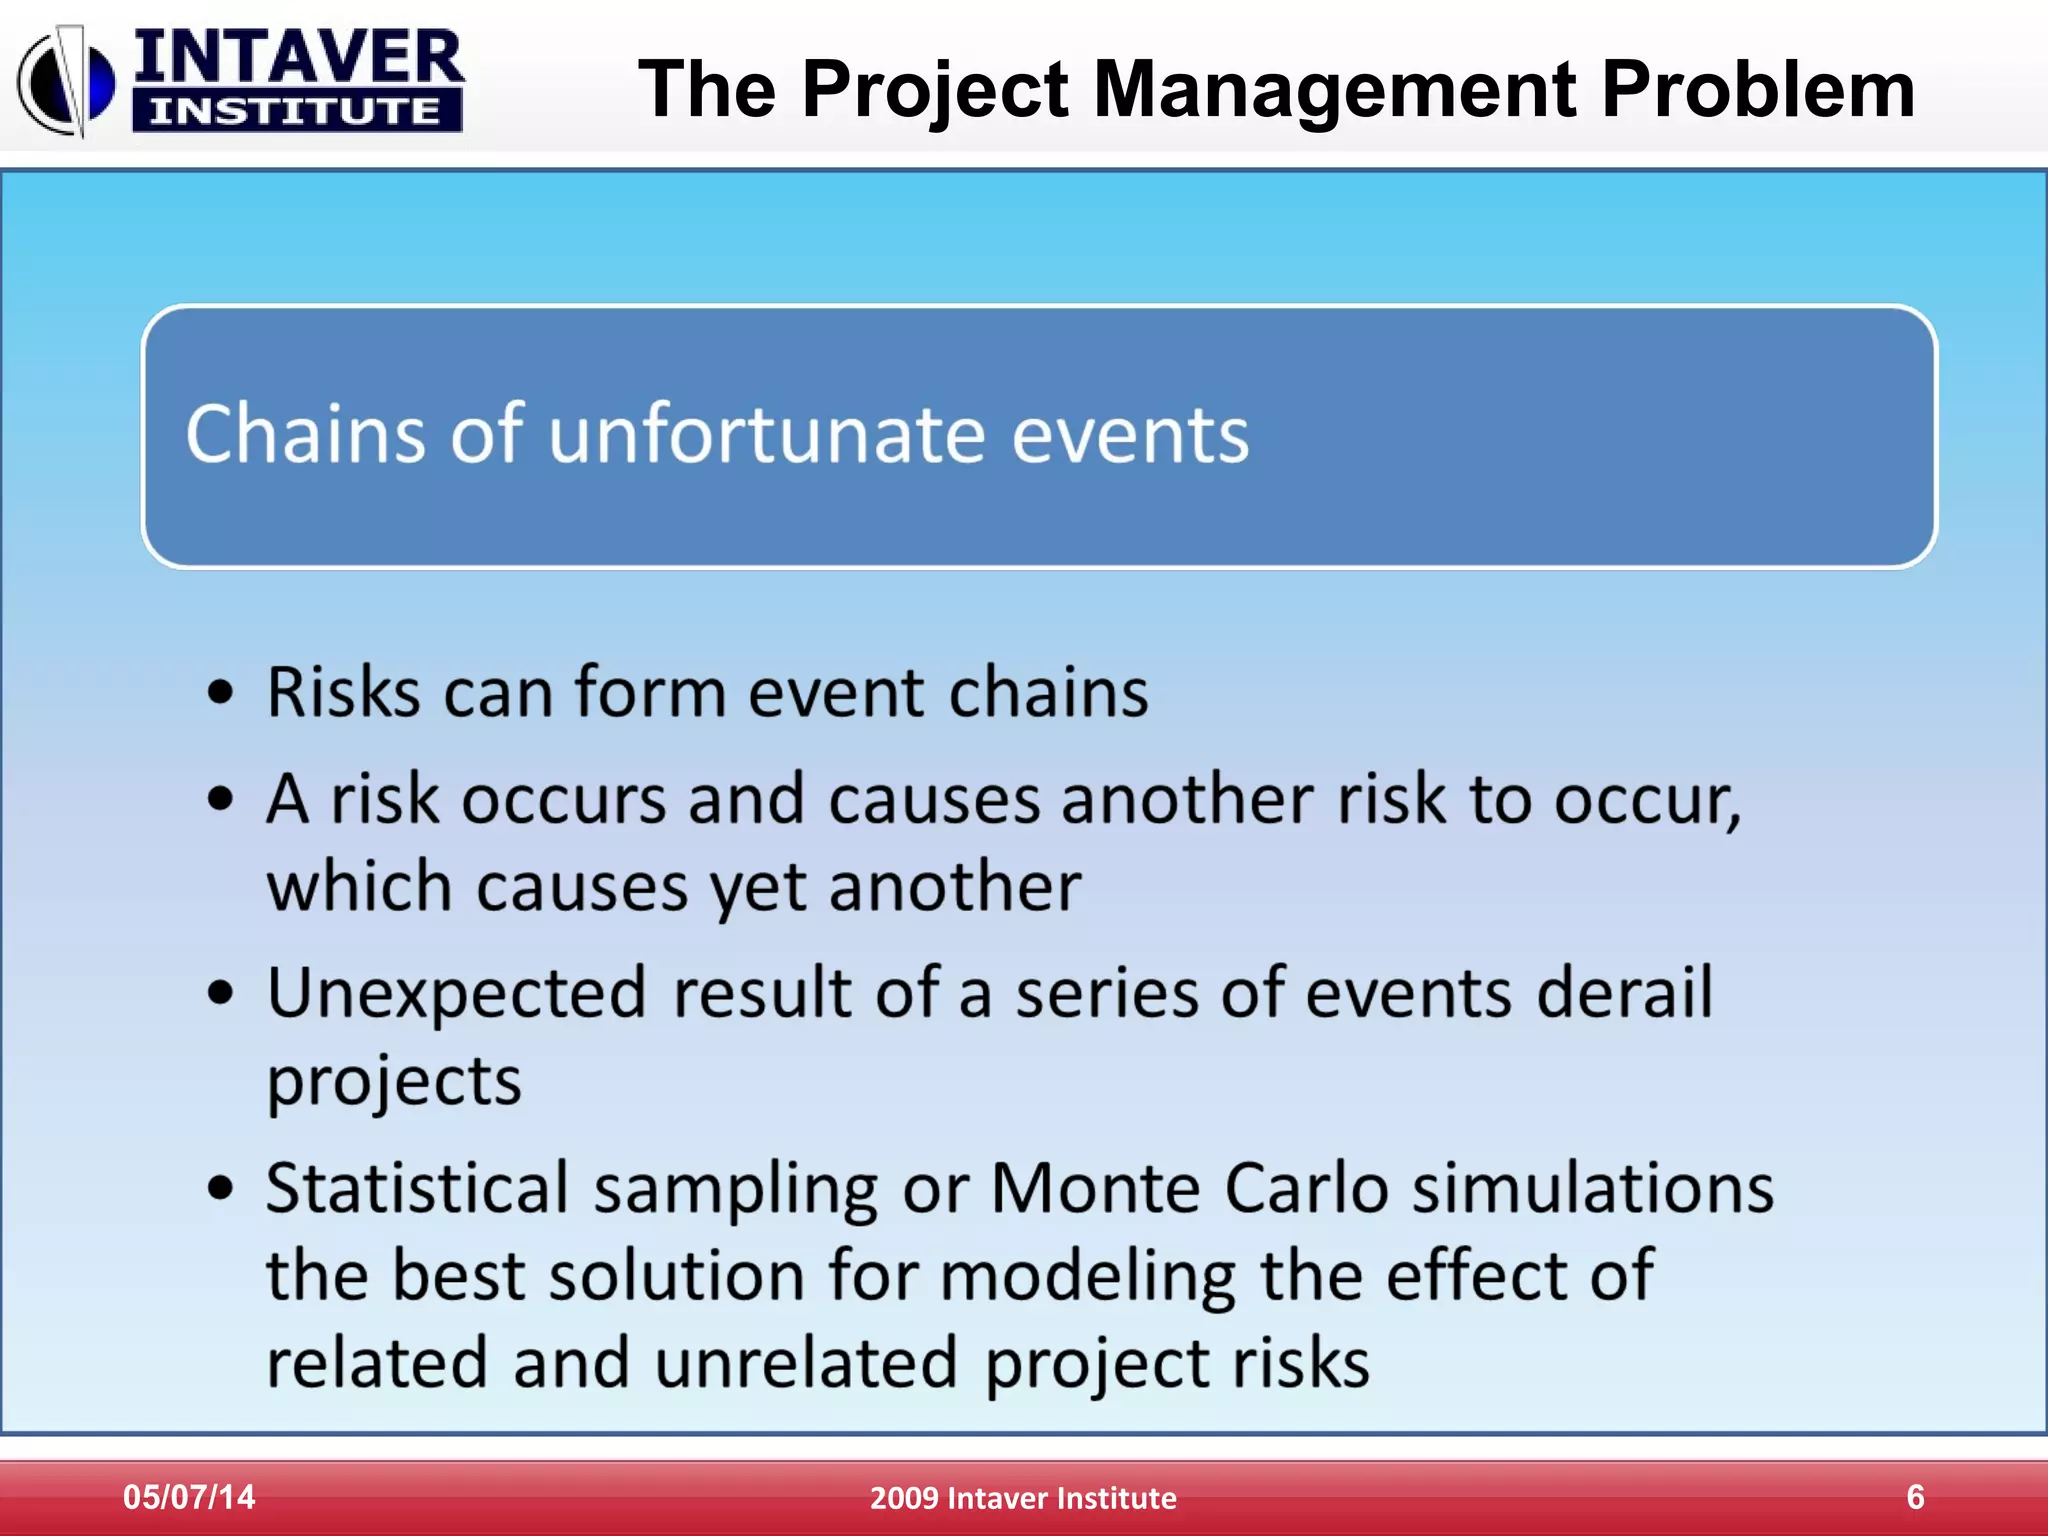
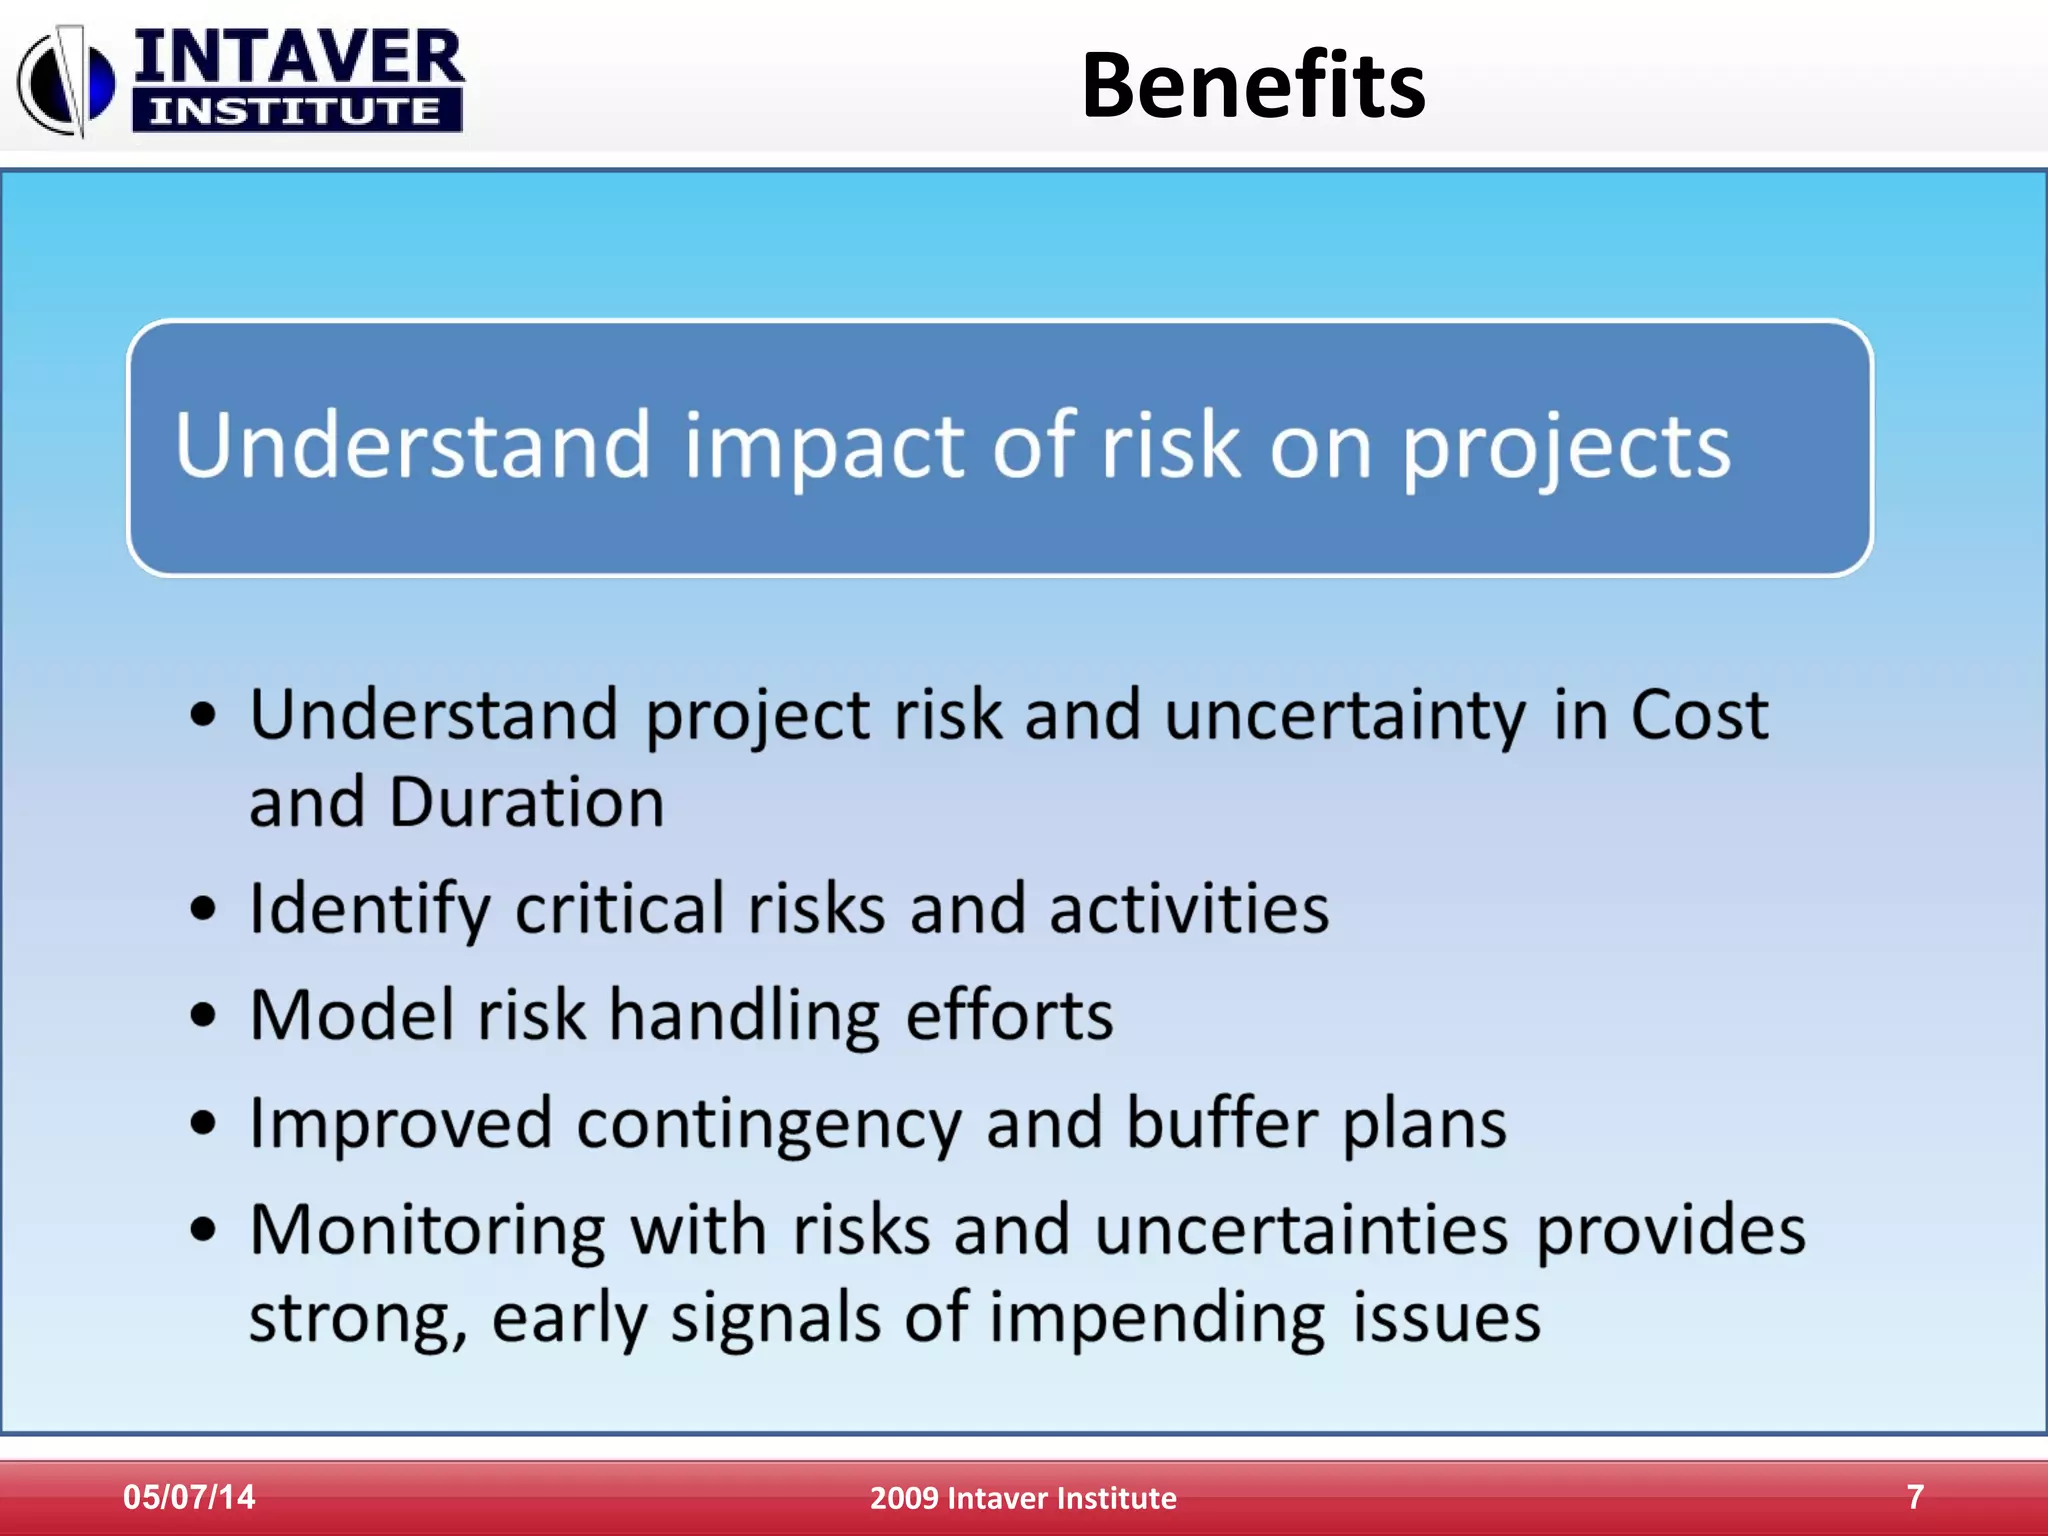
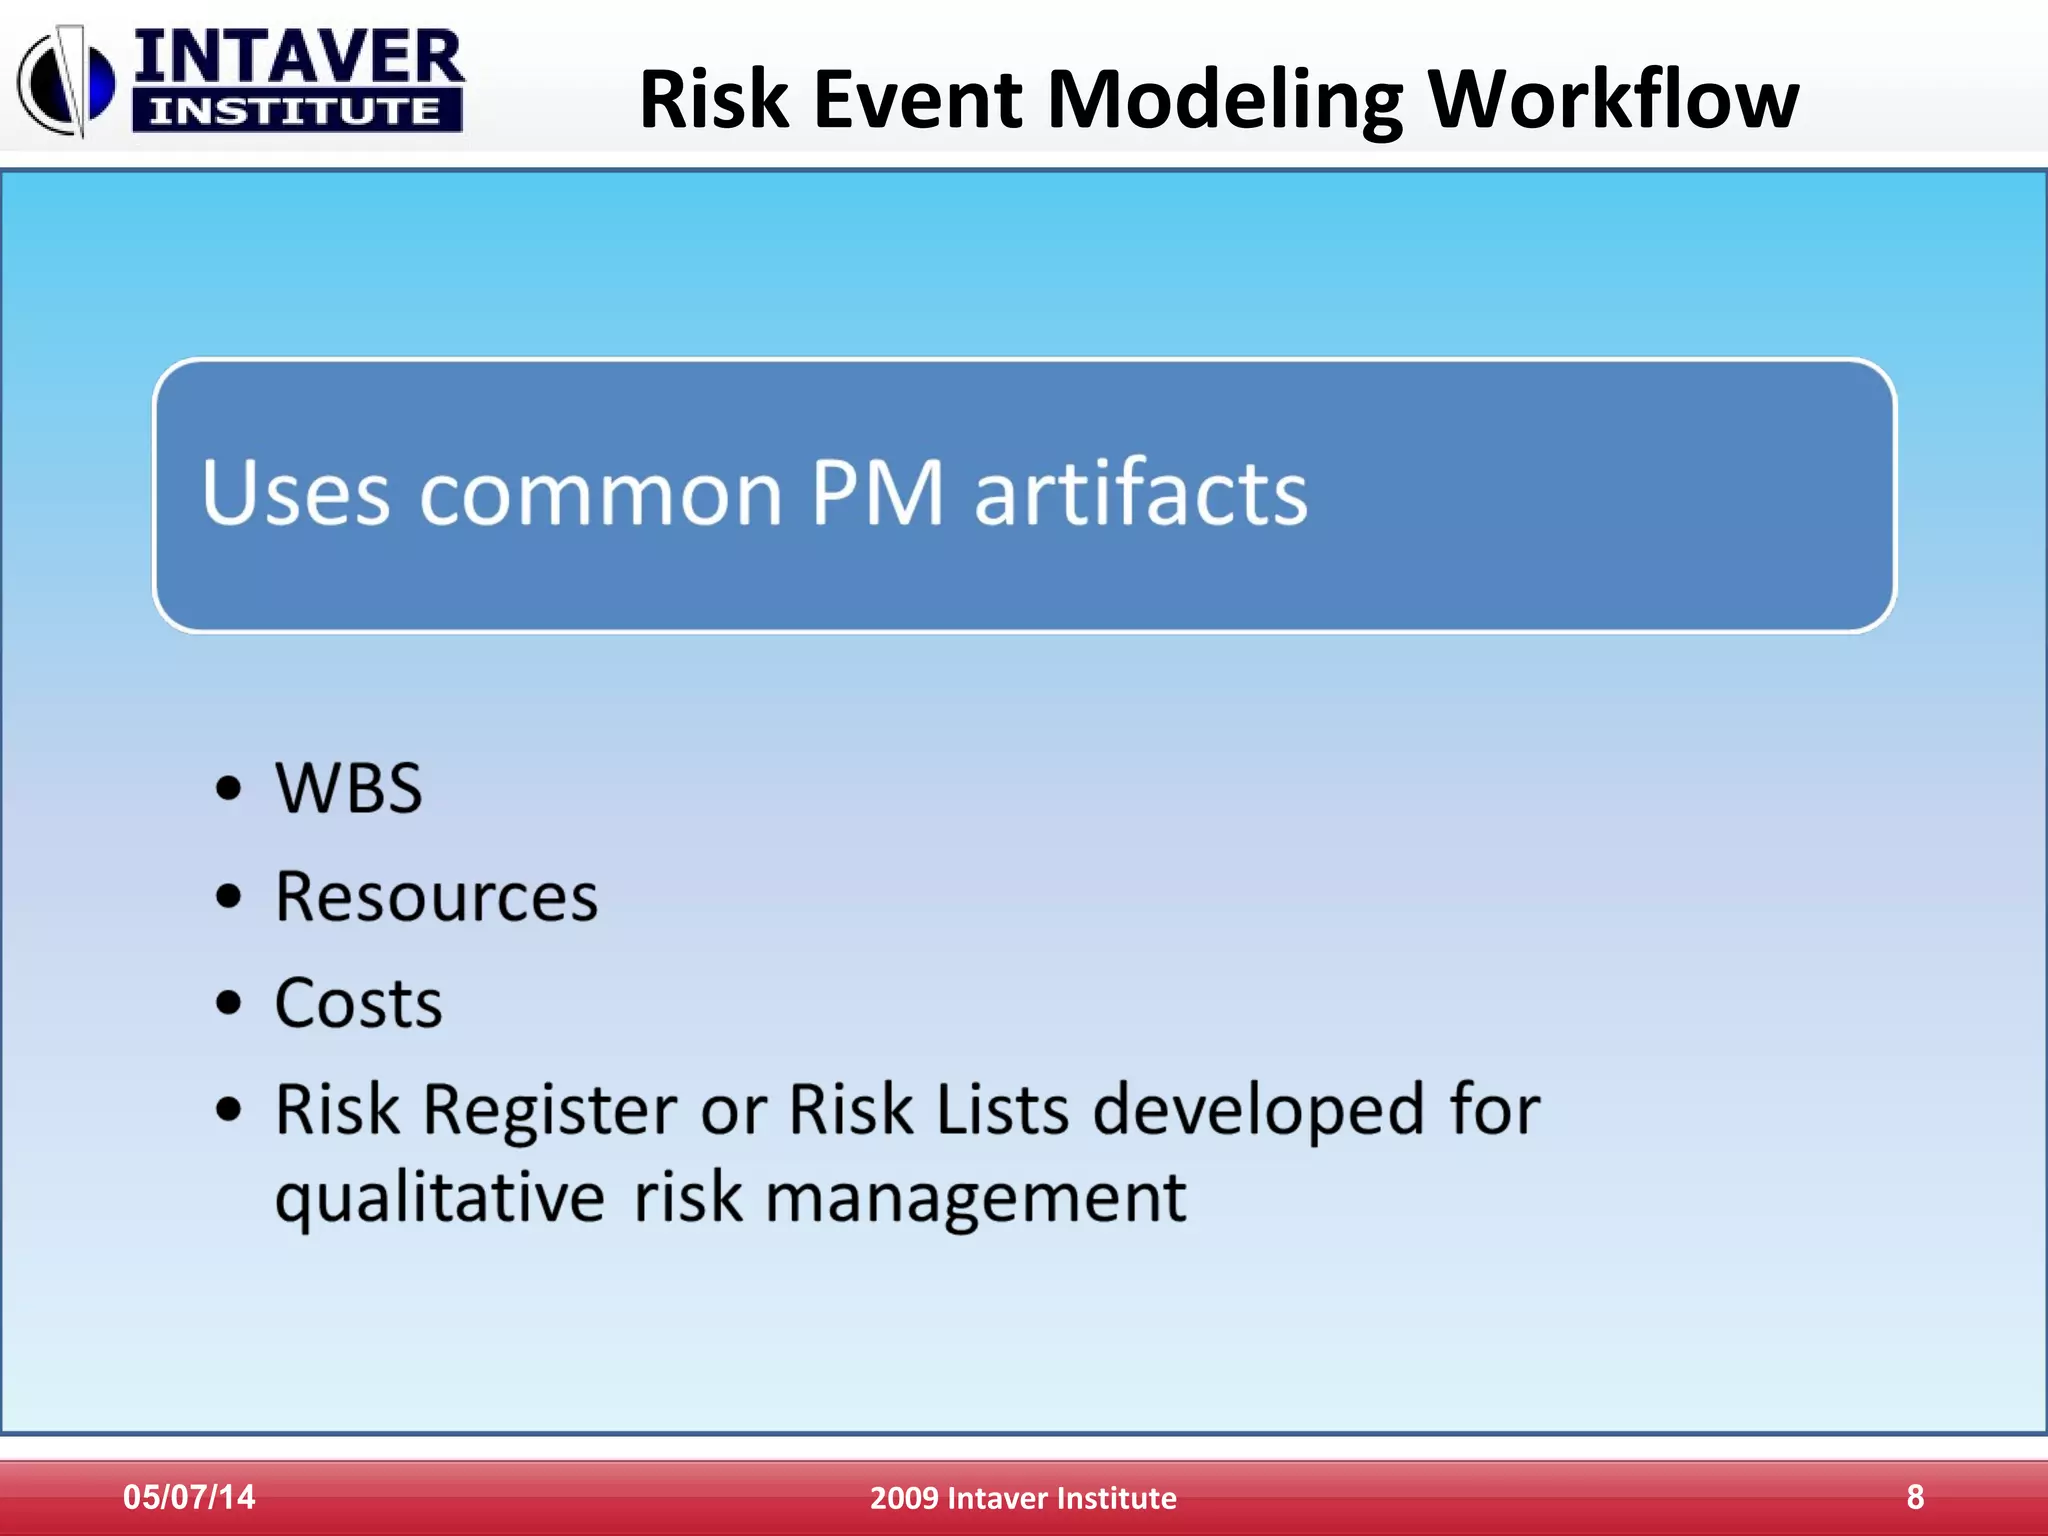
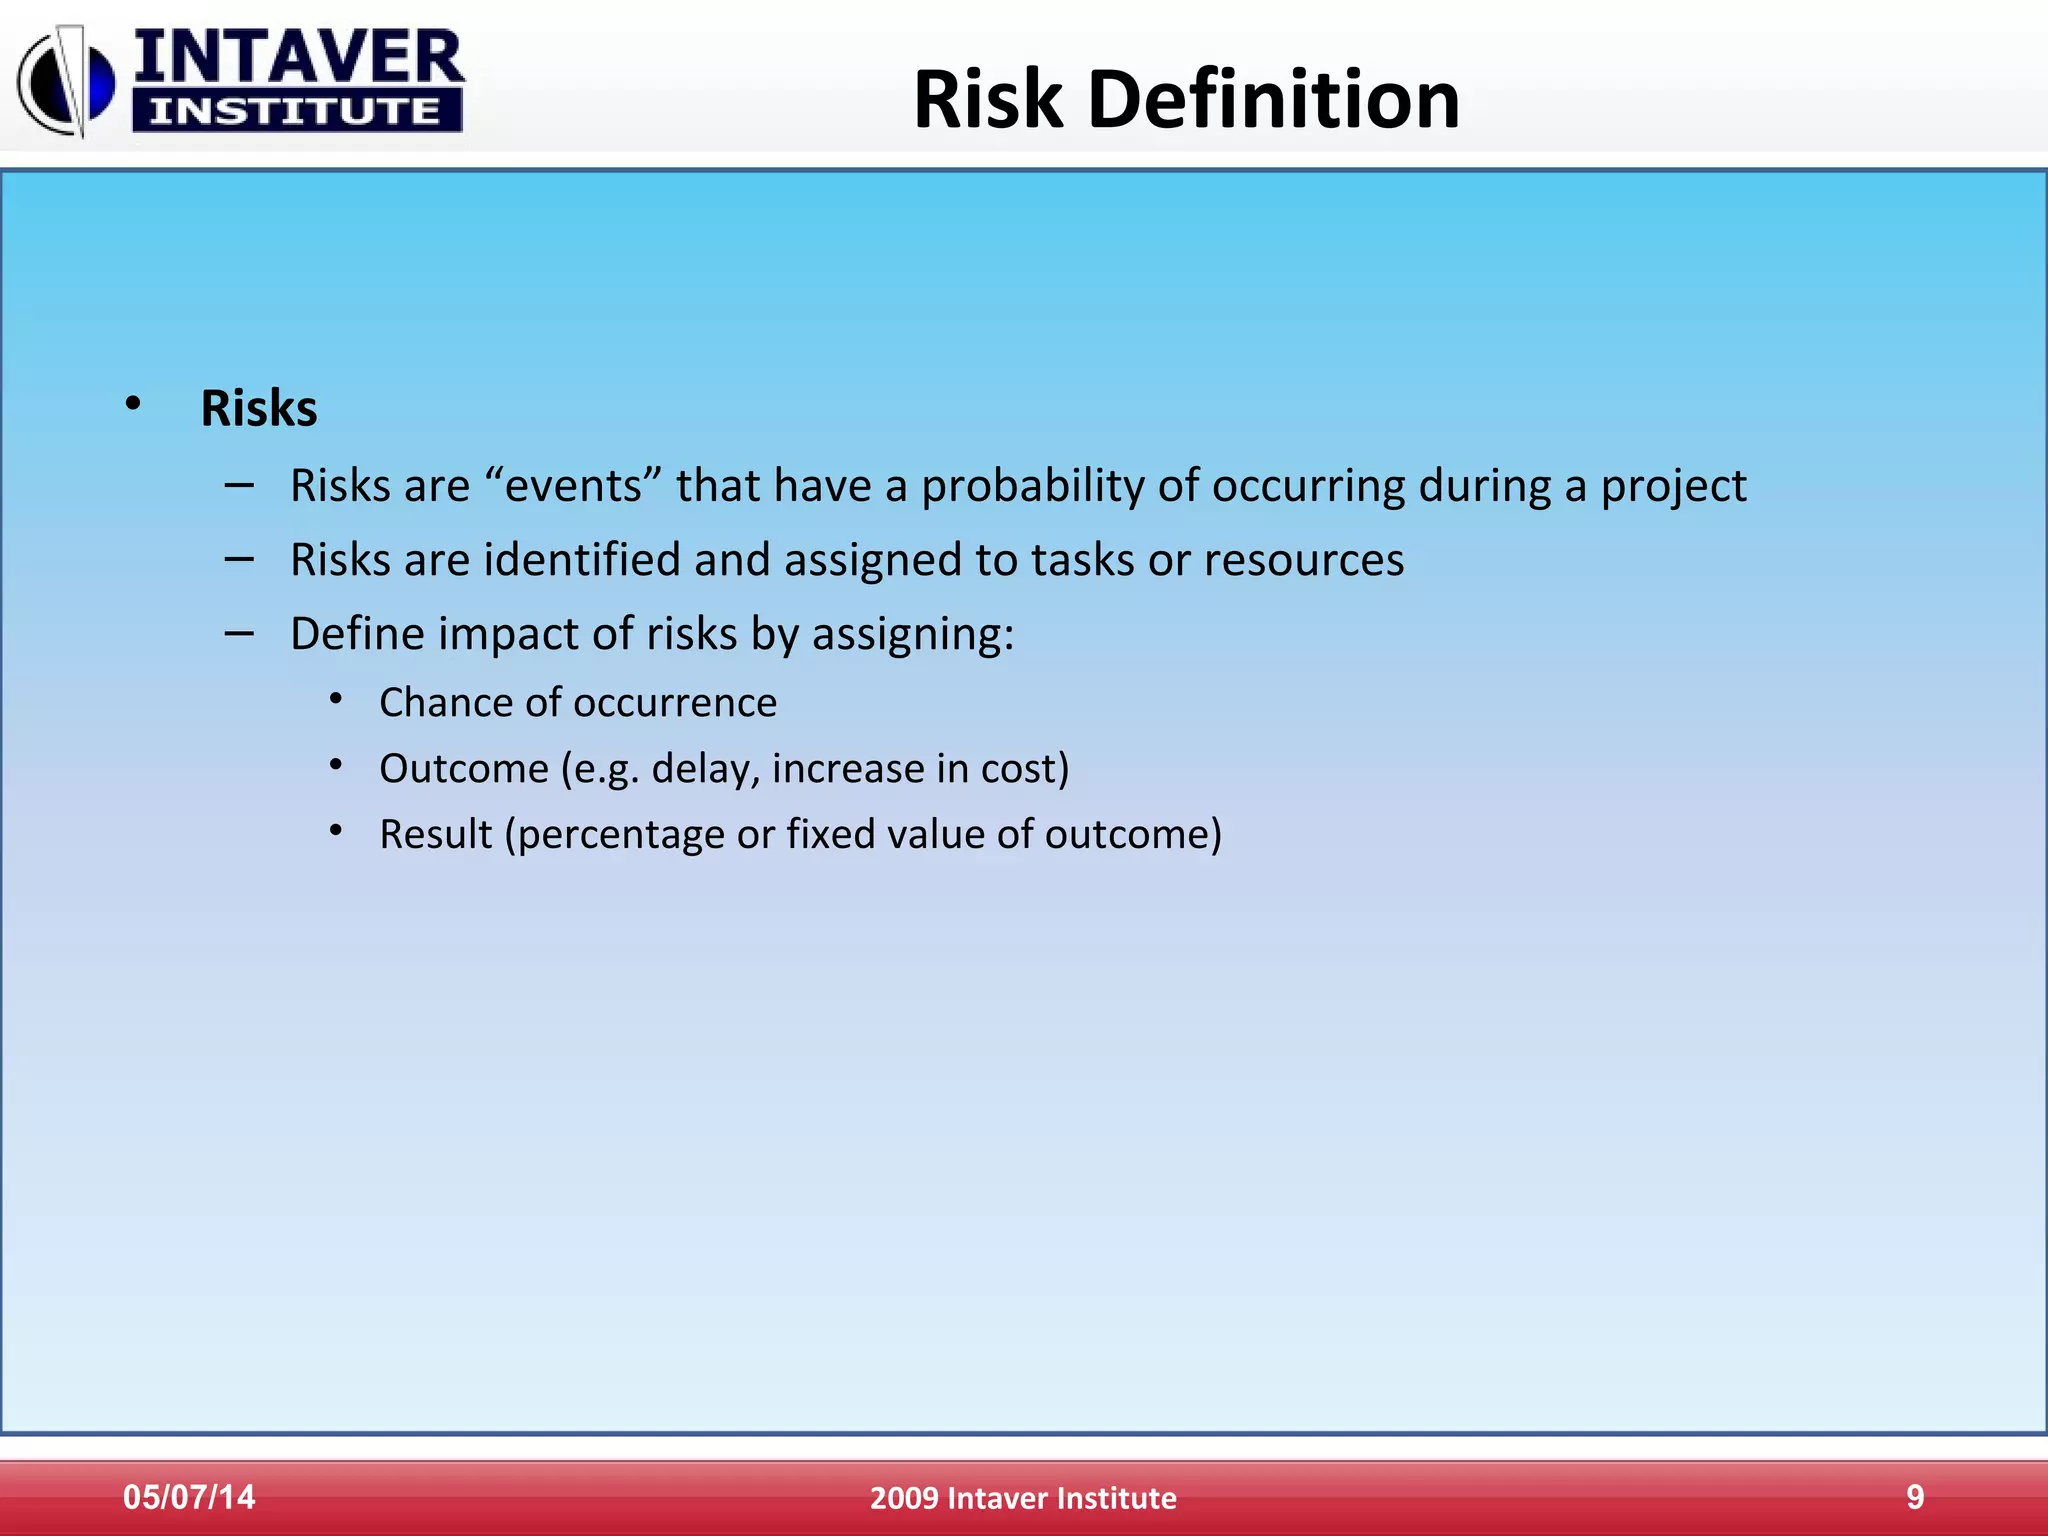
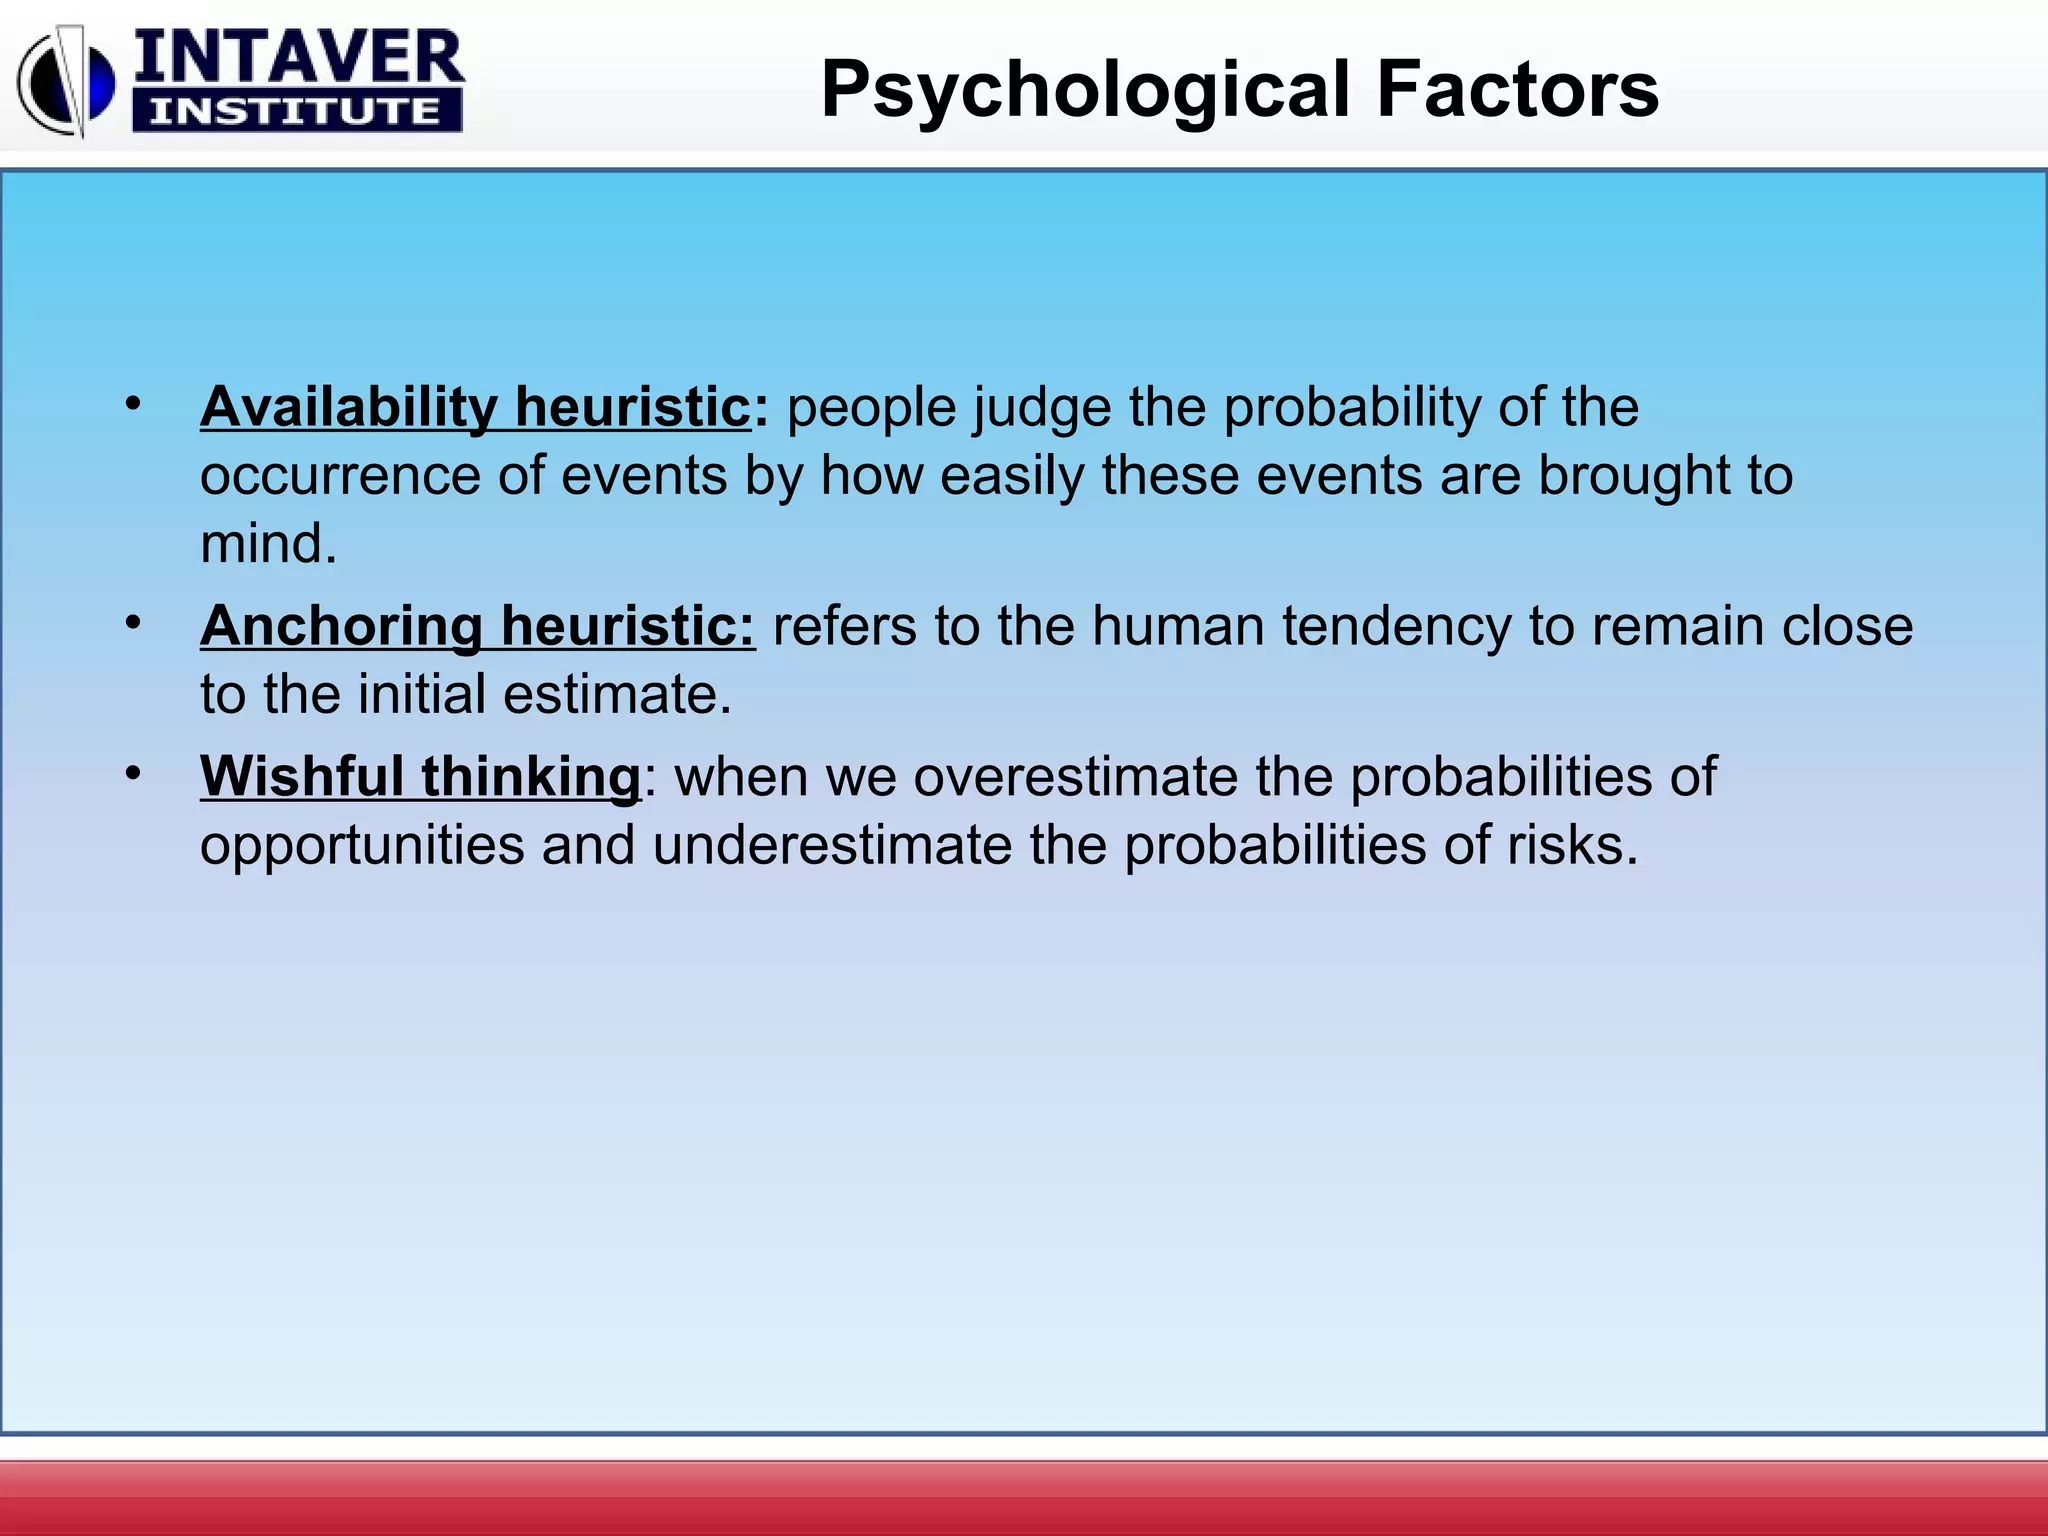
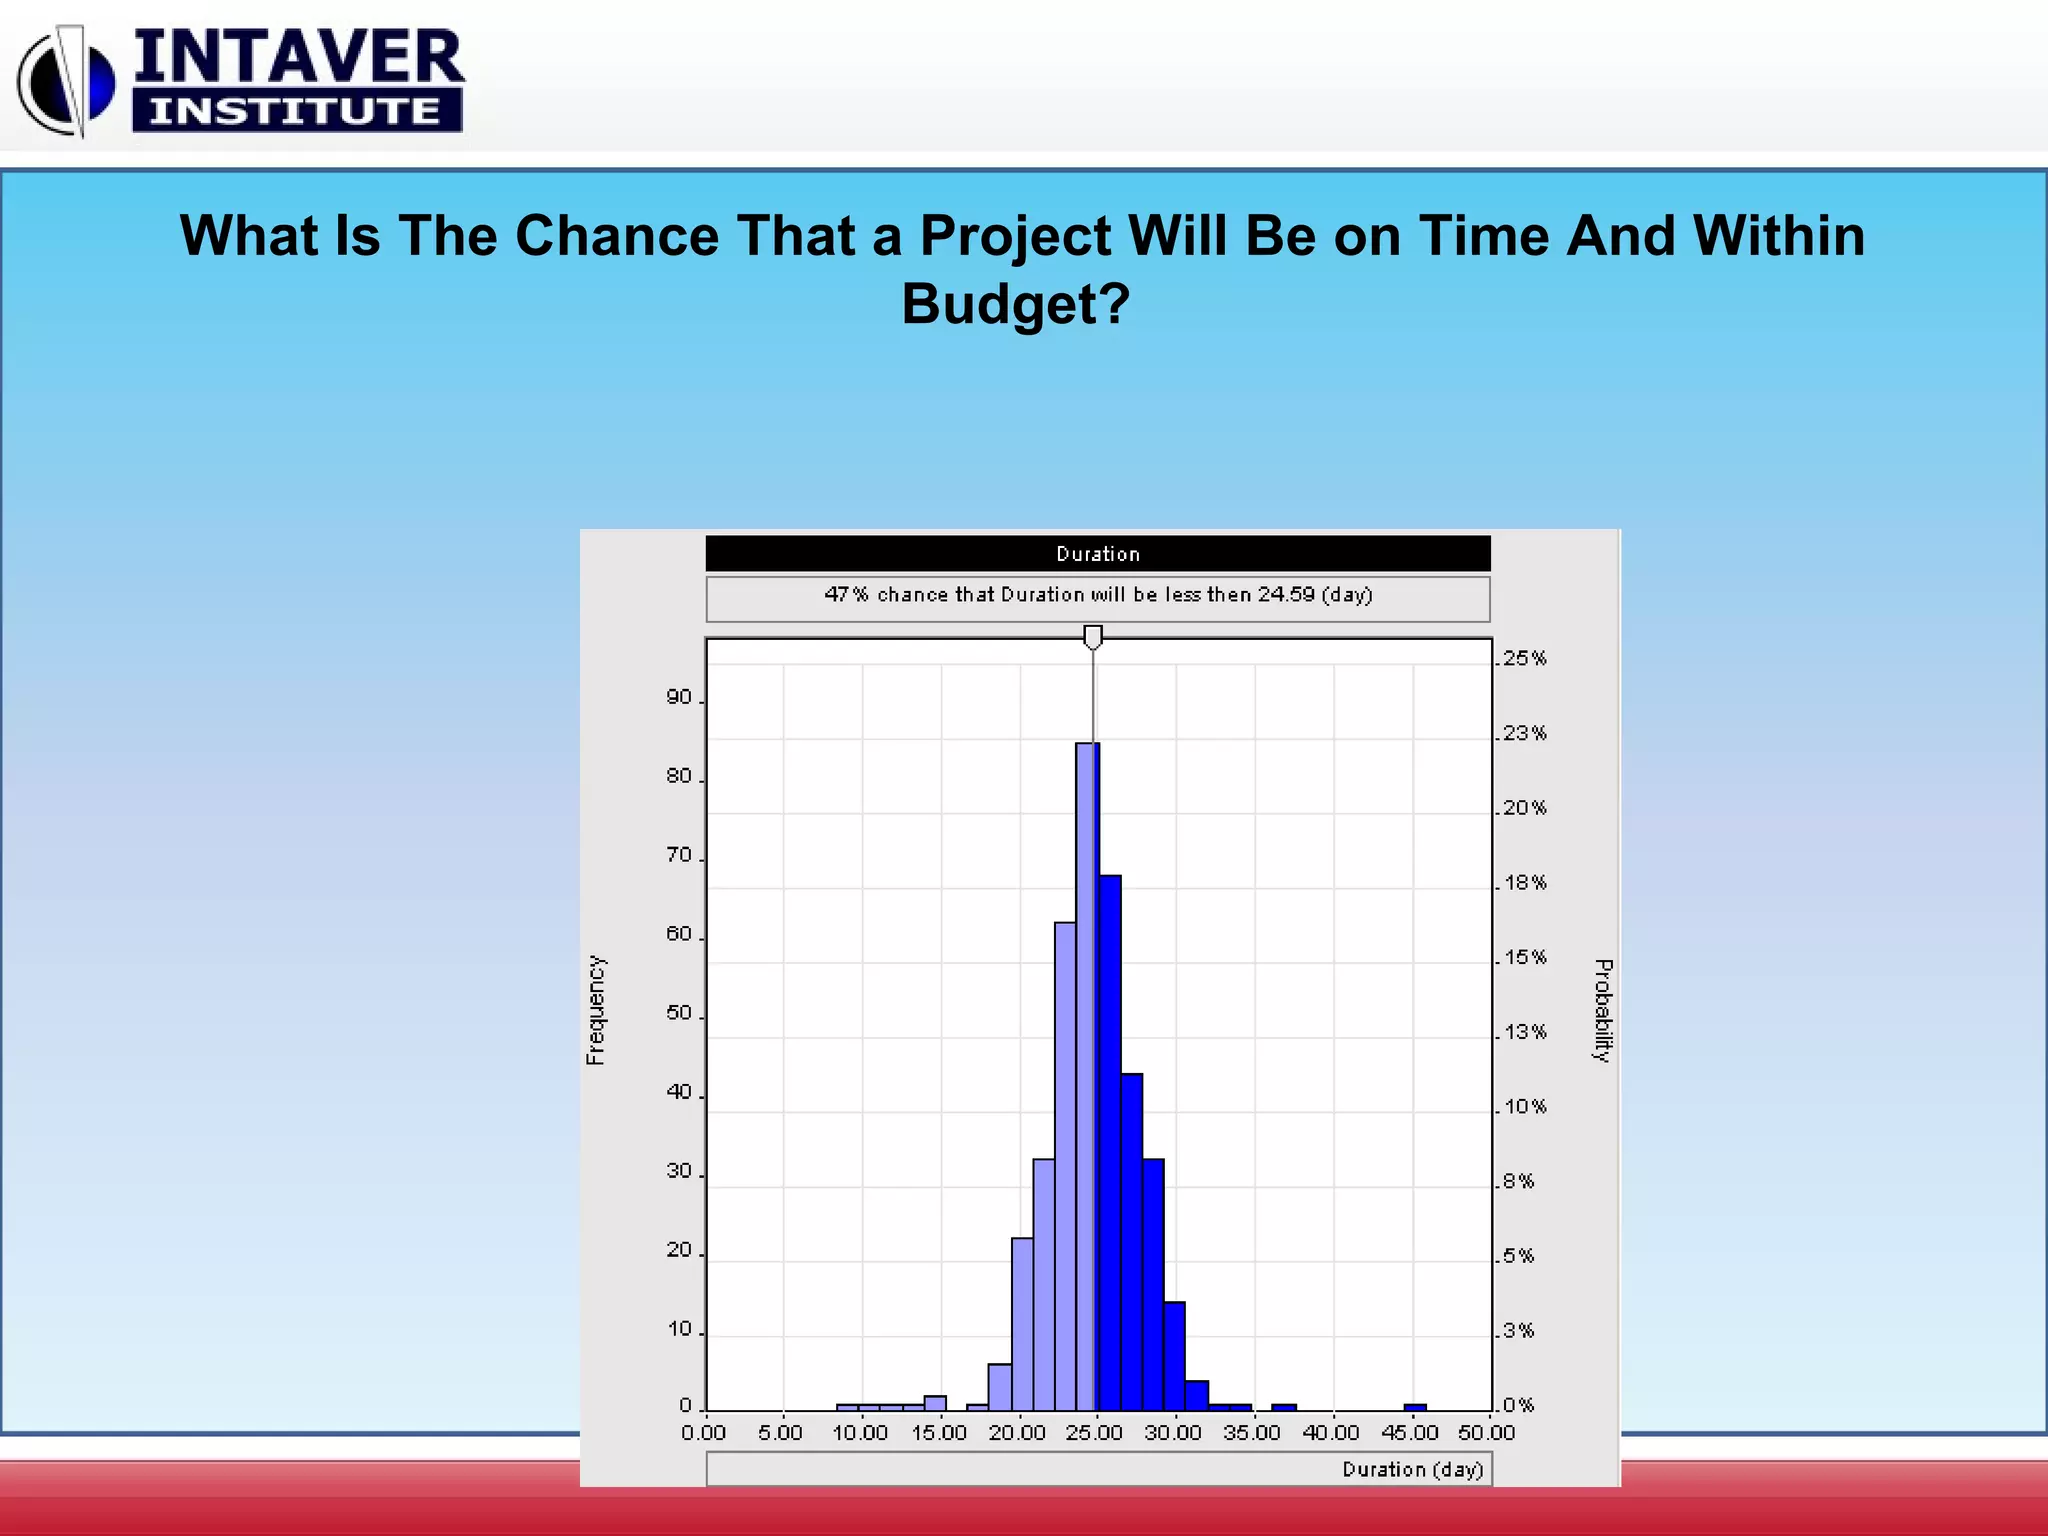
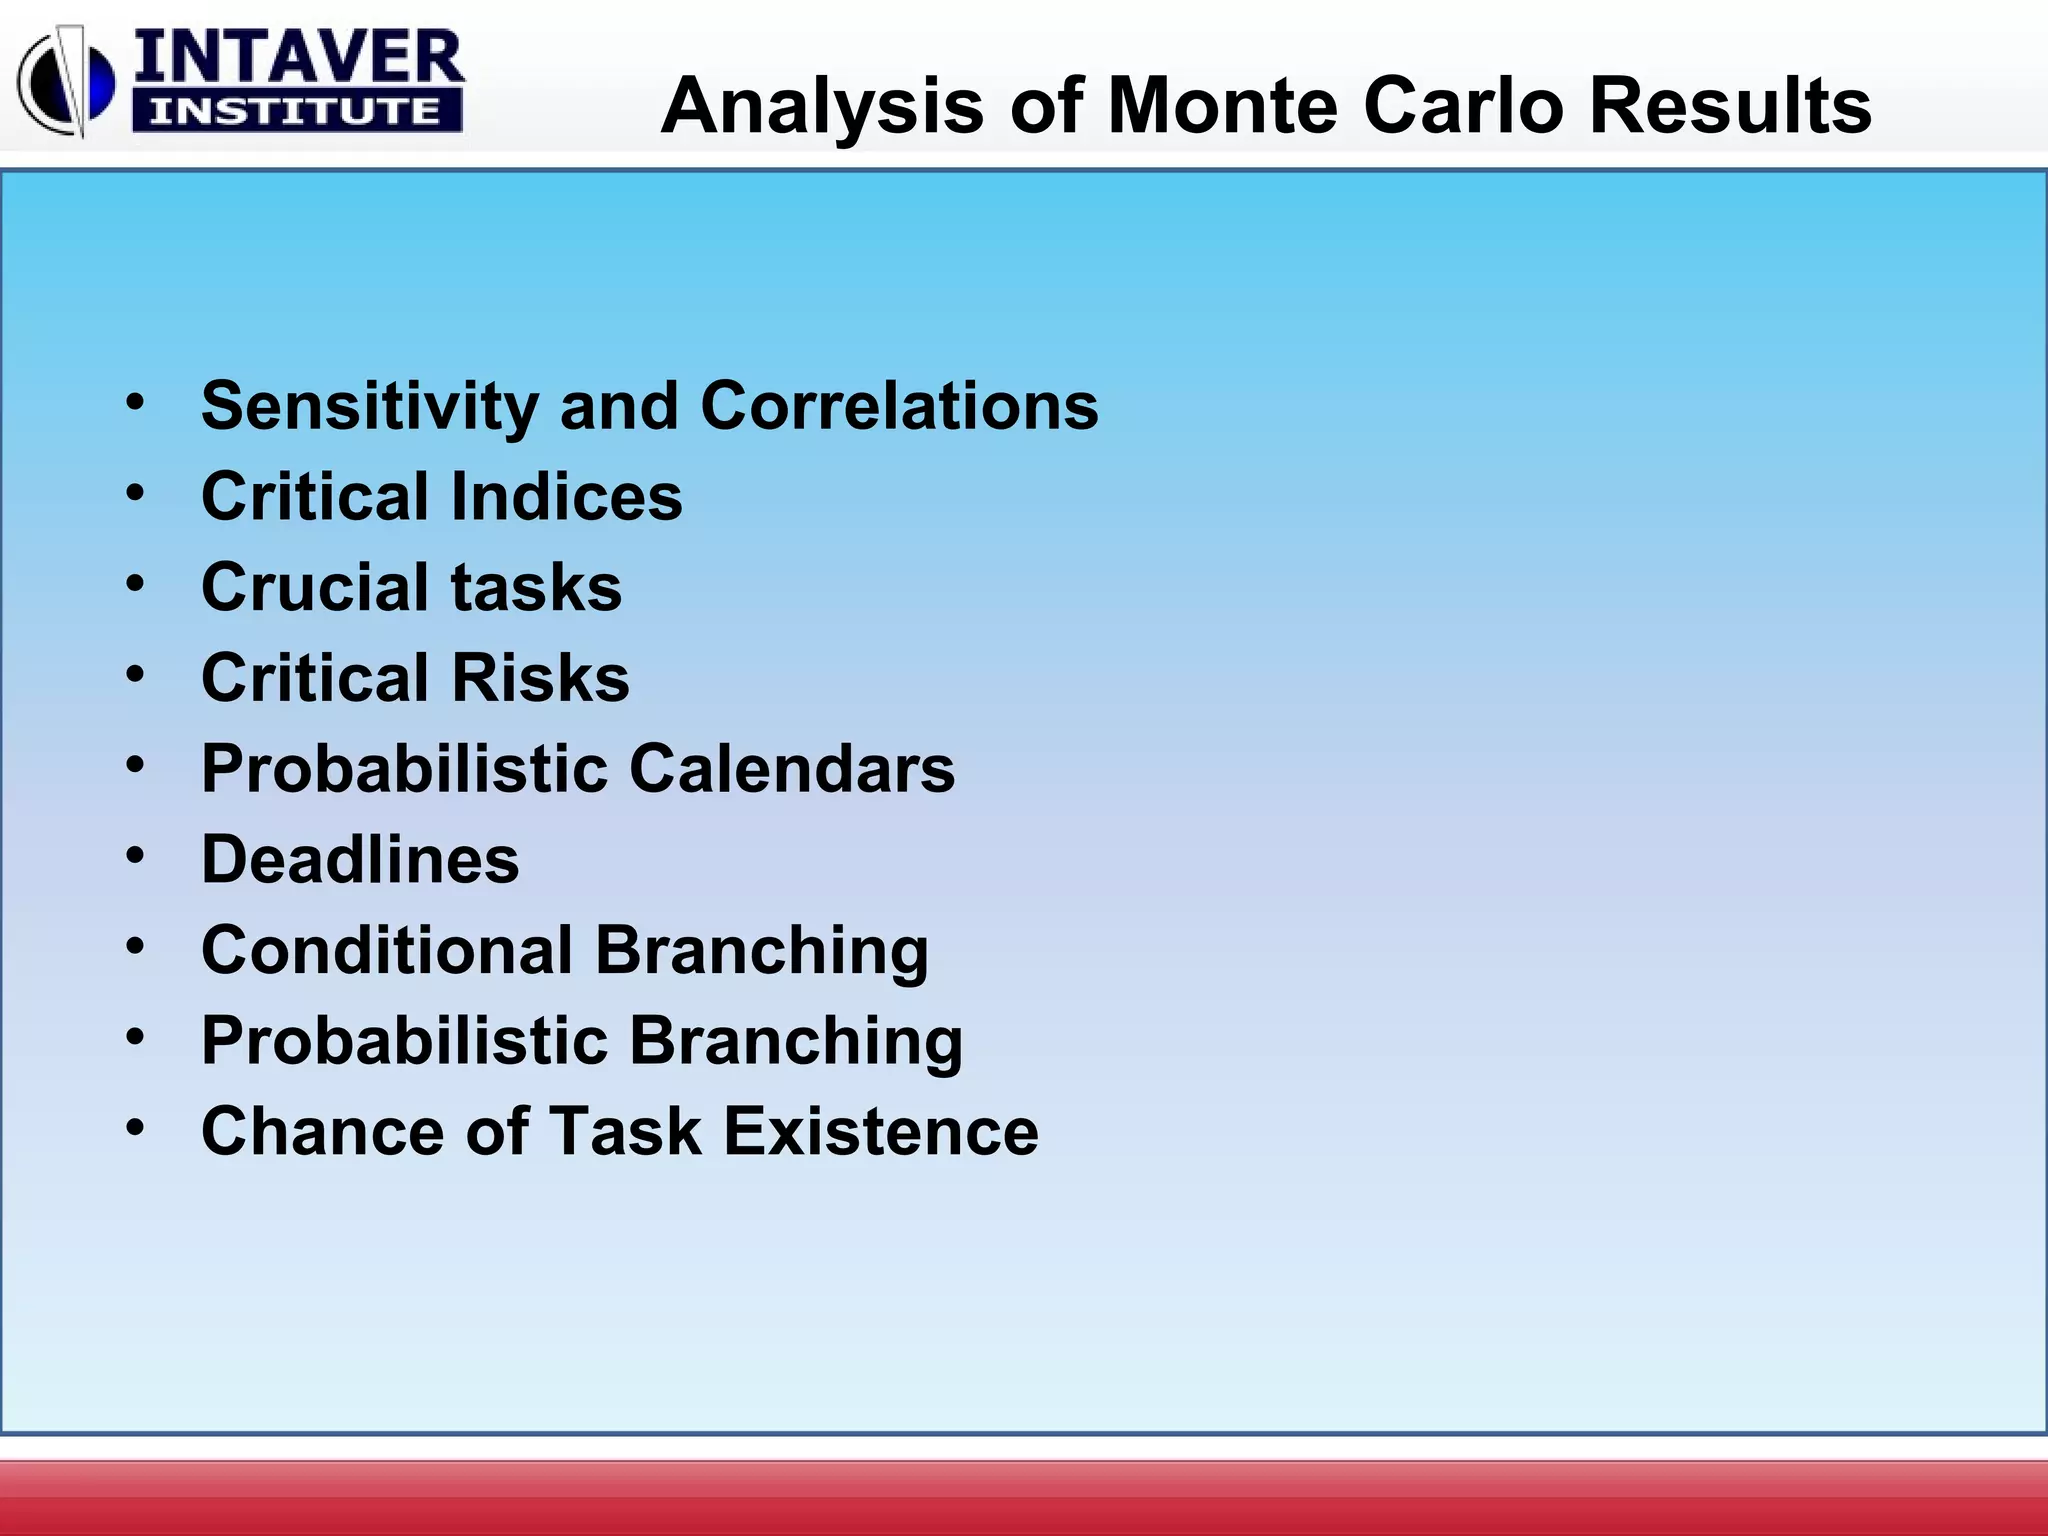
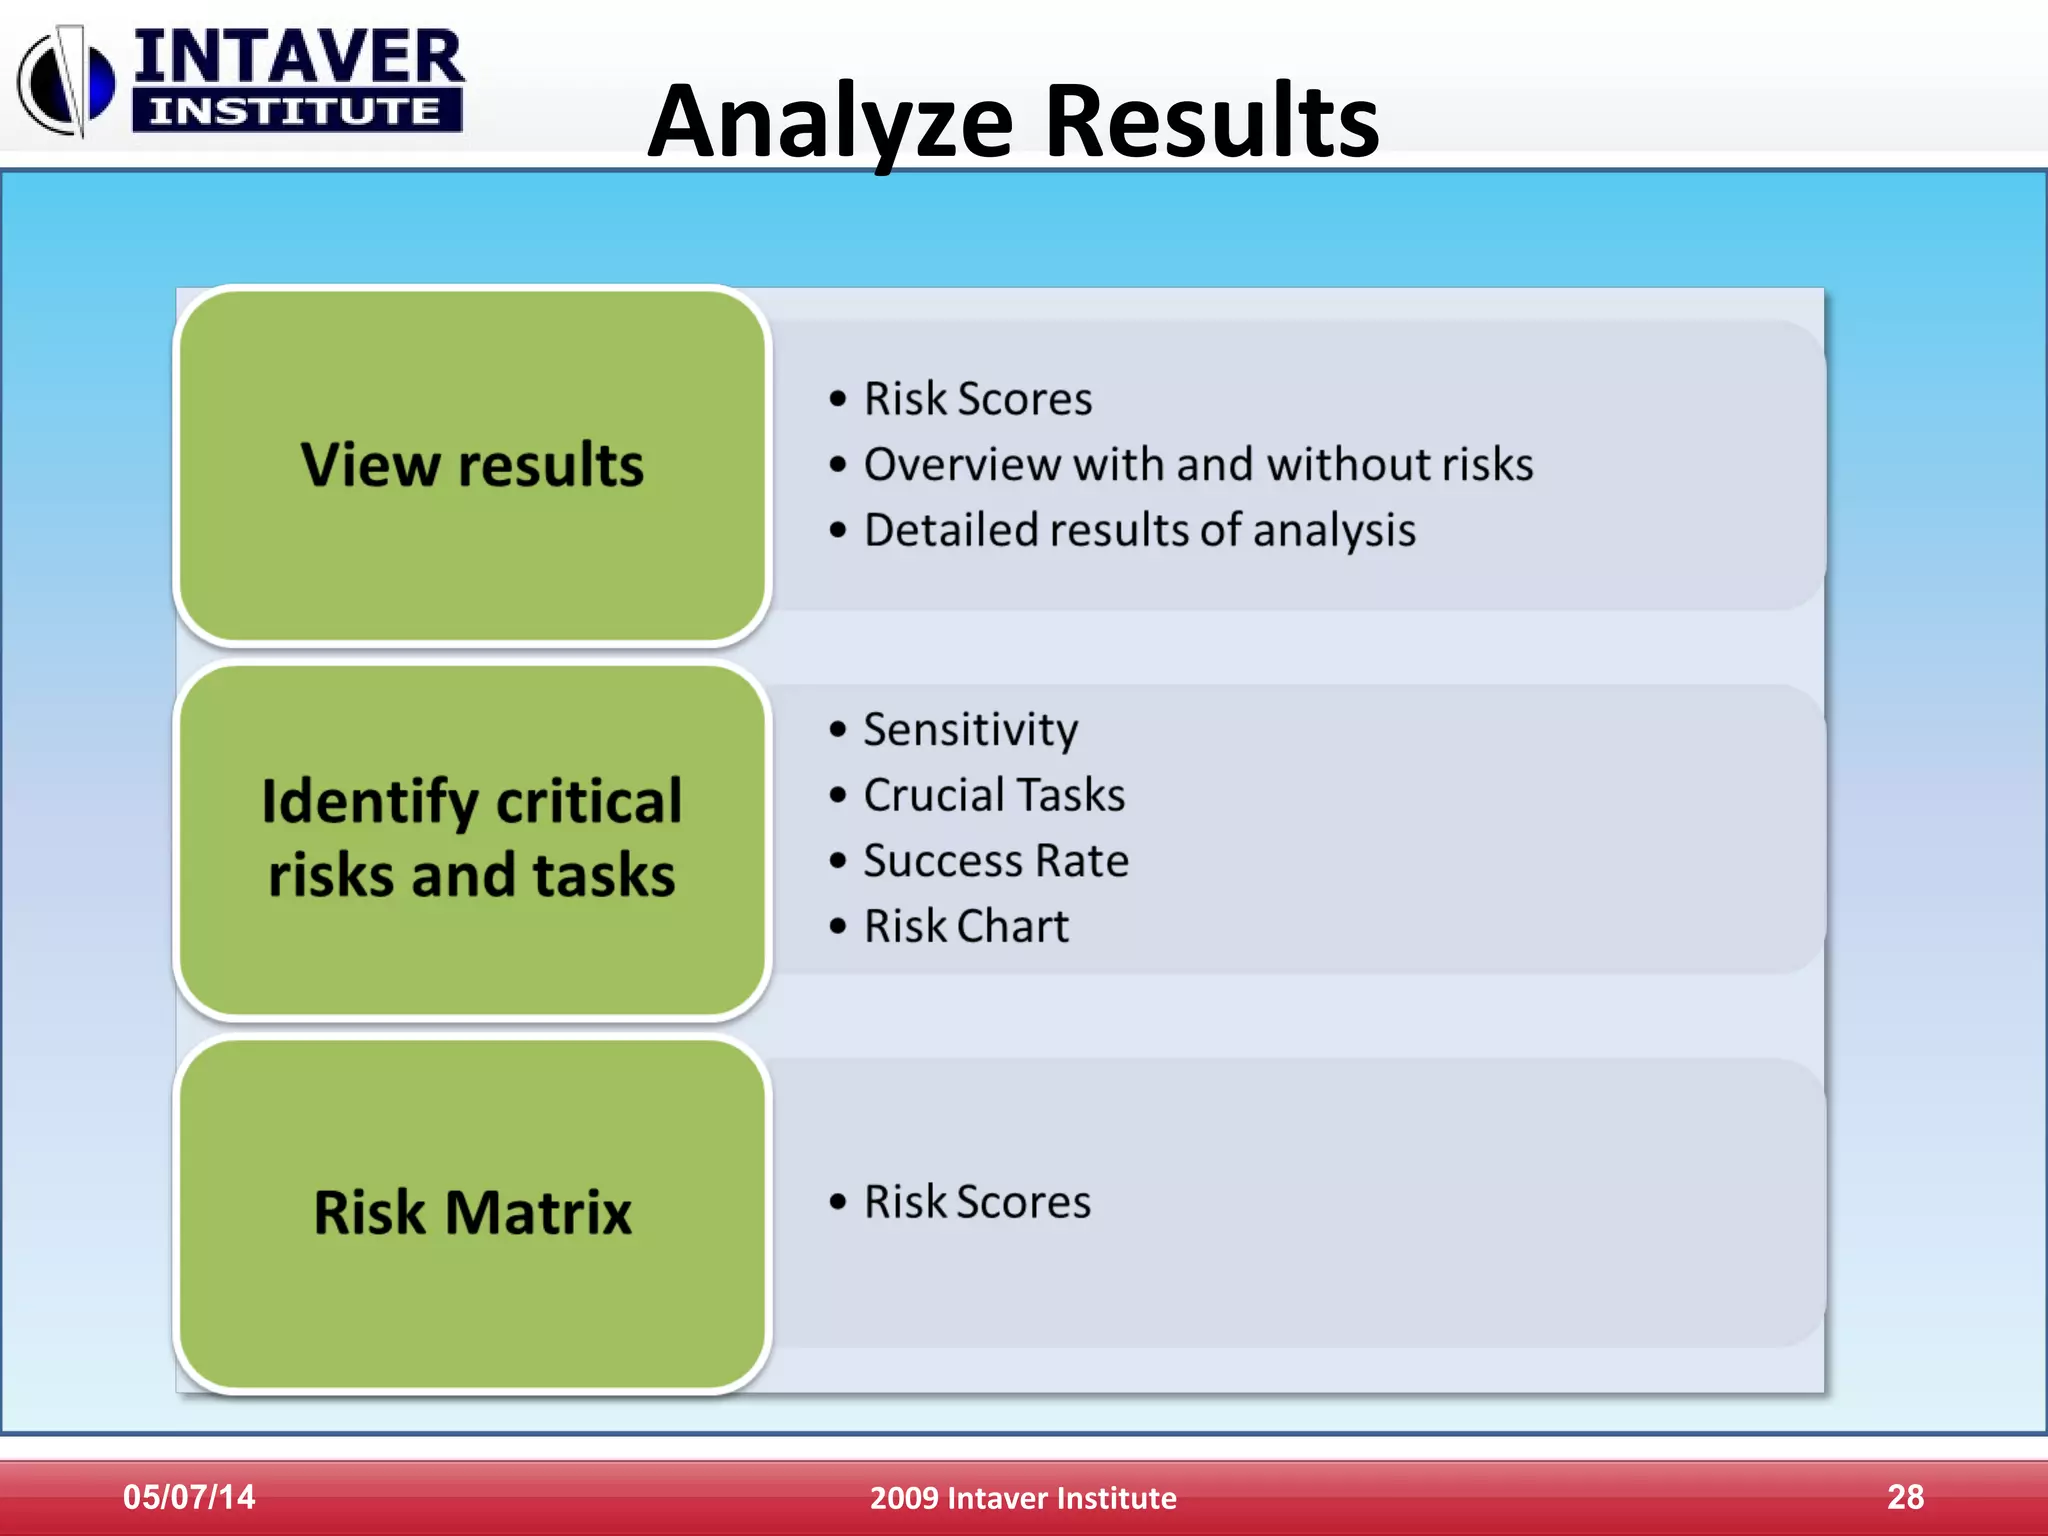
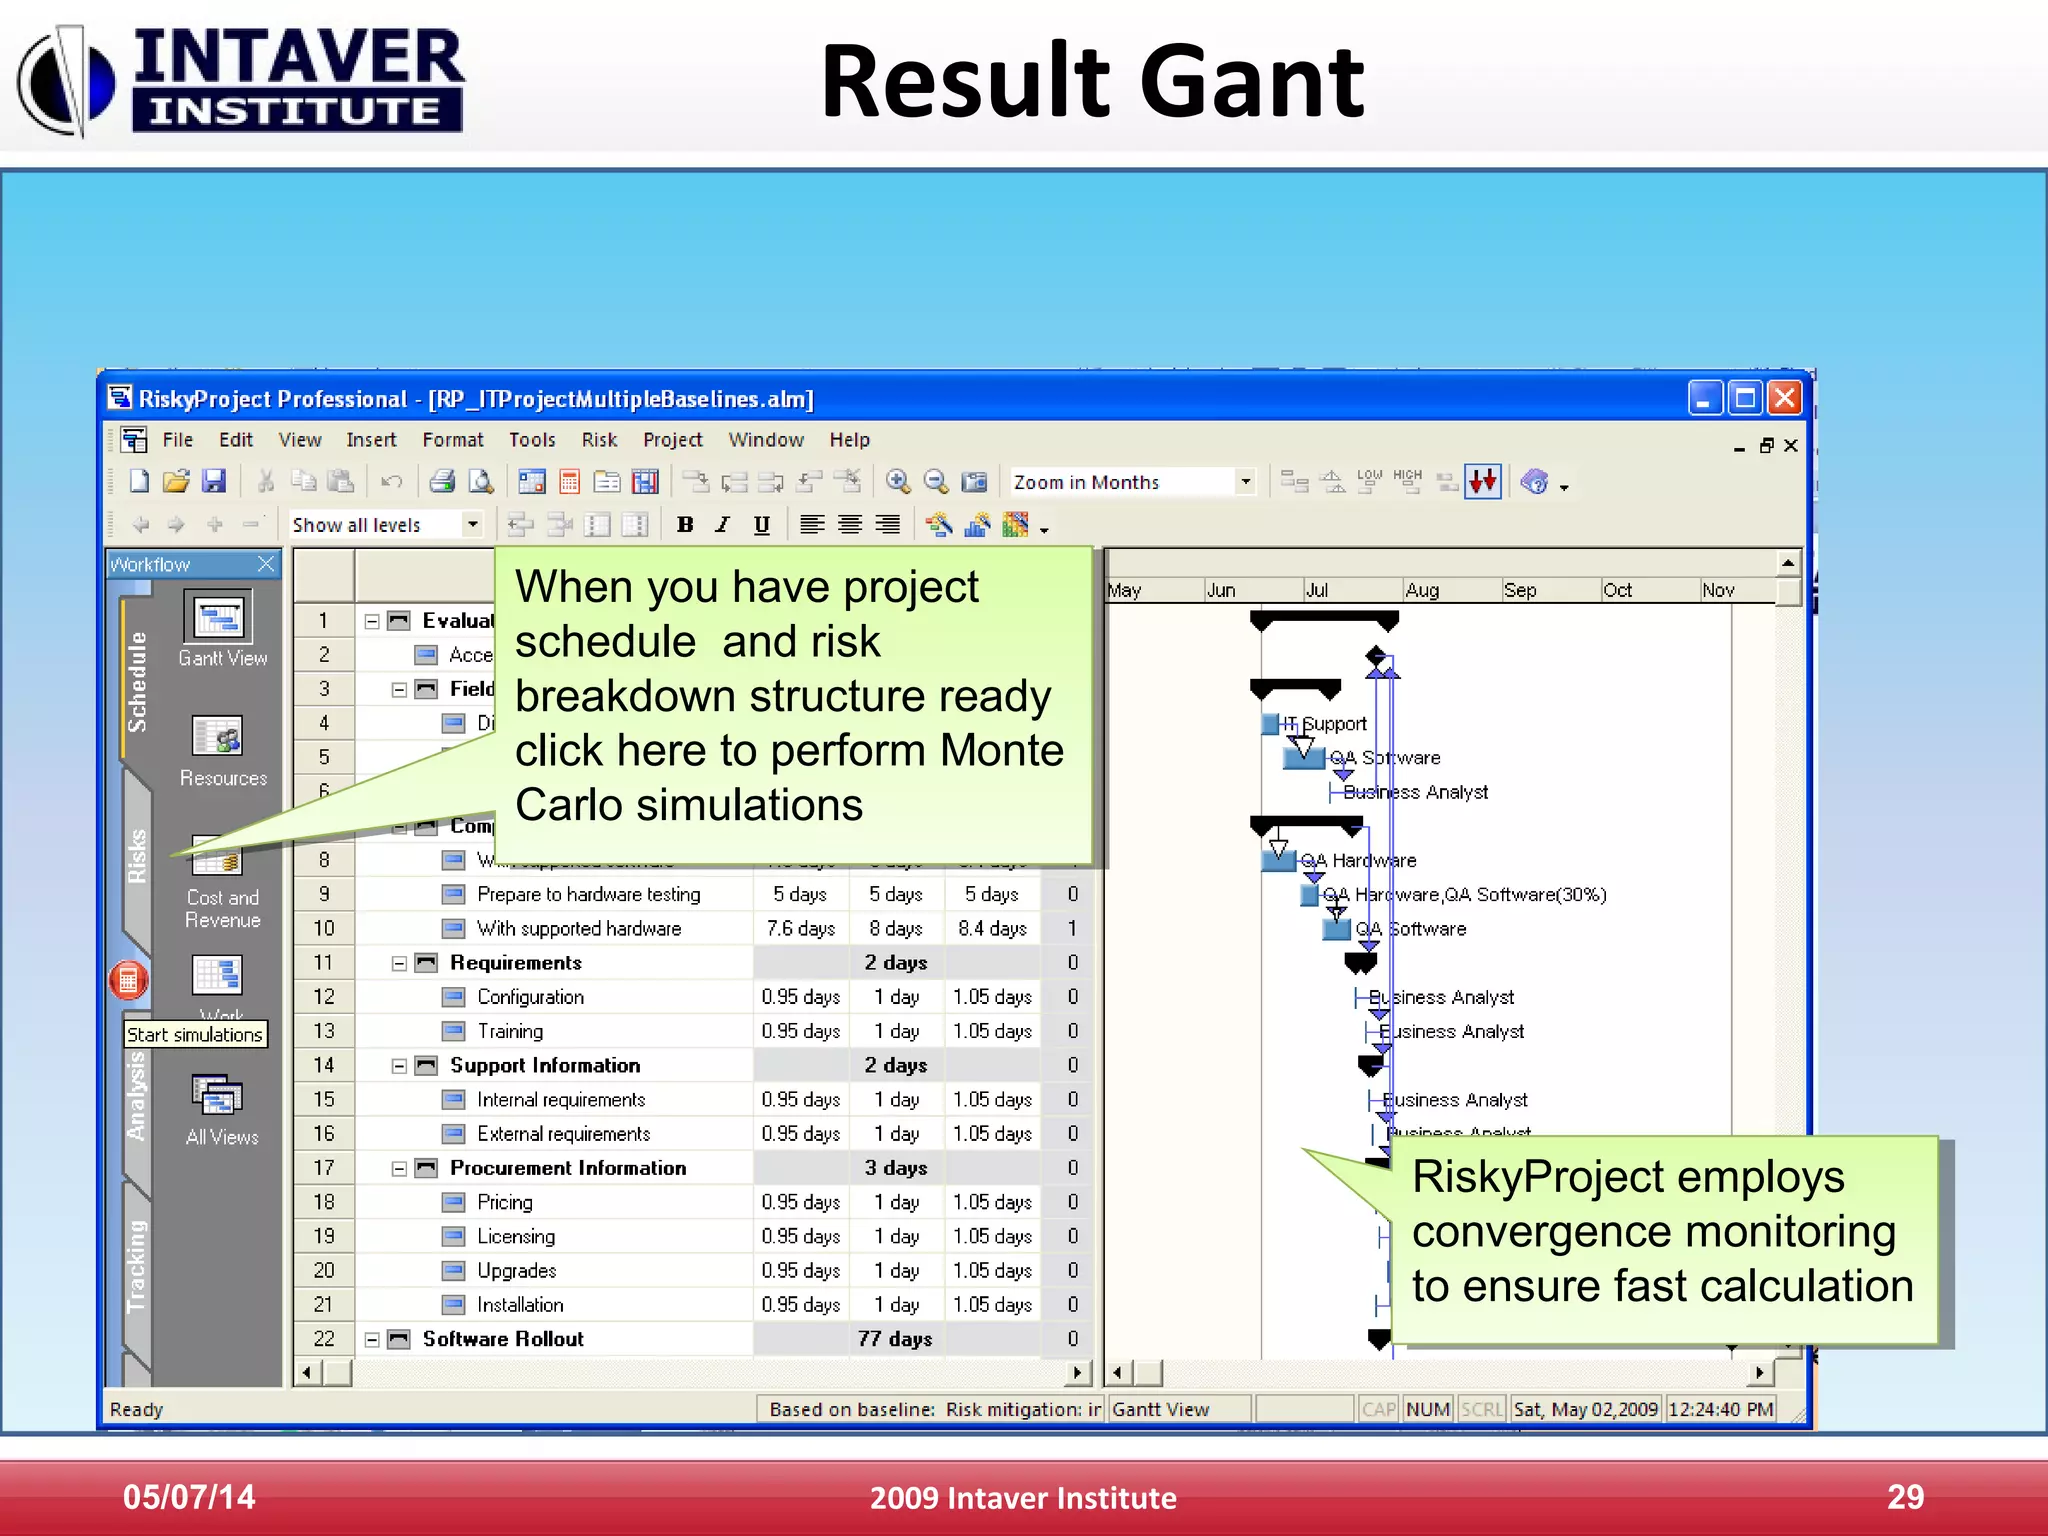
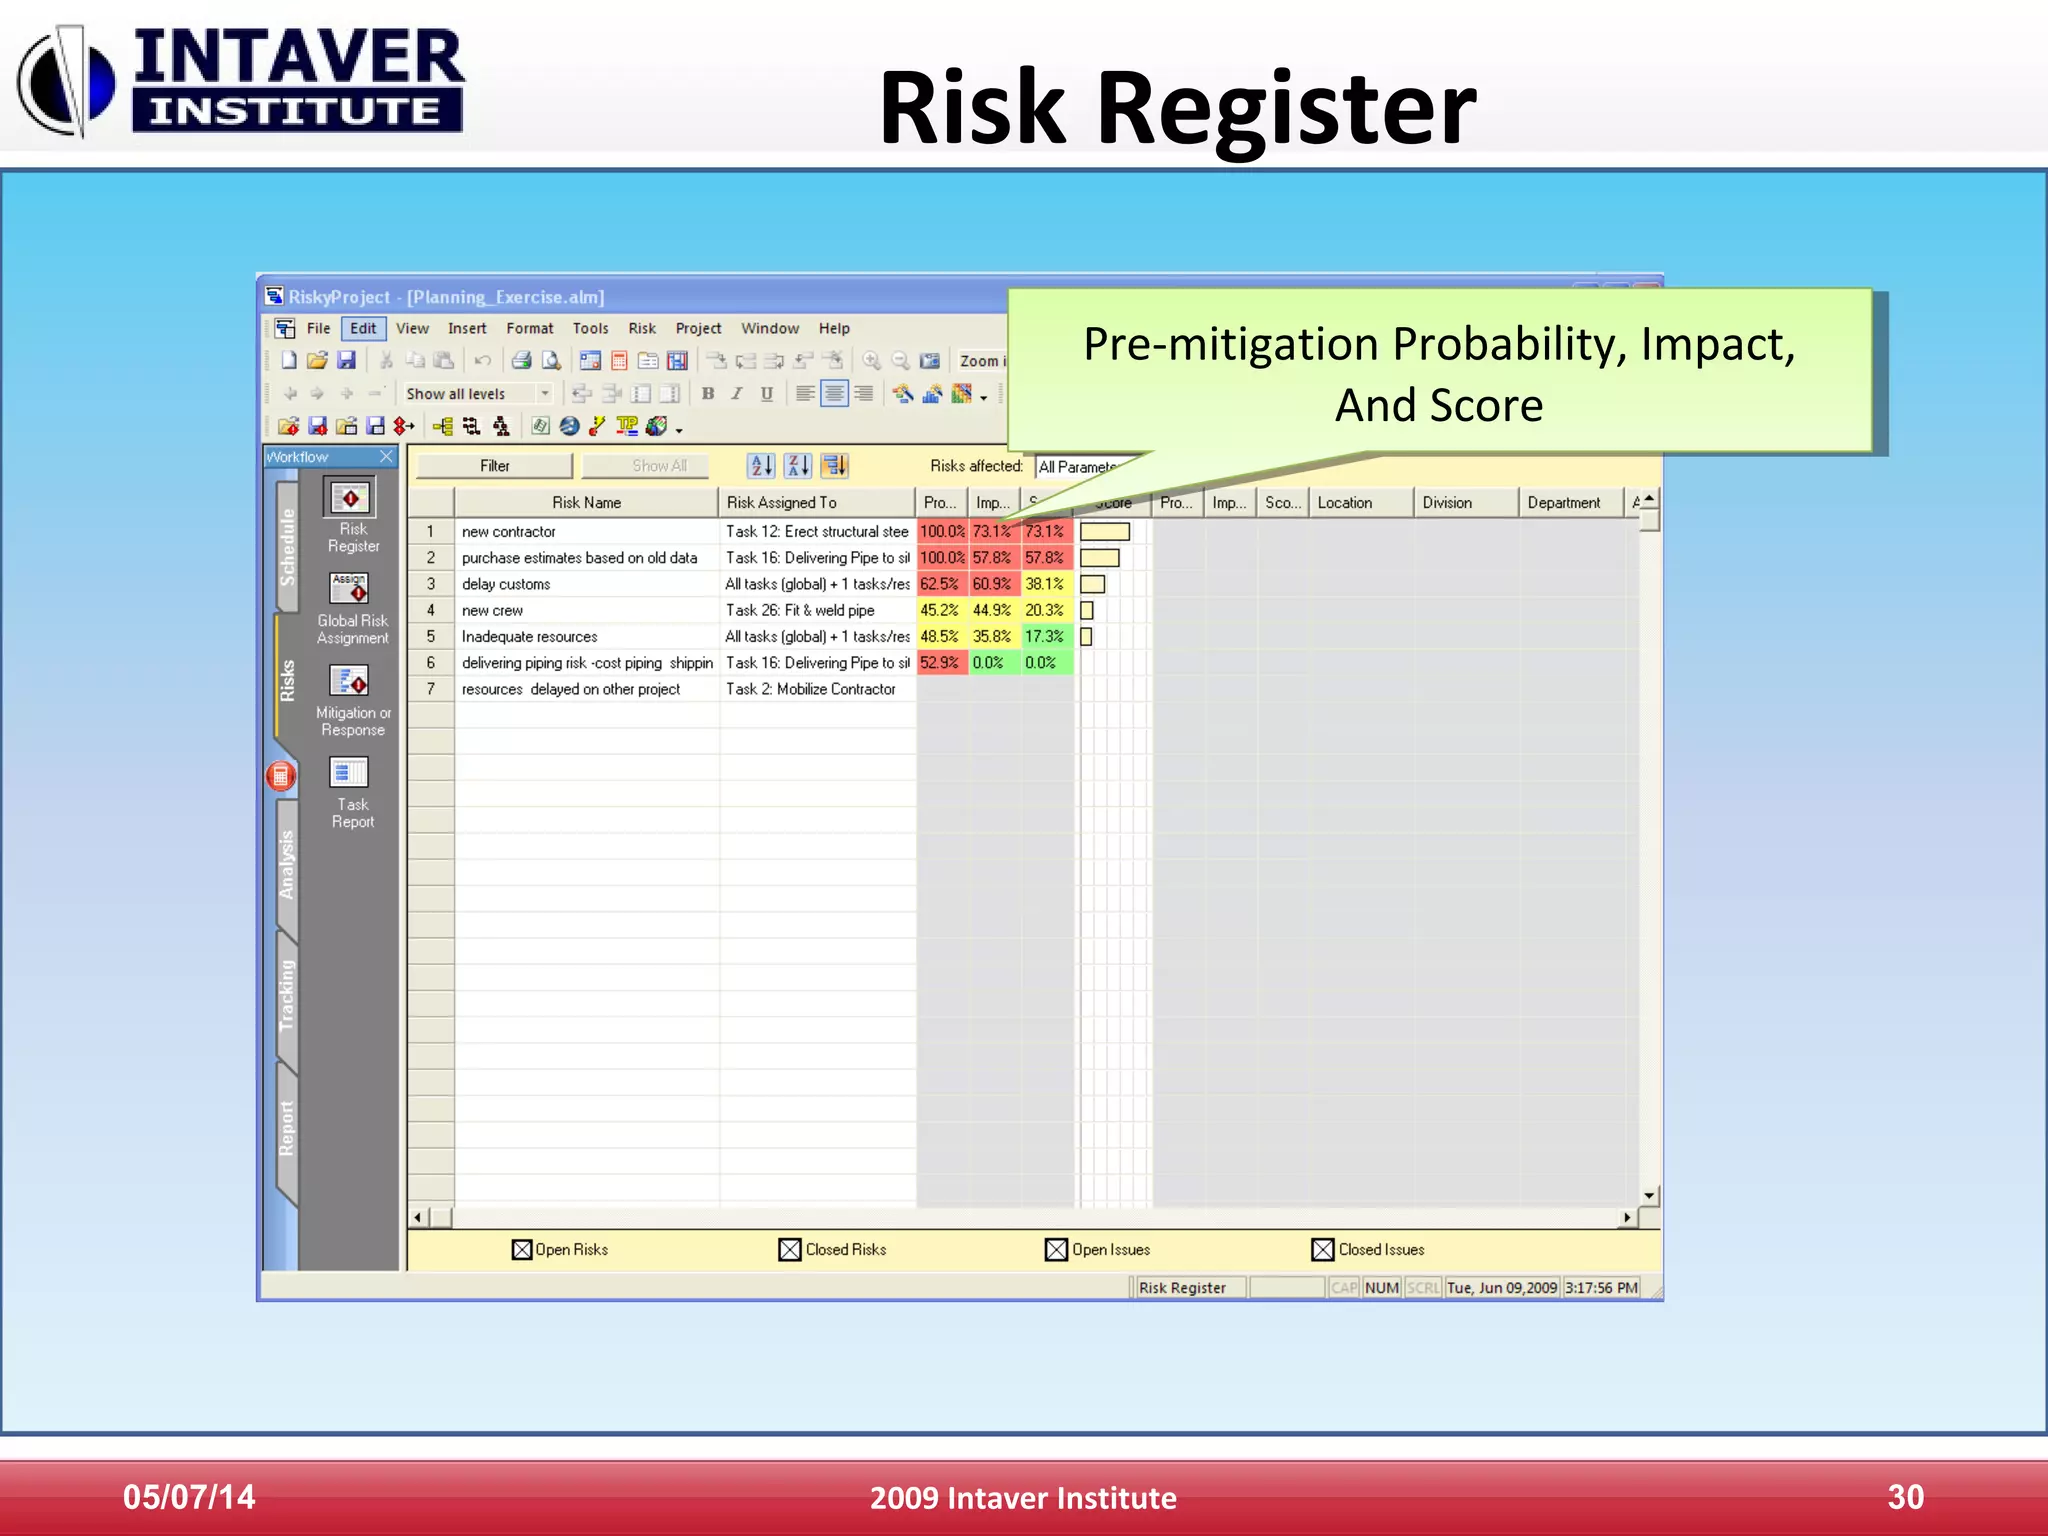
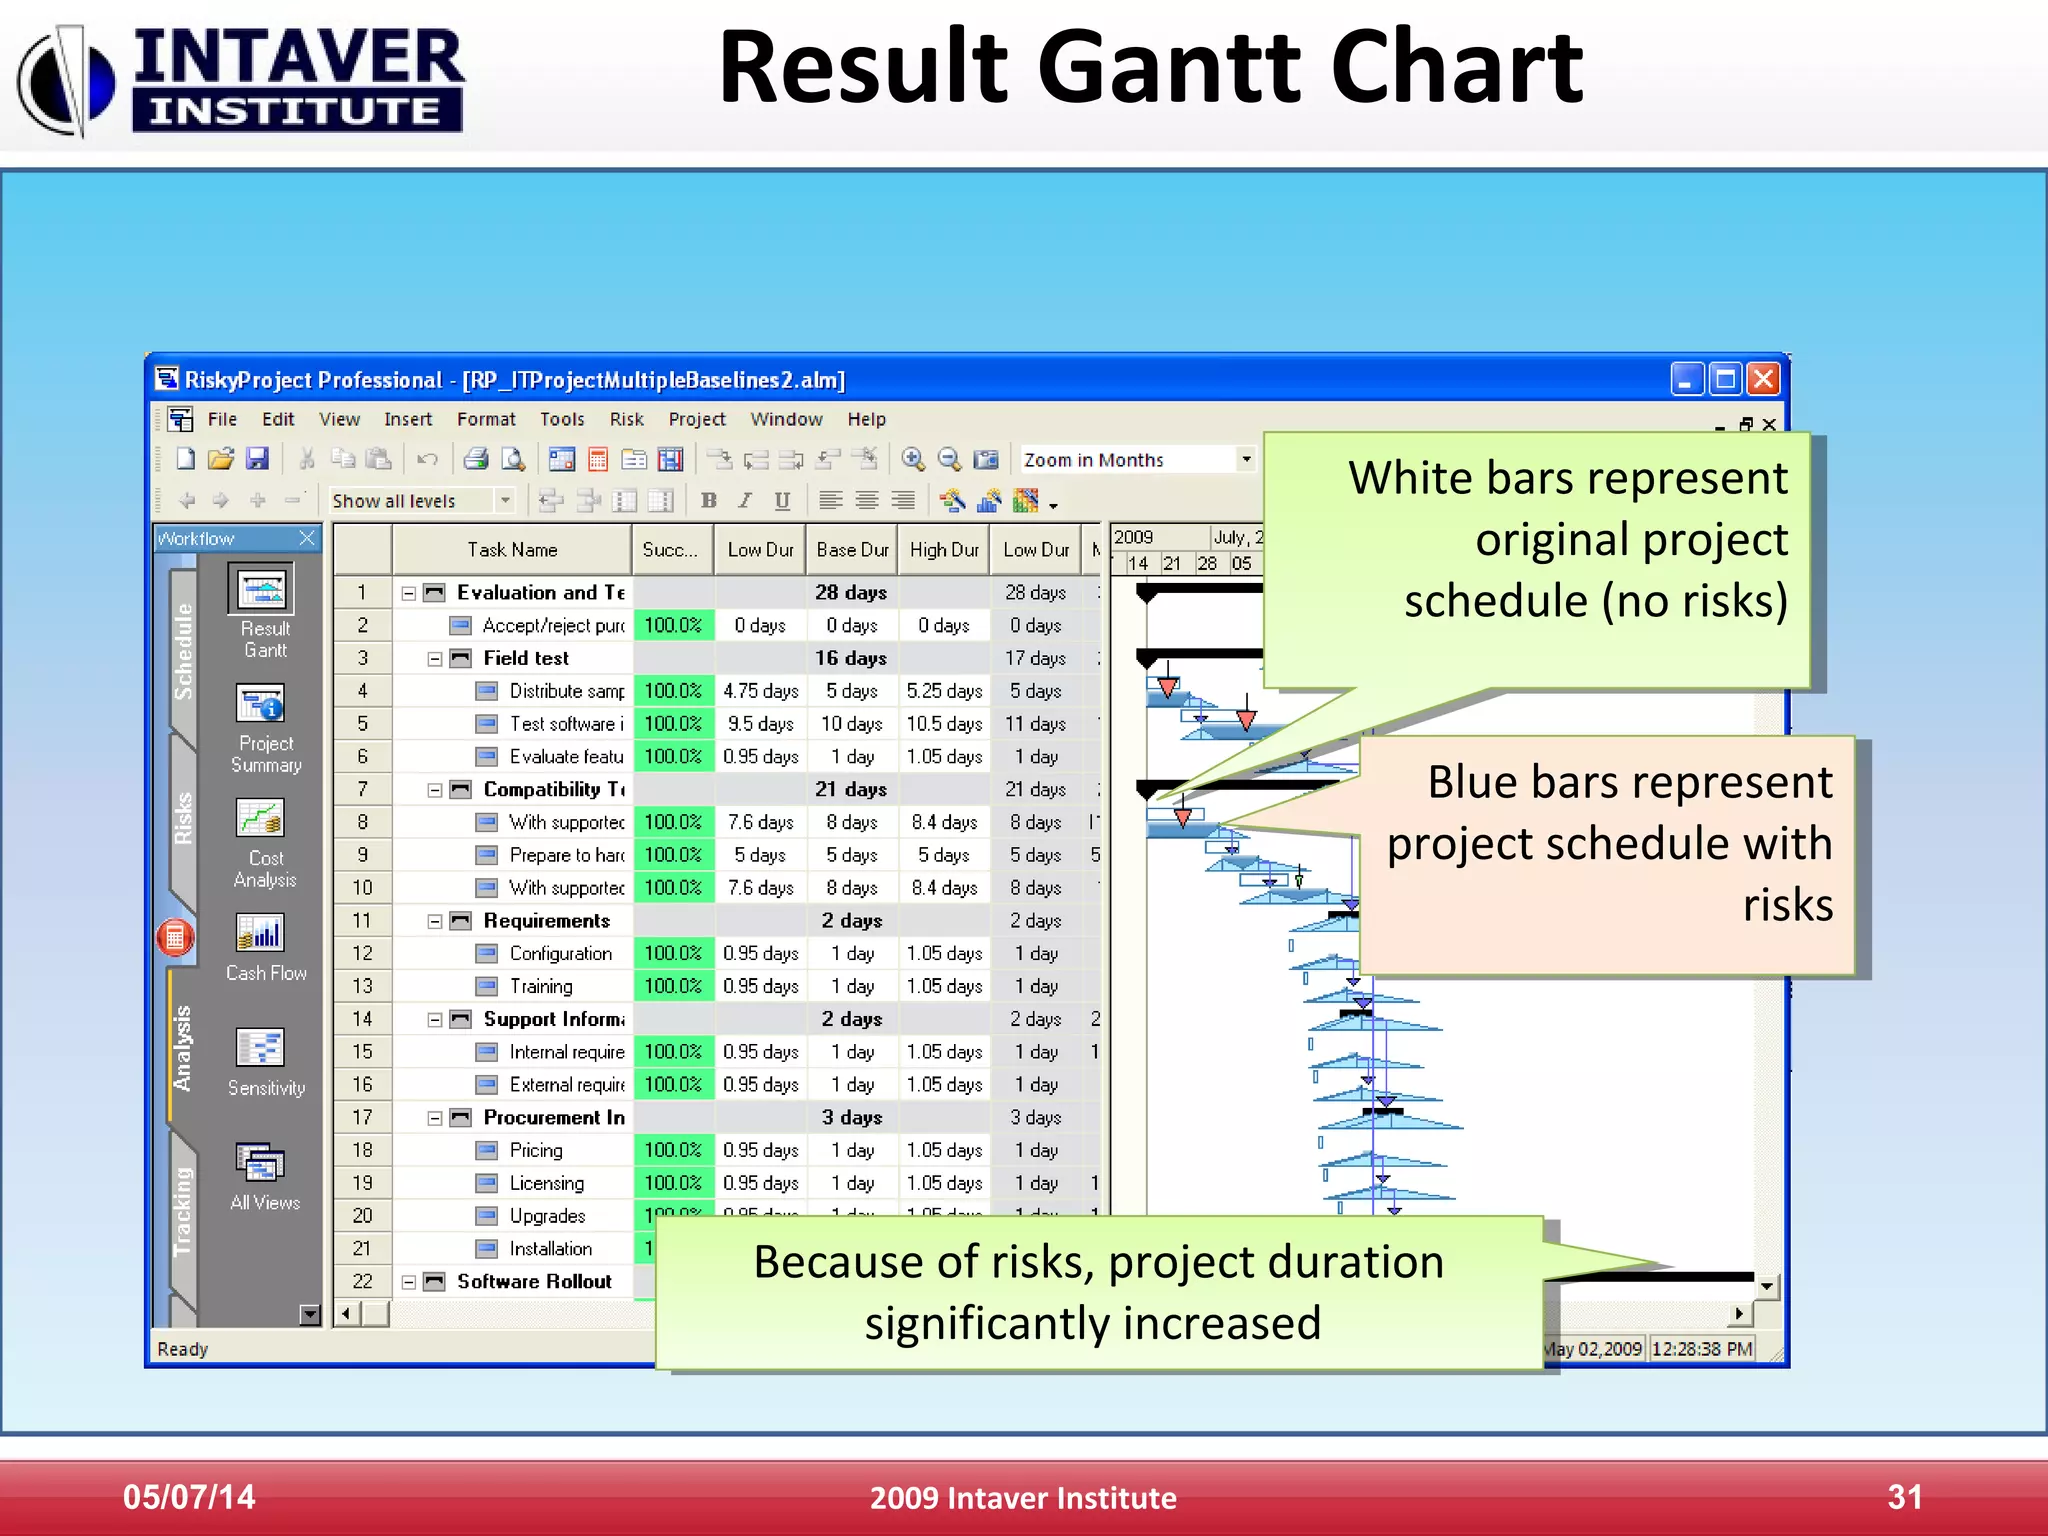
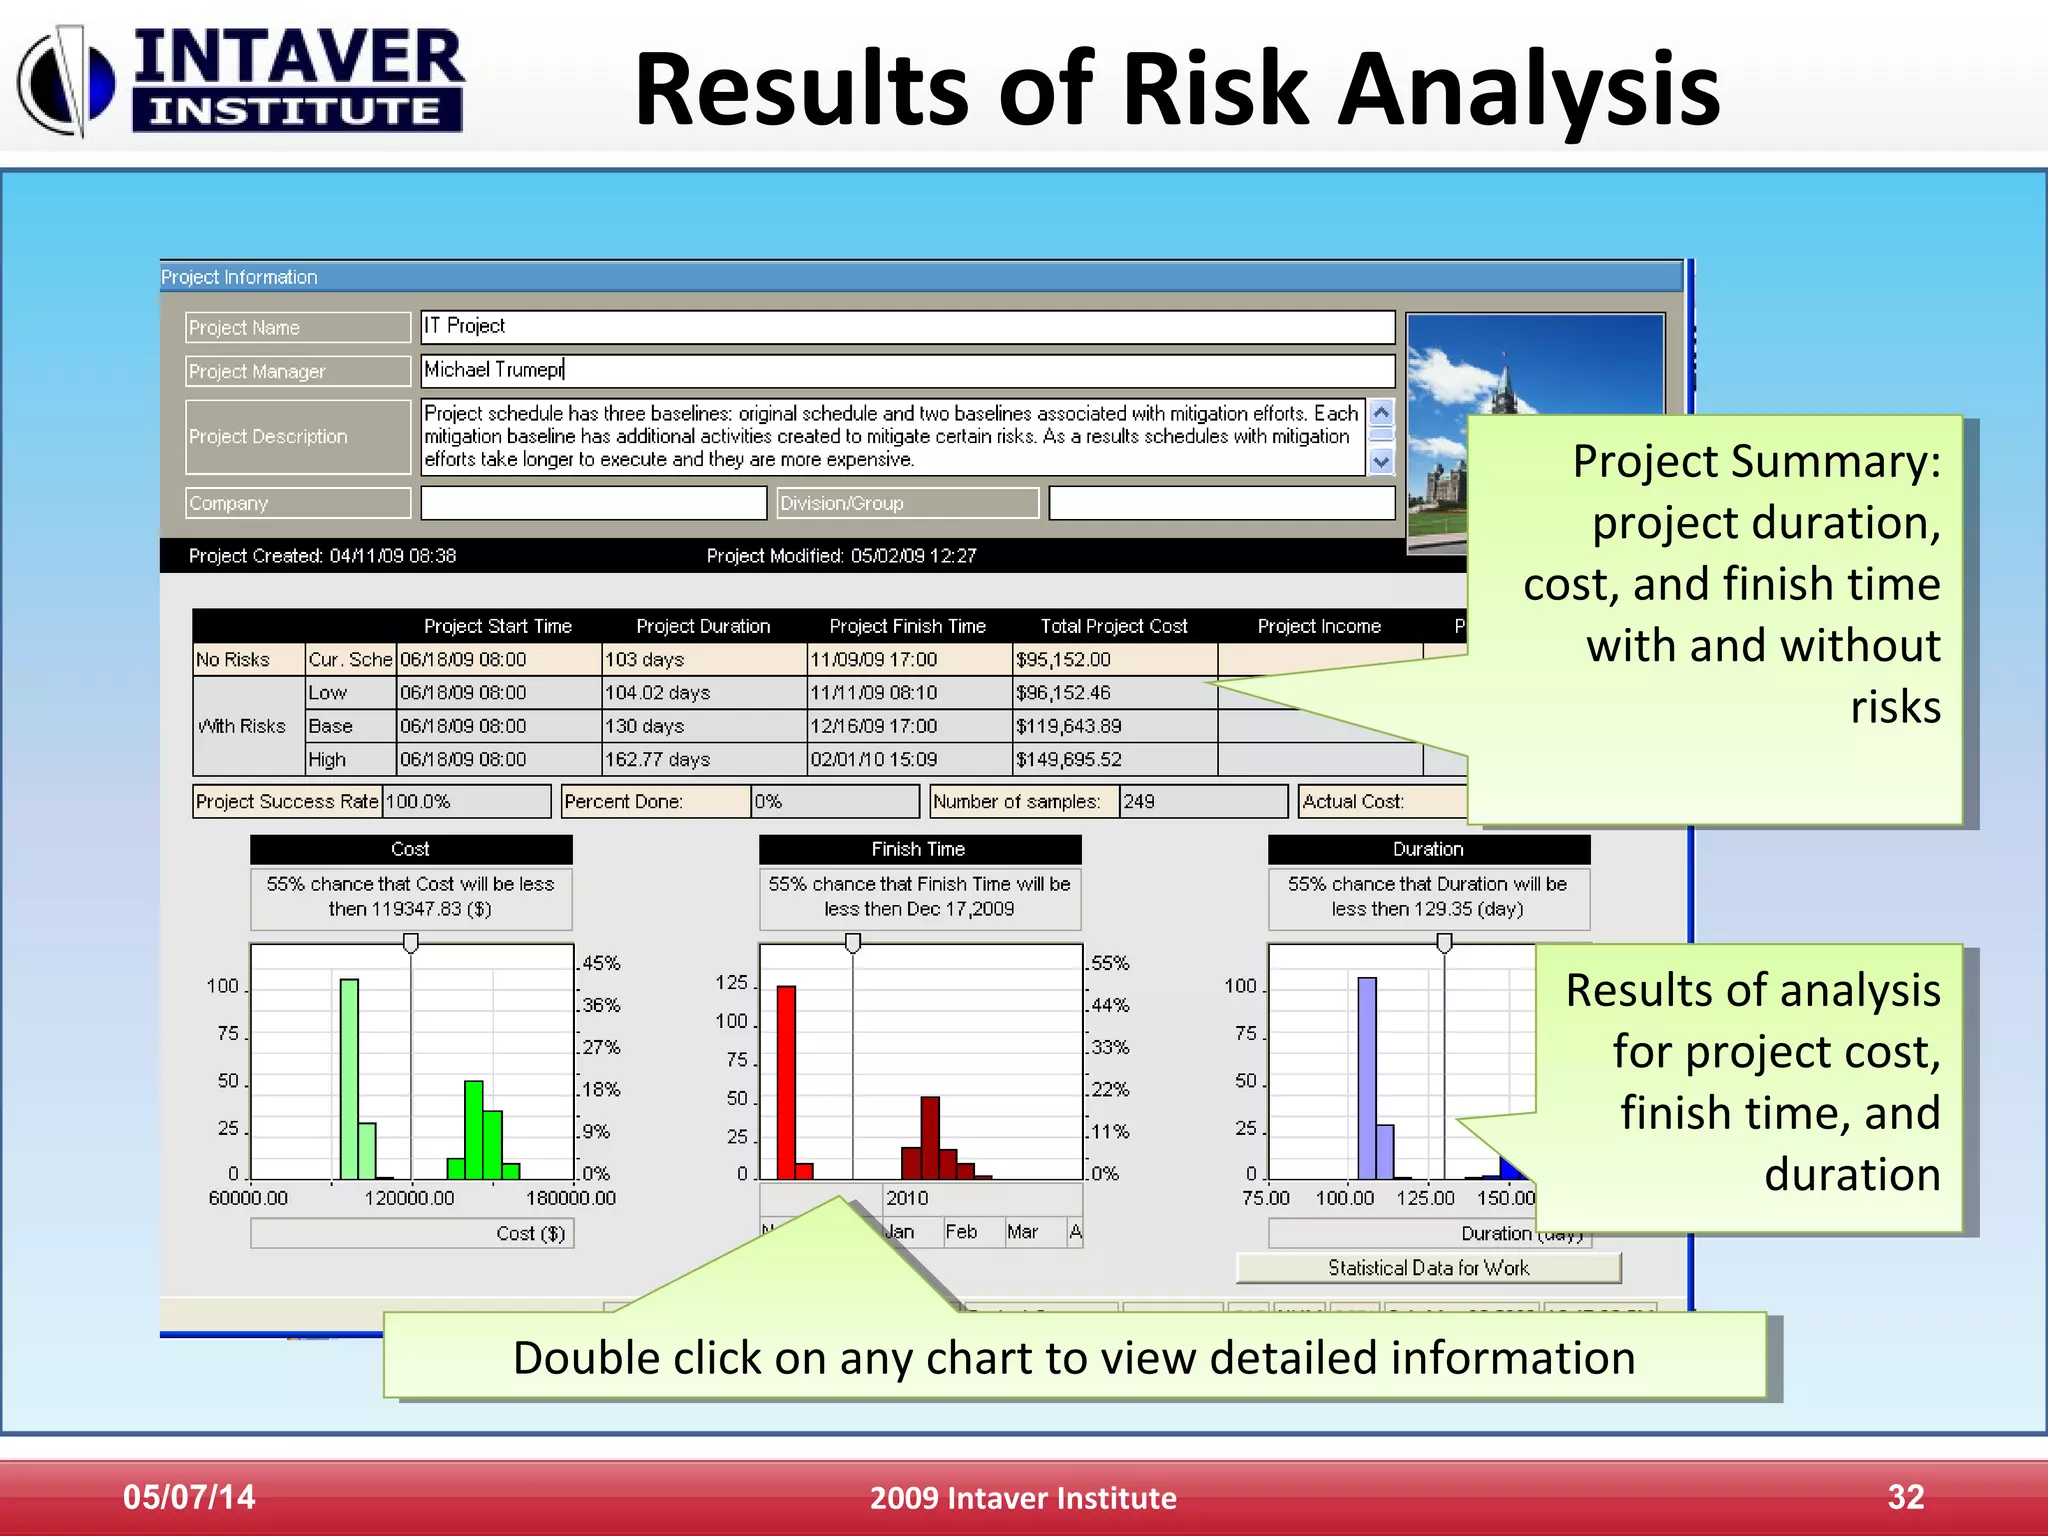
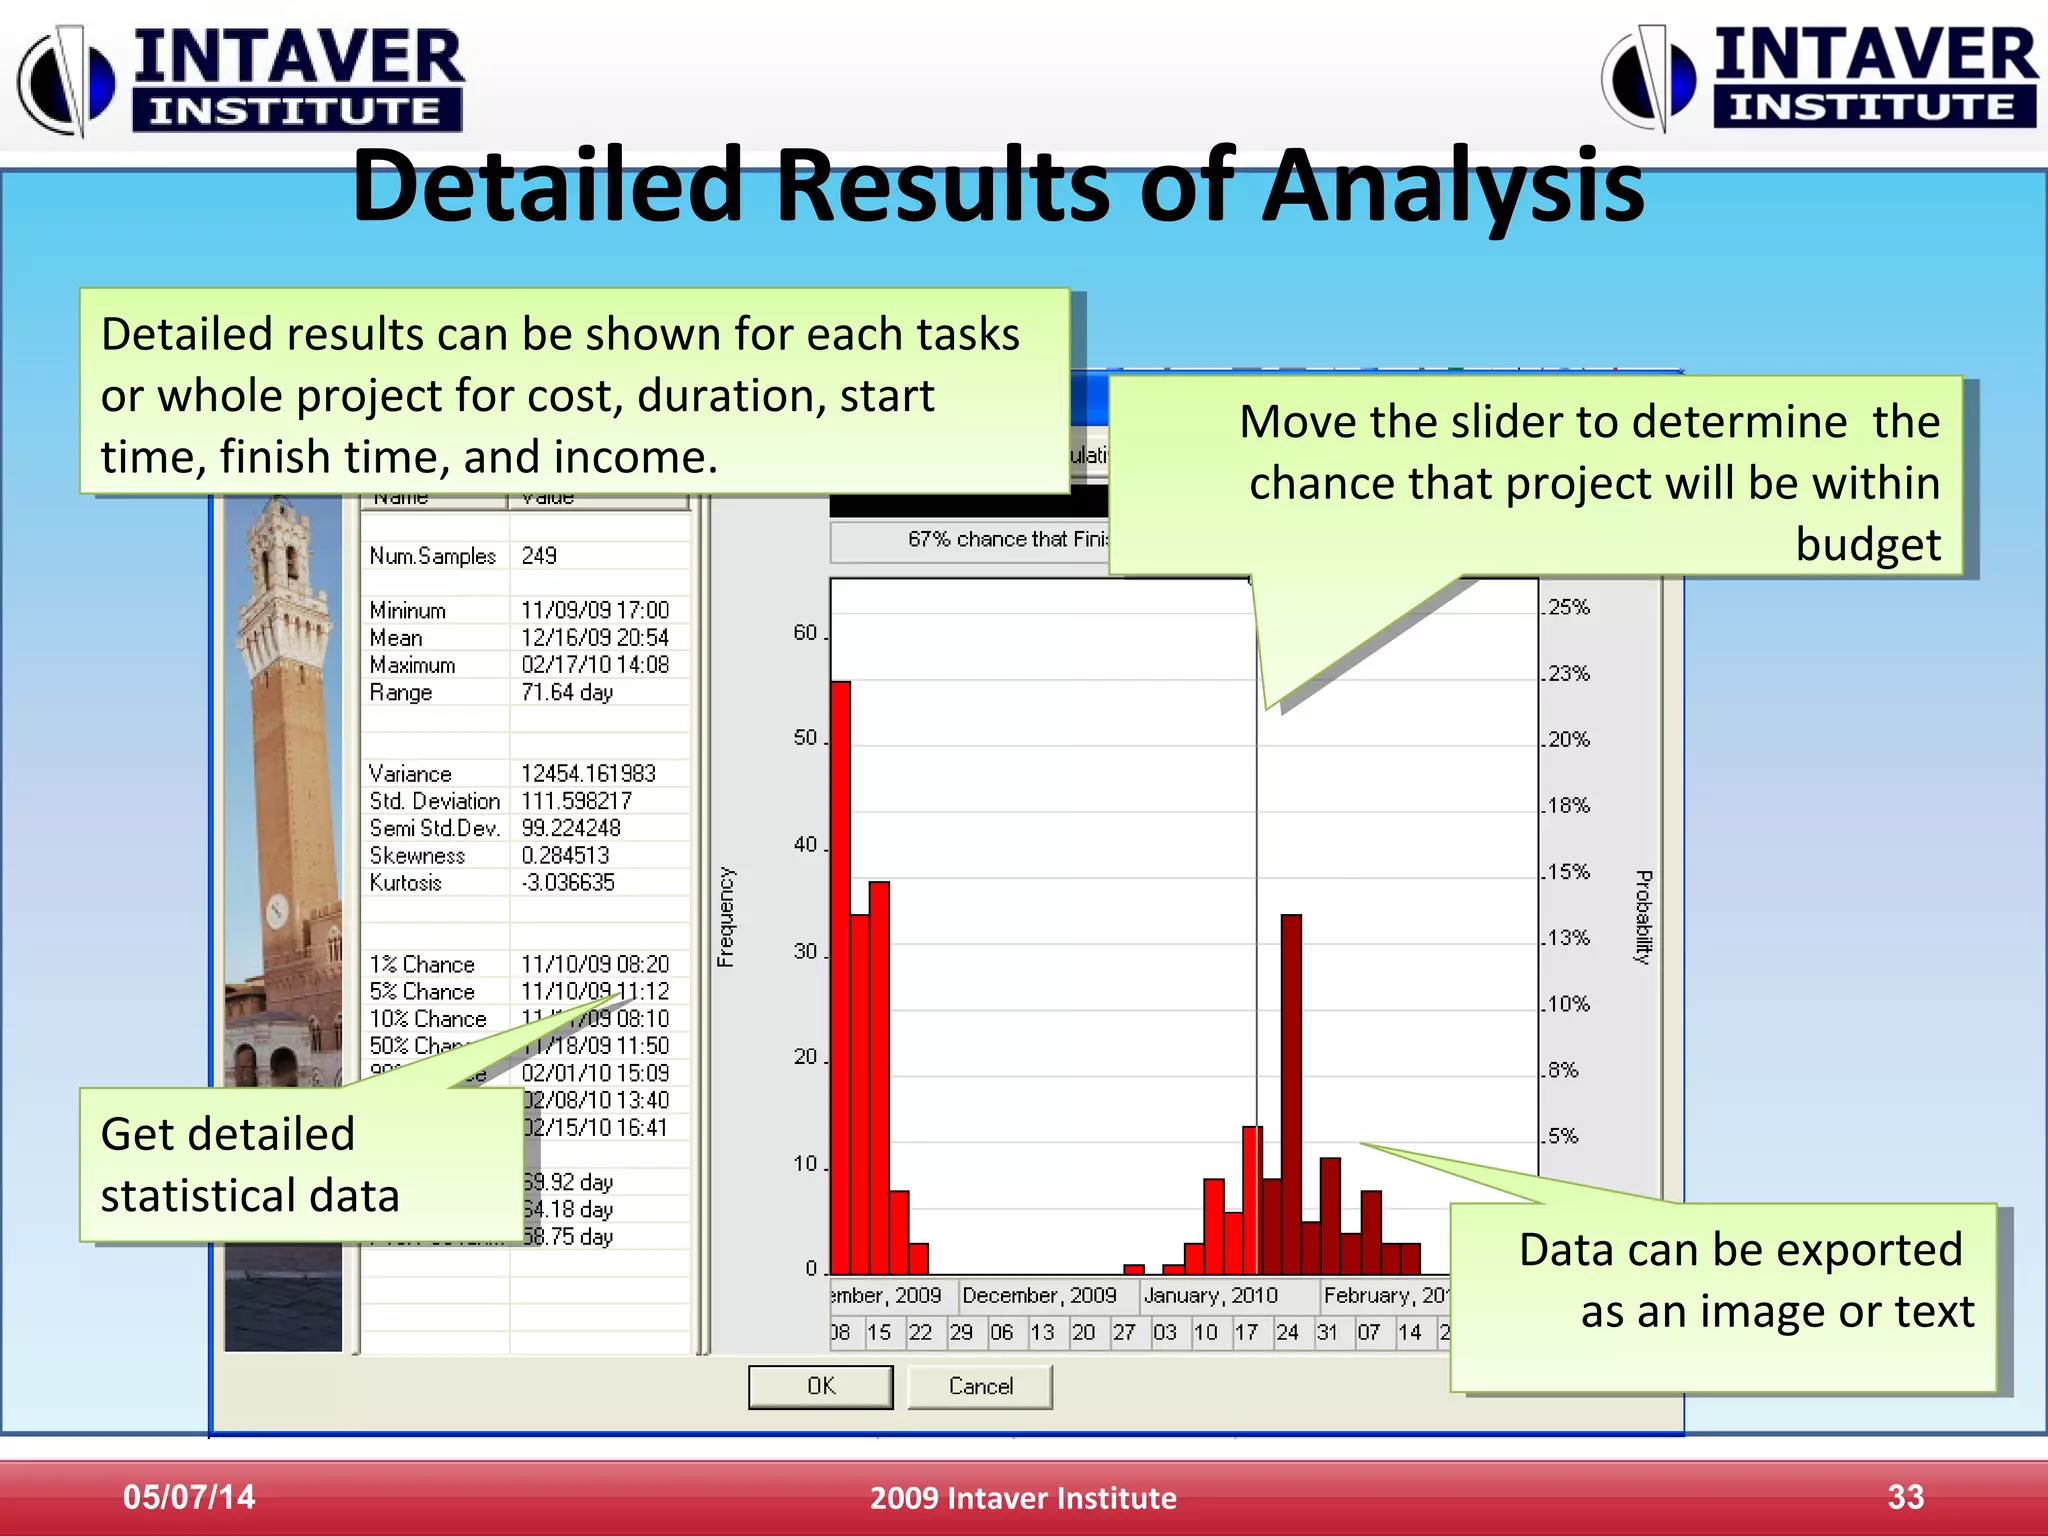
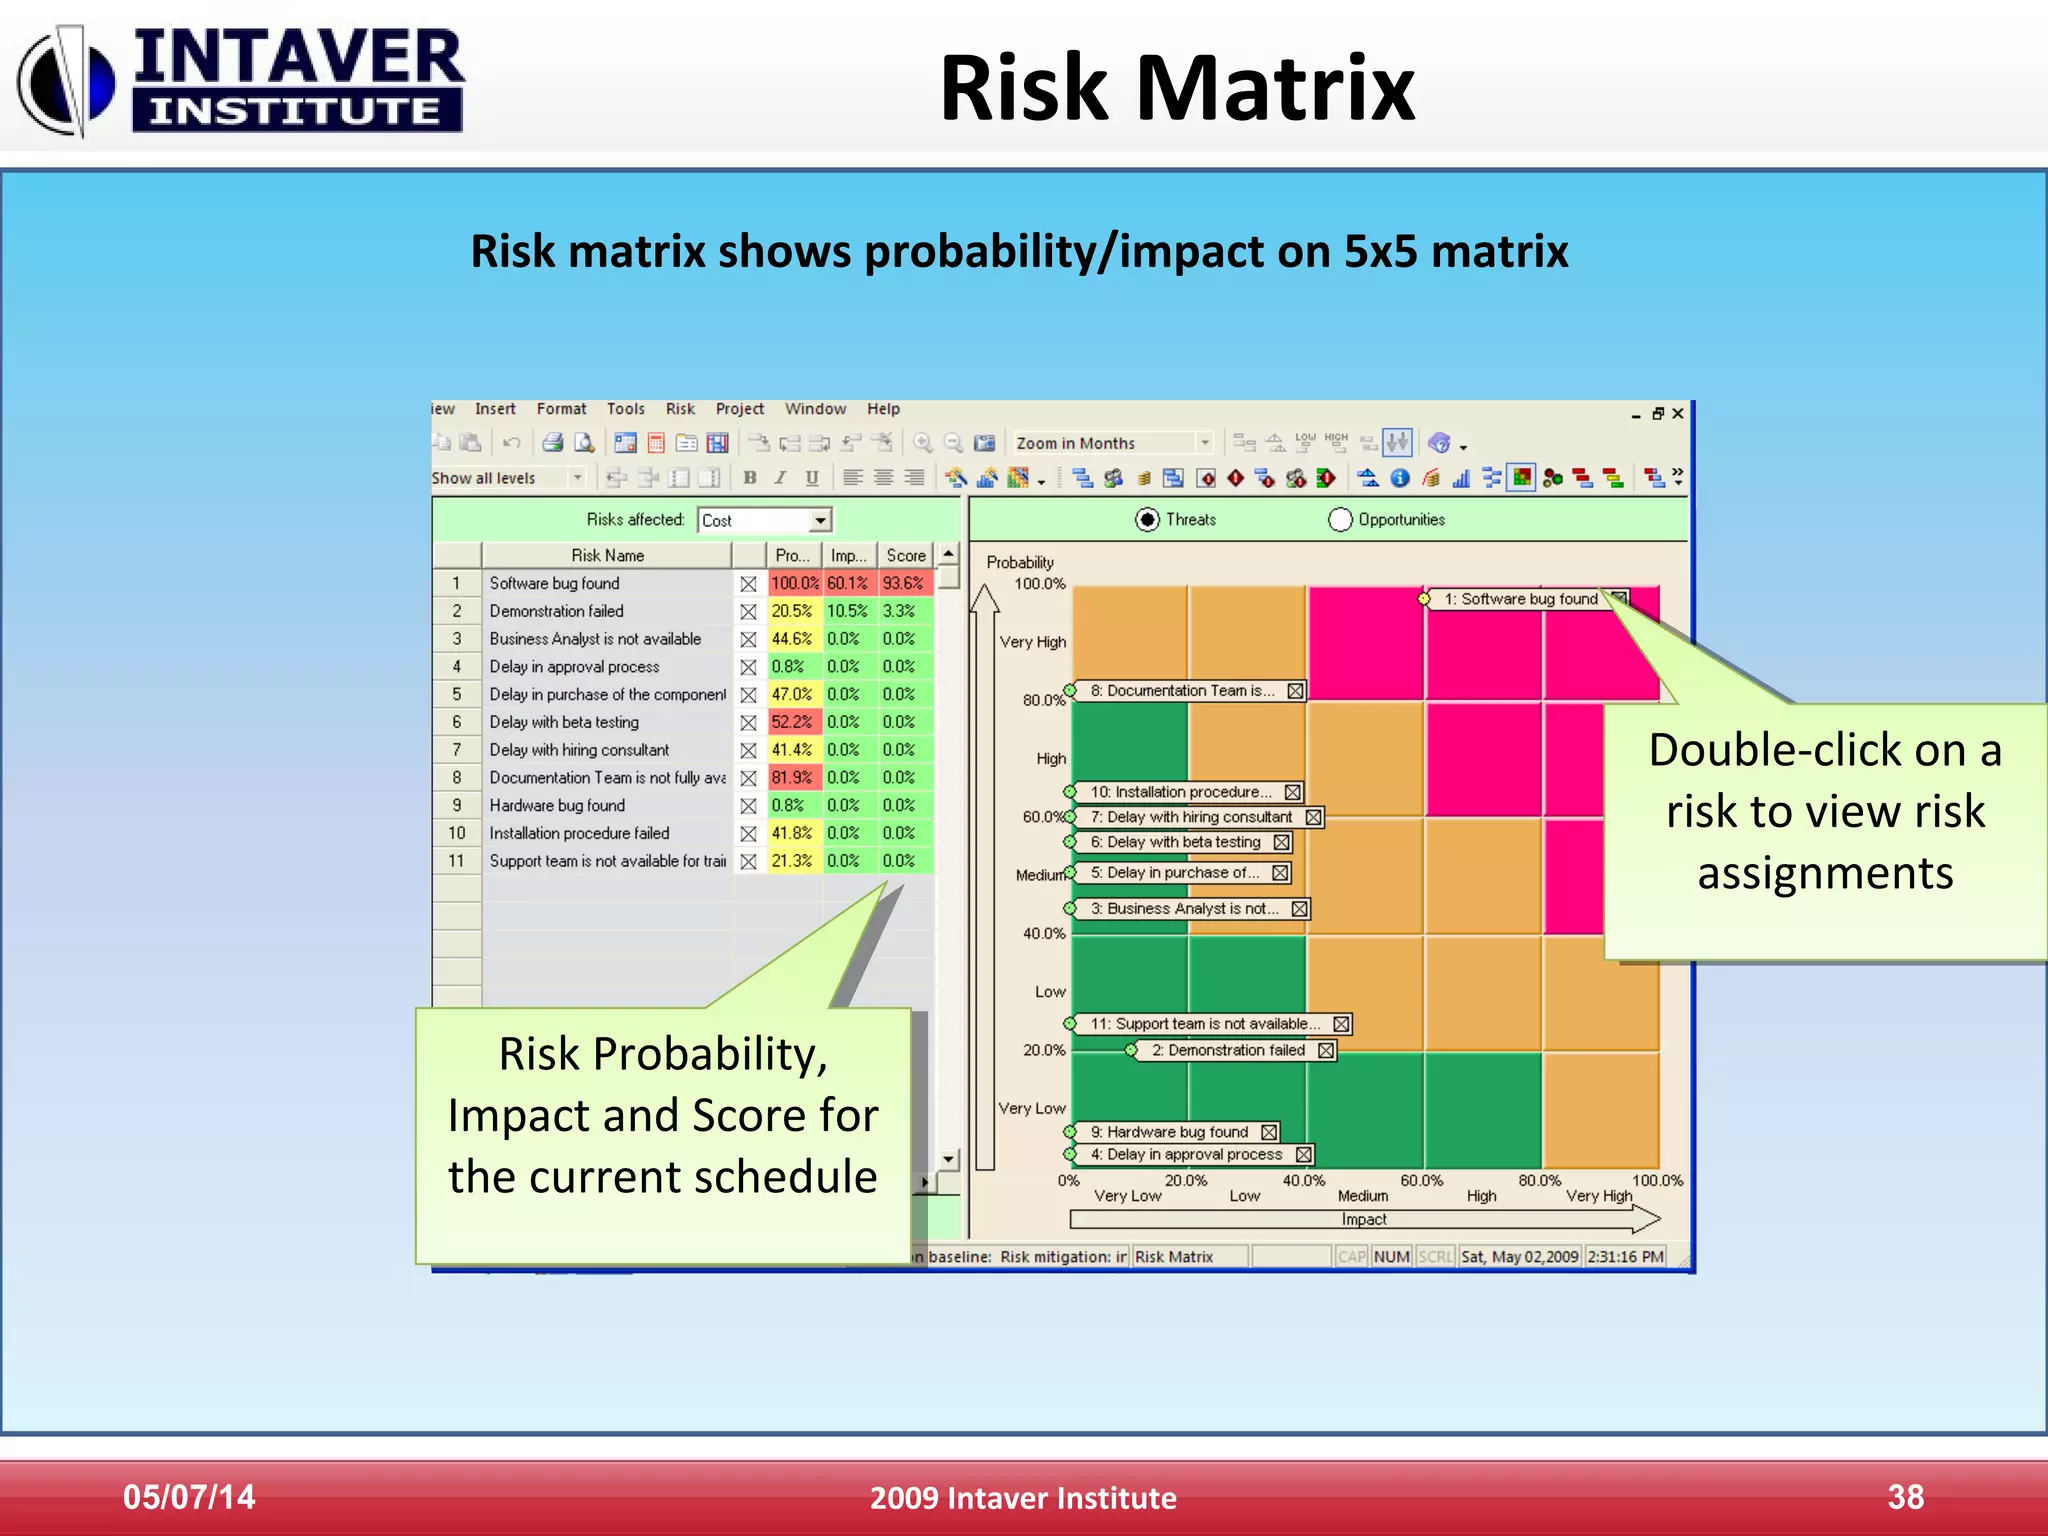
Risk Event Modeling
Risk event modeling in part of Intaver
Institute’s presentations on project risk
management and risk analysis
Intaver Institute Inc.
303, 6707, Elbow Drive S.W, Calgary, AB, Canada
Tel: +1(403)692-2252
Fax: +1(403)459-4533
www.intaver.com
The Project Management Problem
05/07/14 2009 Intaver Institute 2
Many projects are unsuccessful!Many projects are unsuccessful!
05/07/14 2009 Intaver Institute 3
The Project Management Problem
05/07/14 2009 Intaver Institute 4
The Project Management Problem
05/07/14 2009 Intaver Institute 5
The Project Management Problem
05/07/14 2009 Intaver Institute 6
The Project Management Problem
Benefits
05/07/14 2009 Intaver Institute 7
Risk Event Modeling Workflow
05/07/14 2009 Intaver Institute 8
Risk Definition
• Risks
– Risks are “events” that have a probability of occurring during a project
– Risks are identified and assigned to tasks or resources
– Define impact of risks by assigning:
• Chance of occurrence
• Outcome (e.g. delay, increase in cost)
• Result (percentage or fixed value of outcome)
05/07/14 2009 Intaver Institute 9
What is Monte Carlo
Monte Carlo simulation is a mathematical method used in risk
analysis. Monte Carlo simulations are used to approximate the
distribution of potential results based on probabilistic inputs.
Monte Carlo Simulations
Input Parameters Output Parameters
Calculation
Engine
Critical Path
Scheduling
Engine
(
)
Task duration
cost, finish time,
etc.
cost, finish time,
etc.
Project duration
Monte Carlo Schedule Analysis
4 5 6321 7 7 82 3 654 1 4 5 632 7
8 9 10 11 12 13 14 15 16
1
2
3
4
5
6
7
Task 1
Task 2
Task 3
Two Approaches to Estimating Probabilities
• The relative frequency approach, where probability equals
the number of occurrences of specific outcome (or event)
divided by the total number of possible outcomes.
• The subjective approach represents an expert’s degree of
belief that a particular outcome will occur.
Two Approaches for Defining Uncertainties
• Distribution-based approach
• Event-based approach
Which Distribution Should Be Used?
Normal Triangual Uniform
Also useful:
• Lognornal
• Beta
Distribution Fitting
Before Eliciting Judgment You Need to Have:
• A clearly defined problem
• An identified list of risks, or a risk
breakdown structure, for the project
• A project schedule
• A clearly defined set of questions you will
ask experts
In addition, your team of experts should be aware
of any personal interest that expert may have
regarding particular issues. It helps to mitigate
motivational biases.
Psychological Factors
• Availability heuristic: people judge the probability of the
occurrence of events by how easily these events are brought to
mind.
• Anchoring heuristic: refers to the human tendency to remain close
to the initial estimate.
• Wishful thinking: when we overestimate the probabilities of
opportunities and underestimate the probabilities of risks.
Overestimating the Probability of Compound
Events
If the probability of a defect in a component is 20% and the
device uses three redundant components, the probability of the
defective device will be (0.2 * 0.2 * 0.2) = 0.008%.
People tend to think this number is much higher.
Ignoring Base-Rate Frequencies
• Historically, the probability that a particular
component will be defective is 1%.
• The component is tested before installation.
• The test showed that the component is defective.
• The test usually successfully identifies defective
components 80% of the time.
• What is the probability that a component is
defective?
The correct answer is close to 4%, however, most
people would think that answer is a little bit lower
than 80%.
Eliciting Judgment About Probabilities of
Single Events
• Pose a direct question: “What is the probability that the project
will be canceled due to budgetary problems?”
• Ask the experts two opposing questions: (1) “What is the
probability that the project will be canceled?” and (2) “What is
the probability the project will be completed?” The sum of
these two assessments should be 100%.
• Break compound events into simple events and review them
separately.
Probability Wheel
25% No delay of activity
35% 3 day delay of activity
40% 5 day delay of activity
Task Duration
4
8
12
16
20 100%
80%
60%
40%
20%
Frequency
Probability
2 3 4 5 6
(days)
Question: What is the chance that duration
is less than 3 days?
Eliciting Judgment: Probability Method
Eliciting Judgment: Method of Relative Heights
Task Duration
2
4
6
8
10
2 3 4 5 6
50%
40%
30%
20%
10%Frequency
Probability
(days)
Question: How many times the duration
will be between 2 and 3 days?
How Many Trials Are Required?
Huge number of trials (> 1000) usually does not increase
accuracy of analysis
• Incorporate rare events
• Use convergence monitoring
What Is The Chance That a Project Will Be on Time And Within
Budget?
Analysis of Monte Carlo Results
• Sensitivity and Correlations
• Critical Indices
• Crucial tasks
• Critical Risks
• Probabilistic Calendars
• Deadlines
• Conditional Branching
• Probabilistic Branching
• Chance of Task Existence
Analyze Results
05/07/14 2009 Intaver Institute 28
Result Gant
05/07/14 2009 Intaver Institute 29
When you have project
schedule and risk
breakdown structure ready
click here to perform Monte
Carlo simulations
When you have project
schedule and risk
breakdown structure ready
click here to perform Monte
Carlo simulations
RiskyProject employs
convergence monitoring
to ensure fast calculation
RiskyProject employs
convergence monitoring
to ensure fast calculation
Risk Register
Pre-mitigation Probability, Impact,
And Score
Pre-mitigation Probability, Impact,
And Score
05/07/14 2009 Intaver Institute 30
Result Gantt Chart
05/07/14 2009 Intaver Institute 31
White bars represent
original project
schedule (no risks)
White bars represent
original project
schedule (no risks)
Blue bars represent
project schedule with
risks
Blue bars represent
project schedule with
risks
Because of risks, project duration
significantly increased
Because of risks, project duration
significantly increased
Results of Risk Analysis
05/07/14 2009 Intaver Institute 32
Project Summary:
project duration,
cost, and finish time
with and without
risks
Project Summary:
project duration,
cost, and finish time
with and without
risks
Results of analysis
for project cost,
finish time, and
duration
Results of analysis
for project cost,
finish time, and
duration
Double click on any chart to view detailed informationDouble click on any chart to view detailed information
Detailed Results of Analysis
05/07/14 2009 Intaver Institute 33
Move the slider to determine the
chance that project will be within
budget
Move the slider to determine the
chance that project will be within
budget
Get detailed
statistical data
Get detailed
statistical data
Data can be exported
as an image or text
Data can be exported
as an image or text
Detailed results can be shown for each tasks
or whole project for cost, duration, start
time, finish time, and income.
Detailed results can be shown for each tasks
or whole project for cost, duration, start
time, finish time, and income.
Sensitivity
05/07/14 2009 Intaver Institute 34
Tornado chart shows risks or
other parameters have the most
affect on the project schedule
Tornado chart shows risks or
other parameters have the most
affect on the project schedule
Top critical risks need to
be mitigated first
Top critical risks need to
be mitigated first
Crucial Tasks
05/07/14 2009 Intaver Institute 35
Crucial tasks have the
most affect on the
project schedule
Crucial tasks have the
most affect on the
project schedule
Crucial tasks for project cost and
duration can be different
Crucial tasks for project cost and
duration can be different
Success Rate
05/07/14 2009 Intaver Institute 36
A task can be canceled if it reaches a task or a project deadline or if it is affected
by risk with a “Cancel task” outcome.
Success rate is calculated
based on number of
times the task is not
canceled
Success rate is calculated
based on number of
times the task is not
canceled
Risk Chart
05/07/14 2009 Intaver Institute 37
Risk chart show risks, associated with task versus duration or cost
This task has low
duration but high
risk
This task has low
duration but high
risk
These tasks have
balanced risk versus
duration ratio.
These tasks have
balanced risk versus
duration ratio.
Risk Matrix
05/07/14 2009 Intaver Institute 38
Risk matrix shows probability/impact on 5x5 matrix
Double-click on a
risk to view risk
assignments
Double-click on a
risk to view risk
assignments
Risk Probability,
Impact and Score for
the current schedule
Risk Probability,
Impact and Score for
the current schedule
Risk Planning
05/07/14 2009 Intaver Institute 39
Modeling risk mitigation efforts
•Risk handling strategies
•Transfer
•Mitigate
•Eliminate
•Ignore
•Risk mitigation efforts represent their own costs etc.
which must be accounted for
•Create multiple baselines that model pre and post
mitigation risk handling efforts
•View results of risk handling efforts
•Select project alternative based on criteria (cost,
duration, start and finish time, success rate)
Future Reading
Lev Virine and Michael Trumper
Project Decisions:
The Art and Science
Management Concepts, Vienna, VA, 2007
Lev Virine and Michael Trumper
Project Think:
Why Good Managers Make Poor Project Choices
Gower, 2013

Project Risk Analysis with Risk Event and Event Chain

  • 1.
    Risk Event Modeling Riskevent modeling in part of Intaver Institute’s presentations on project risk management and risk analysis Intaver Institute Inc. 303, 6707, Elbow Drive S.W, Calgary, AB, Canada Tel: +1(403)692-2252 Fax: +1(403)459-4533 www.intaver.com
  • 2.
    The Project ManagementProblem 05/07/14 2009 Intaver Institute 2 Many projects are unsuccessful!Many projects are unsuccessful!
  • 3.
    05/07/14 2009 IntaverInstitute 3 The Project Management Problem
  • 4.
    05/07/14 2009 IntaverInstitute 4 The Project Management Problem
  • 5.
    05/07/14 2009 IntaverInstitute 5 The Project Management Problem
  • 6.
    05/07/14 2009 IntaverInstitute 6 The Project Management Problem
  • 7.
  • 8.
    Risk Event ModelingWorkflow 05/07/14 2009 Intaver Institute 8
  • 9.
    Risk Definition • Risks –Risks are “events” that have a probability of occurring during a project – Risks are identified and assigned to tasks or resources – Define impact of risks by assigning: • Chance of occurrence • Outcome (e.g. delay, increase in cost) • Result (percentage or fixed value of outcome) 05/07/14 2009 Intaver Institute 9
  • 10.
    What is MonteCarlo Monte Carlo simulation is a mathematical method used in risk analysis. Monte Carlo simulations are used to approximate the distribution of potential results based on probabilistic inputs.
  • 11.
    Monte Carlo Simulations InputParameters Output Parameters Calculation Engine Critical Path Scheduling Engine ( ) Task duration cost, finish time, etc. cost, finish time, etc. Project duration
  • 12.
    Monte Carlo ScheduleAnalysis 4 5 6321 7 7 82 3 654 1 4 5 632 7 8 9 10 11 12 13 14 15 16 1 2 3 4 5 6 7 Task 1 Task 2 Task 3
  • 13.
    Two Approaches toEstimating Probabilities • The relative frequency approach, where probability equals the number of occurrences of specific outcome (or event) divided by the total number of possible outcomes. • The subjective approach represents an expert’s degree of belief that a particular outcome will occur.
  • 14.
    Two Approaches forDefining Uncertainties • Distribution-based approach • Event-based approach
  • 15.
    Which Distribution ShouldBe Used? Normal Triangual Uniform Also useful: • Lognornal • Beta
  • 16.
  • 17.
    Before Eliciting JudgmentYou Need to Have: • A clearly defined problem • An identified list of risks, or a risk breakdown structure, for the project • A project schedule • A clearly defined set of questions you will ask experts In addition, your team of experts should be aware of any personal interest that expert may have regarding particular issues. It helps to mitigate motivational biases.
  • 18.
    Psychological Factors • Availabilityheuristic: people judge the probability of the occurrence of events by how easily these events are brought to mind. • Anchoring heuristic: refers to the human tendency to remain close to the initial estimate. • Wishful thinking: when we overestimate the probabilities of opportunities and underestimate the probabilities of risks.
  • 19.
    Overestimating the Probabilityof Compound Events If the probability of a defect in a component is 20% and the device uses three redundant components, the probability of the defective device will be (0.2 * 0.2 * 0.2) = 0.008%. People tend to think this number is much higher.
  • 20.
    Ignoring Base-Rate Frequencies •Historically, the probability that a particular component will be defective is 1%. • The component is tested before installation. • The test showed that the component is defective. • The test usually successfully identifies defective components 80% of the time. • What is the probability that a component is defective? The correct answer is close to 4%, however, most people would think that answer is a little bit lower than 80%.
  • 21.
    Eliciting Judgment AboutProbabilities of Single Events • Pose a direct question: “What is the probability that the project will be canceled due to budgetary problems?” • Ask the experts two opposing questions: (1) “What is the probability that the project will be canceled?” and (2) “What is the probability the project will be completed?” The sum of these two assessments should be 100%. • Break compound events into simple events and review them separately.
  • 22.
    Probability Wheel 25% Nodelay of activity 35% 3 day delay of activity 40% 5 day delay of activity
  • 23.
    Task Duration 4 8 12 16 20 100% 80% 60% 40% 20% Frequency Probability 23 4 5 6 (days) Question: What is the chance that duration is less than 3 days? Eliciting Judgment: Probability Method
  • 24.
    Eliciting Judgment: Methodof Relative Heights Task Duration 2 4 6 8 10 2 3 4 5 6 50% 40% 30% 20% 10%Frequency Probability (days) Question: How many times the duration will be between 2 and 3 days?
  • 25.
    How Many TrialsAre Required? Huge number of trials (> 1000) usually does not increase accuracy of analysis • Incorporate rare events • Use convergence monitoring
  • 26.
    What Is TheChance That a Project Will Be on Time And Within Budget?
  • 27.
    Analysis of MonteCarlo Results • Sensitivity and Correlations • Critical Indices • Crucial tasks • Critical Risks • Probabilistic Calendars • Deadlines • Conditional Branching • Probabilistic Branching • Chance of Task Existence
  • 28.
    Analyze Results 05/07/14 2009Intaver Institute 28
  • 29.
    Result Gant 05/07/14 2009Intaver Institute 29 When you have project schedule and risk breakdown structure ready click here to perform Monte Carlo simulations When you have project schedule and risk breakdown structure ready click here to perform Monte Carlo simulations RiskyProject employs convergence monitoring to ensure fast calculation RiskyProject employs convergence monitoring to ensure fast calculation
  • 30.
    Risk Register Pre-mitigation Probability,Impact, And Score Pre-mitigation Probability, Impact, And Score 05/07/14 2009 Intaver Institute 30
  • 31.
    Result Gantt Chart 05/07/142009 Intaver Institute 31 White bars represent original project schedule (no risks) White bars represent original project schedule (no risks) Blue bars represent project schedule with risks Blue bars represent project schedule with risks Because of risks, project duration significantly increased Because of risks, project duration significantly increased
  • 32.
    Results of RiskAnalysis 05/07/14 2009 Intaver Institute 32 Project Summary: project duration, cost, and finish time with and without risks Project Summary: project duration, cost, and finish time with and without risks Results of analysis for project cost, finish time, and duration Results of analysis for project cost, finish time, and duration Double click on any chart to view detailed informationDouble click on any chart to view detailed information
  • 33.
    Detailed Results ofAnalysis 05/07/14 2009 Intaver Institute 33 Move the slider to determine the chance that project will be within budget Move the slider to determine the chance that project will be within budget Get detailed statistical data Get detailed statistical data Data can be exported as an image or text Data can be exported as an image or text Detailed results can be shown for each tasks or whole project for cost, duration, start time, finish time, and income. Detailed results can be shown for each tasks or whole project for cost, duration, start time, finish time, and income.
  • 34.
    Sensitivity 05/07/14 2009 IntaverInstitute 34 Tornado chart shows risks or other parameters have the most affect on the project schedule Tornado chart shows risks or other parameters have the most affect on the project schedule Top critical risks need to be mitigated first Top critical risks need to be mitigated first
  • 35.
    Crucial Tasks 05/07/14 2009Intaver Institute 35 Crucial tasks have the most affect on the project schedule Crucial tasks have the most affect on the project schedule Crucial tasks for project cost and duration can be different Crucial tasks for project cost and duration can be different
  • 36.
    Success Rate 05/07/14 2009Intaver Institute 36 A task can be canceled if it reaches a task or a project deadline or if it is affected by risk with a “Cancel task” outcome. Success rate is calculated based on number of times the task is not canceled Success rate is calculated based on number of times the task is not canceled
  • 37.
    Risk Chart 05/07/14 2009Intaver Institute 37 Risk chart show risks, associated with task versus duration or cost This task has low duration but high risk This task has low duration but high risk These tasks have balanced risk versus duration ratio. These tasks have balanced risk versus duration ratio.
  • 38.
    Risk Matrix 05/07/14 2009Intaver Institute 38 Risk matrix shows probability/impact on 5x5 matrix Double-click on a risk to view risk assignments Double-click on a risk to view risk assignments Risk Probability, Impact and Score for the current schedule Risk Probability, Impact and Score for the current schedule
  • 39.
    Risk Planning 05/07/14 2009Intaver Institute 39 Modeling risk mitigation efforts •Risk handling strategies •Transfer •Mitigate •Eliminate •Ignore •Risk mitigation efforts represent their own costs etc. which must be accounted for •Create multiple baselines that model pre and post mitigation risk handling efforts •View results of risk handling efforts •Select project alternative based on criteria (cost, duration, start and finish time, success rate)
  • 40.
    Future Reading Lev Virineand Michael Trumper Project Decisions: The Art and Science Management Concepts, Vienna, VA, 2007 Lev Virine and Michael Trumper Project Think: Why Good Managers Make Poor Project Choices Gower, 2013

Editor's Notes

  • #9 Why is this easy
  • #31 Risk register is central point of entry into risk analysis and management system Shows calculated project risk scores – ranks and identifies critical project risks. Add two screen shots. Risk Register Risk Assignment Add slide with Risk Mitigation Waterfall diagram with descriptive names
  • #32 Change to put calculated results in the Result Gantt chart
  • #34 Detailed results show certainty levels or the chance that a project parameter will be a certain value. Allows you to see the values e.g. managing at 75% certainty as well as setting buffers or contingencies.
  • #37 Calculates the success rates of tasks or project based upon deadlines or constraints