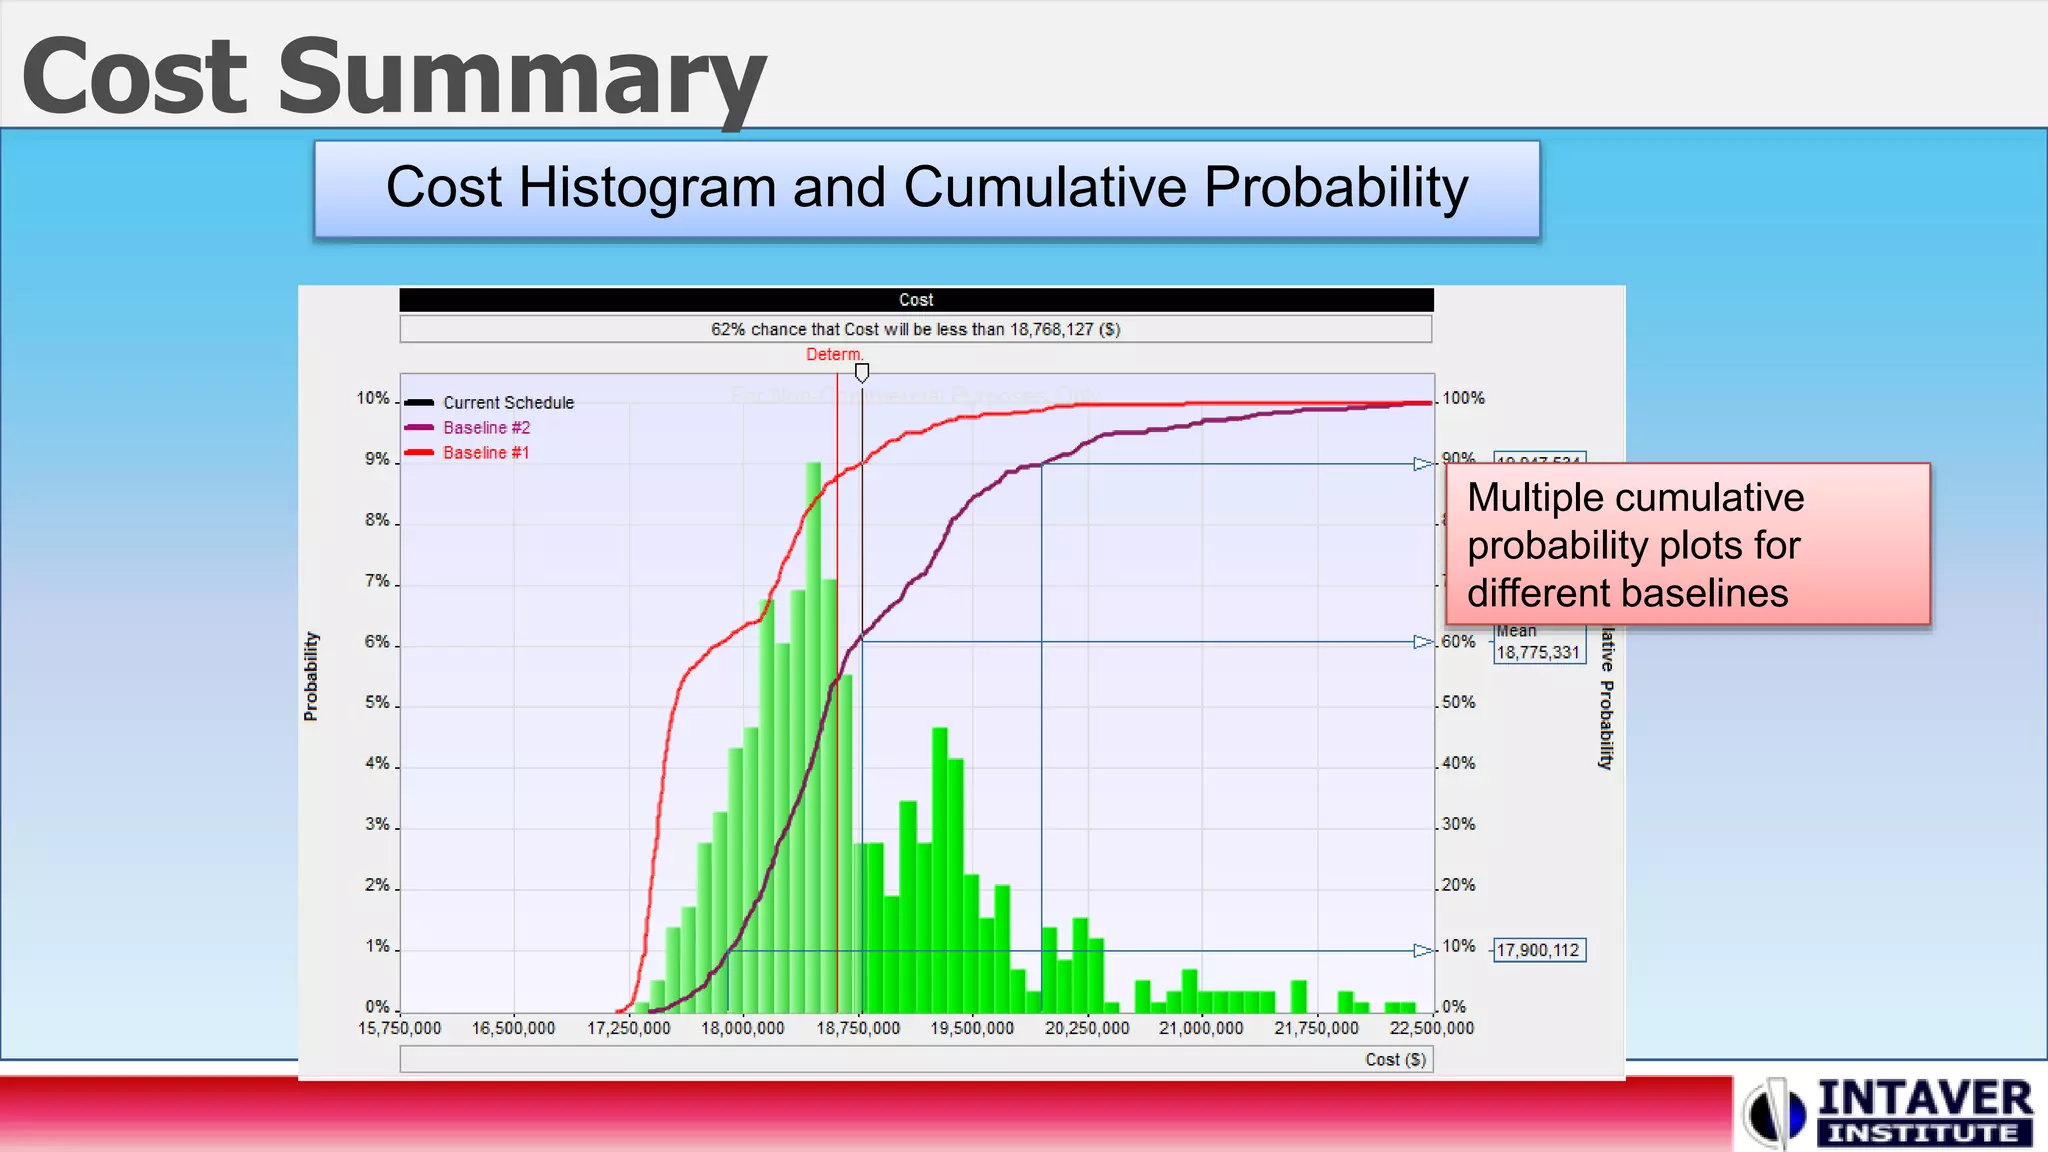
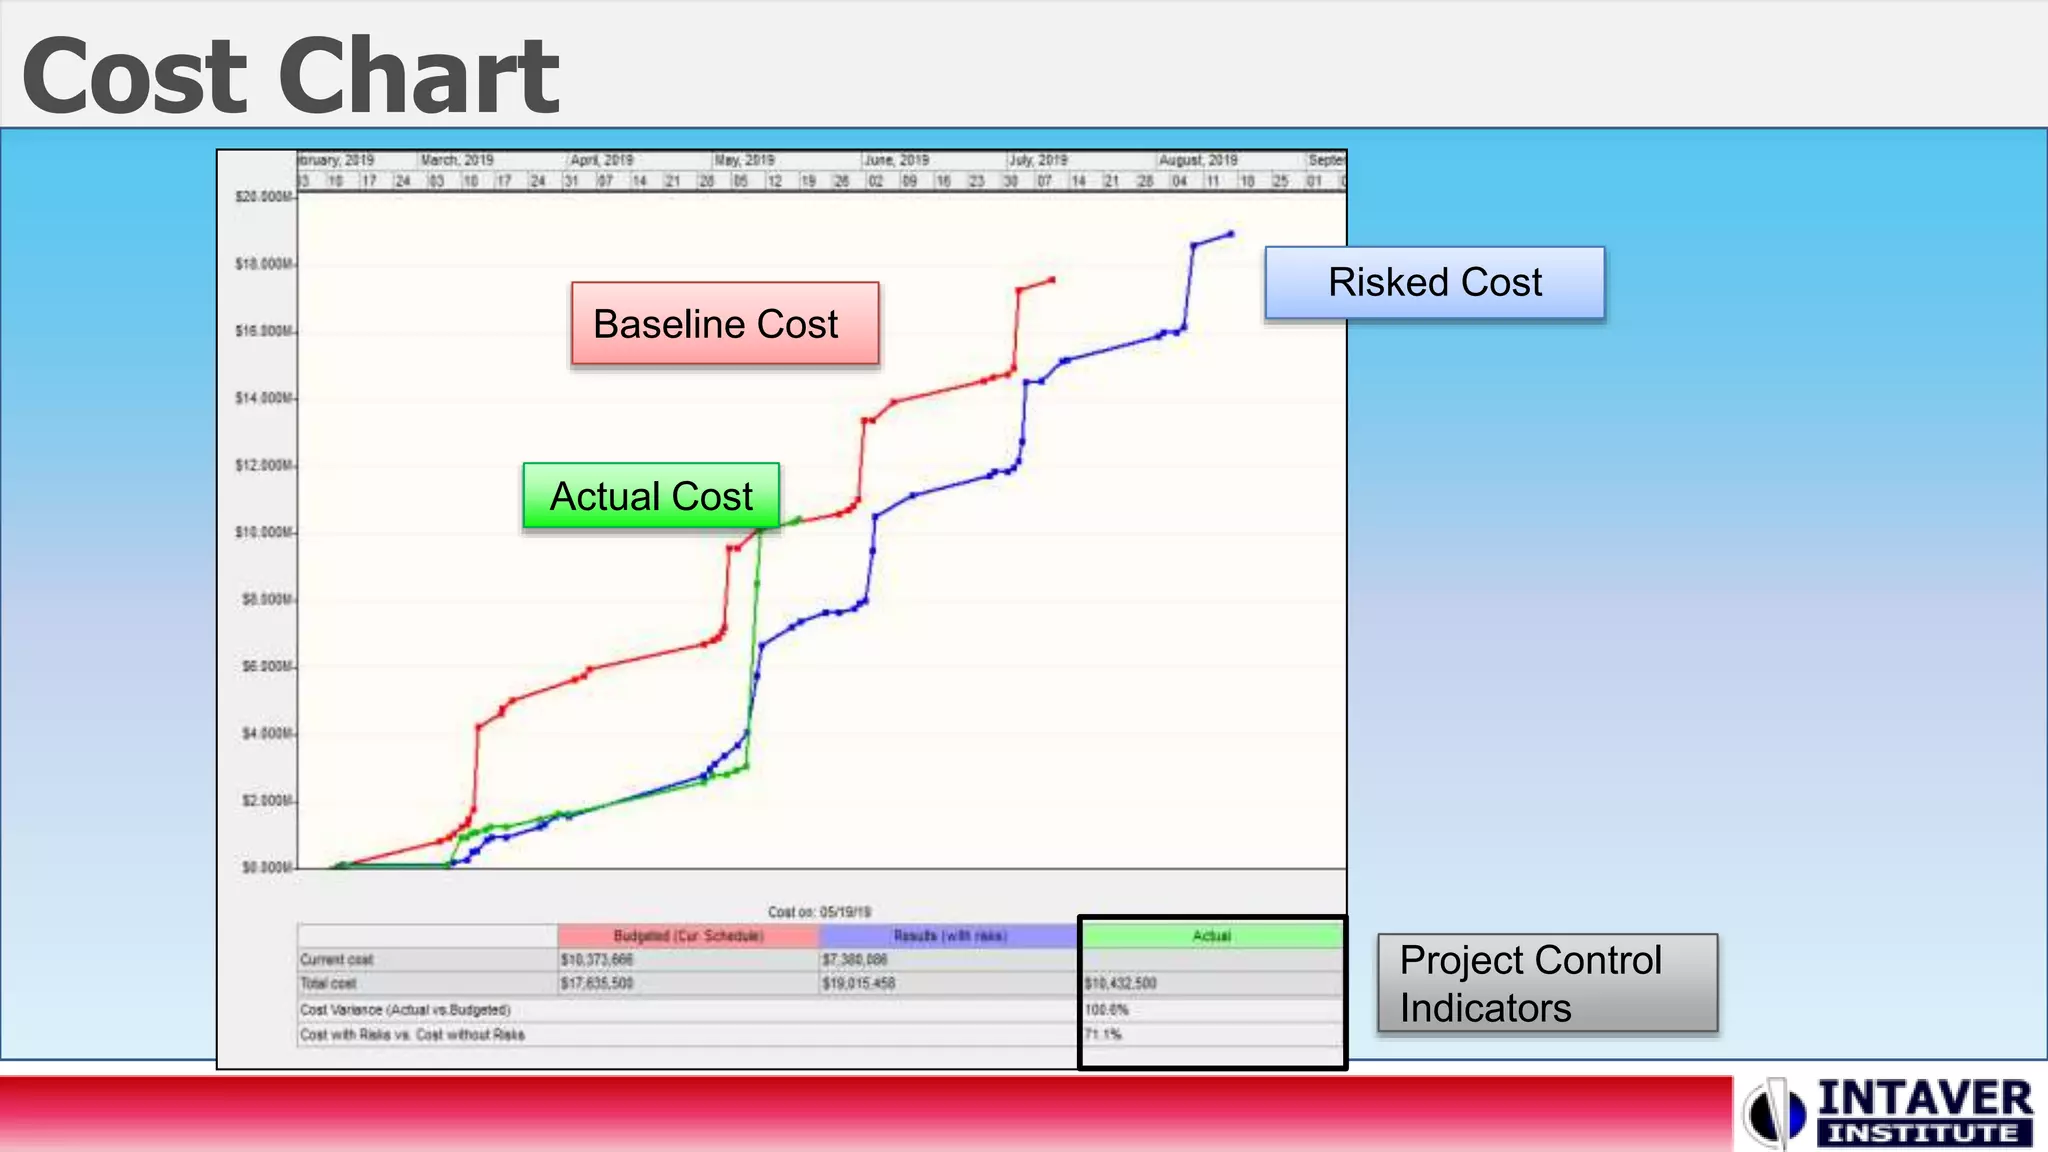
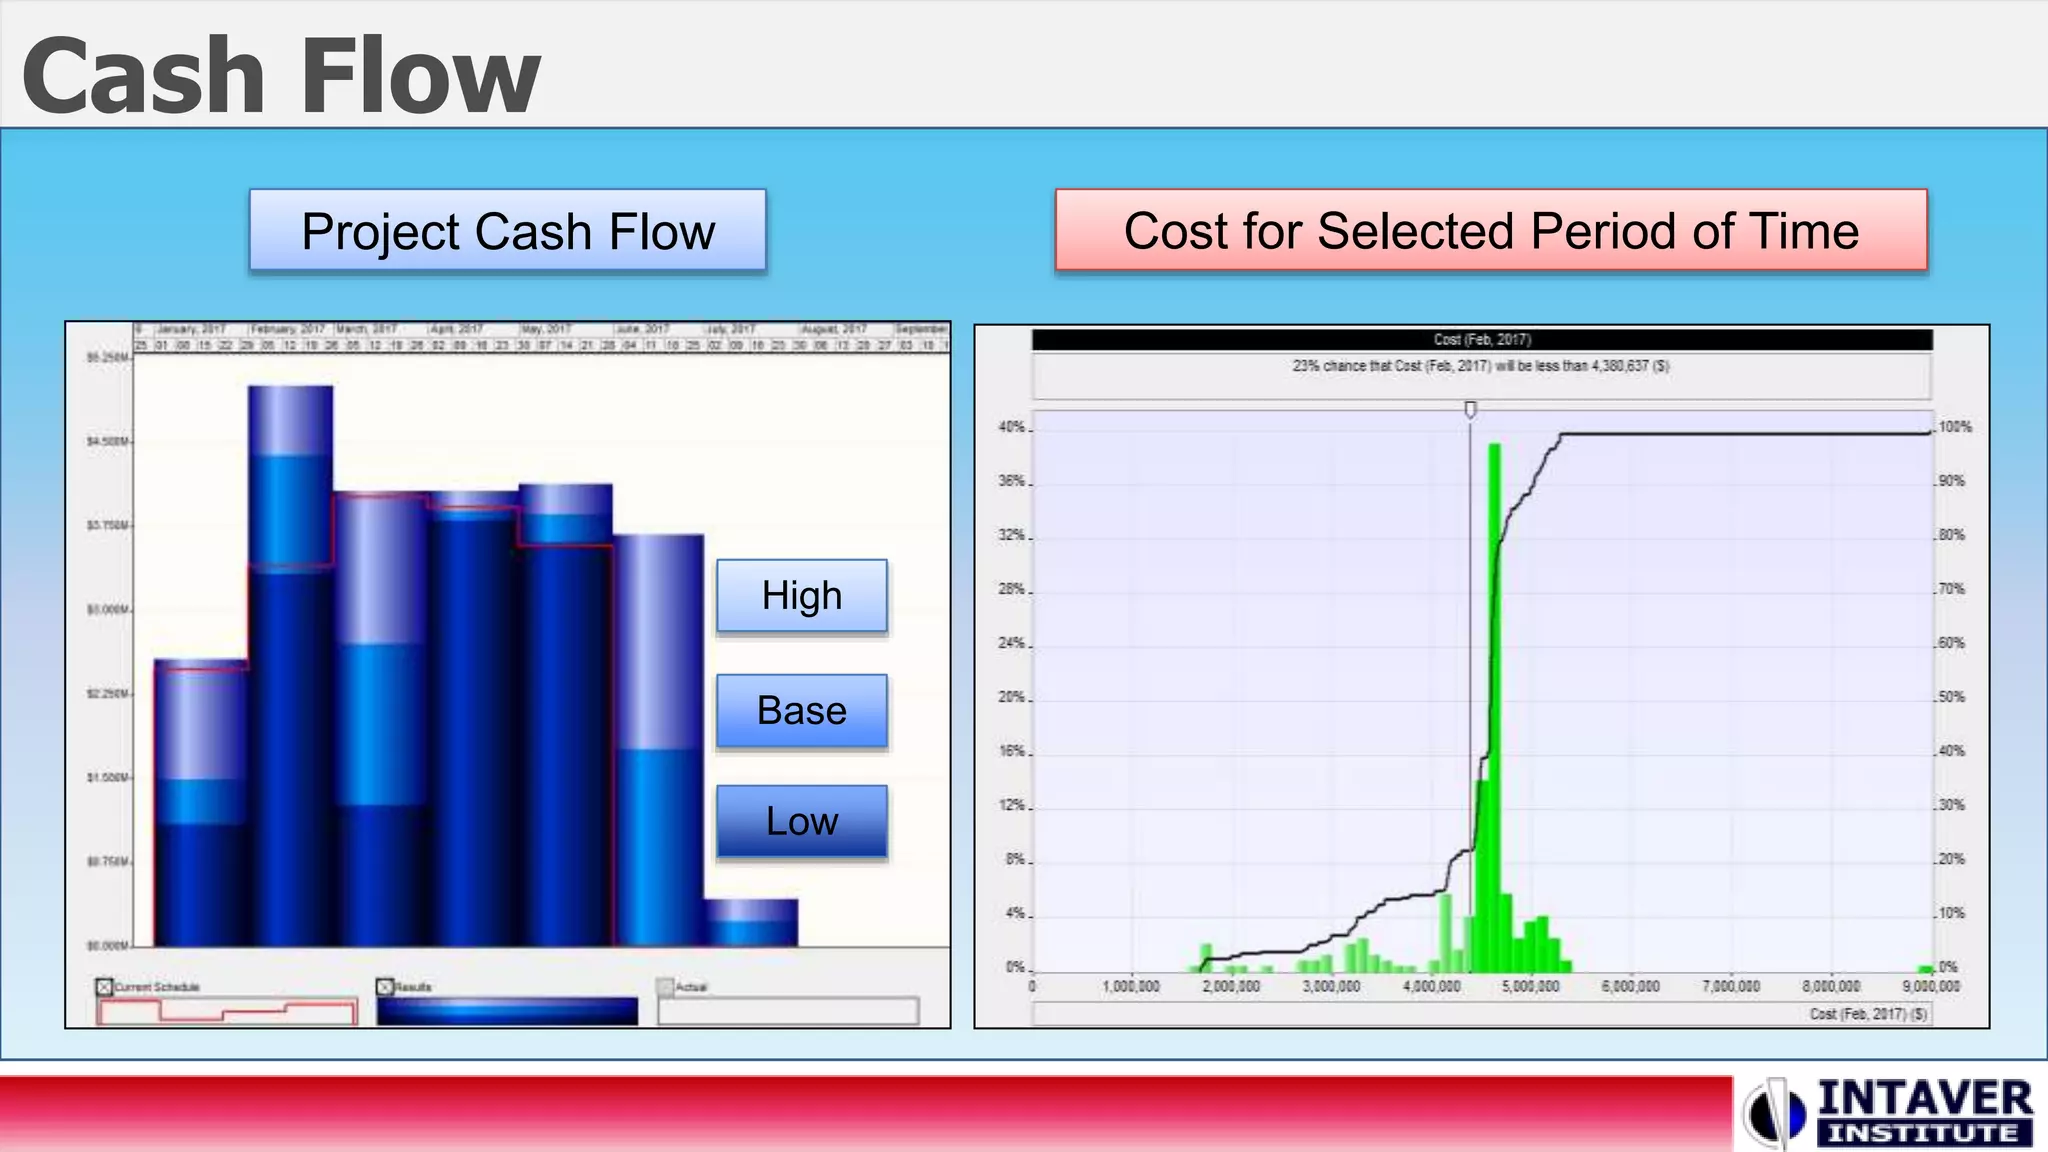
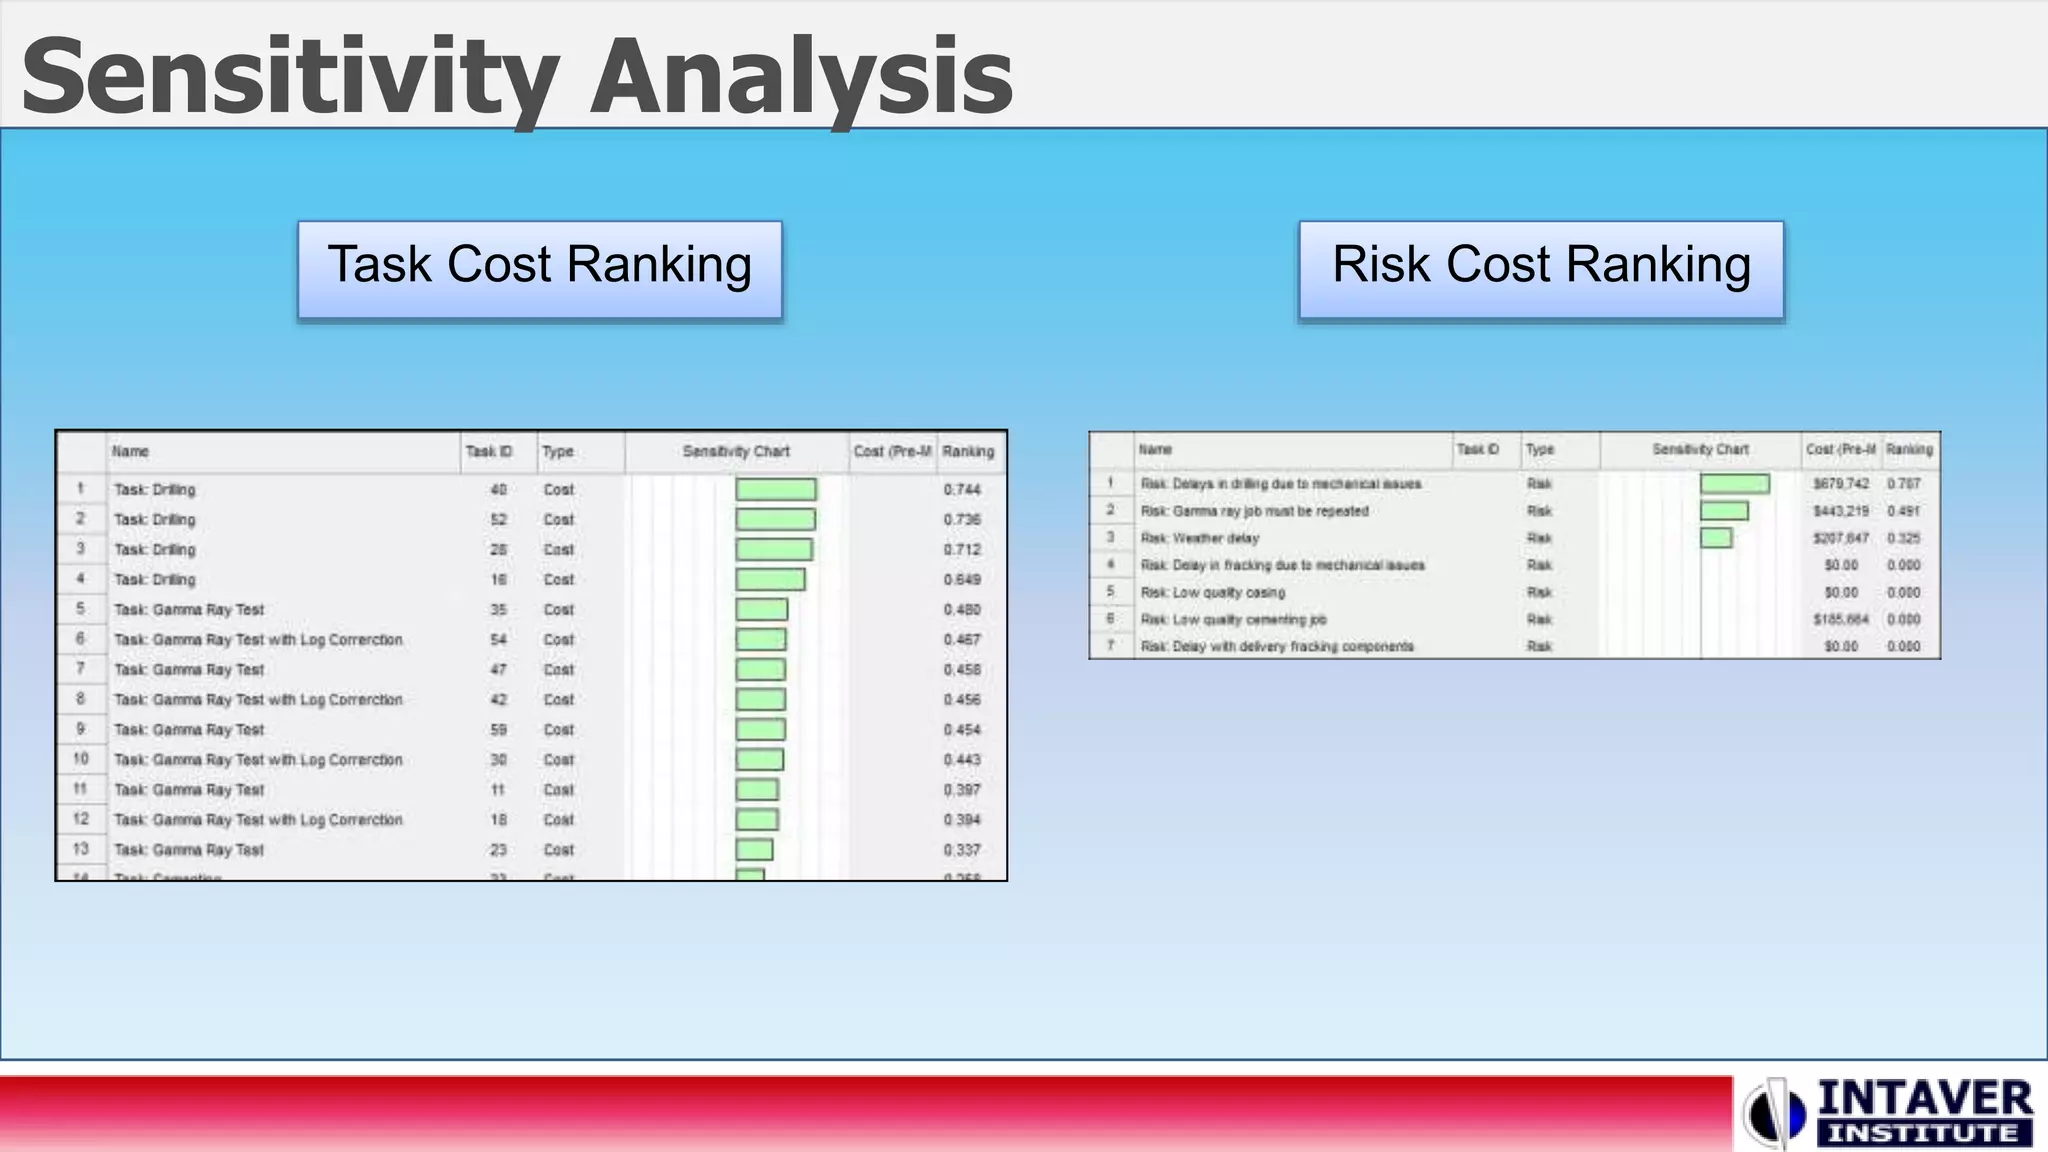
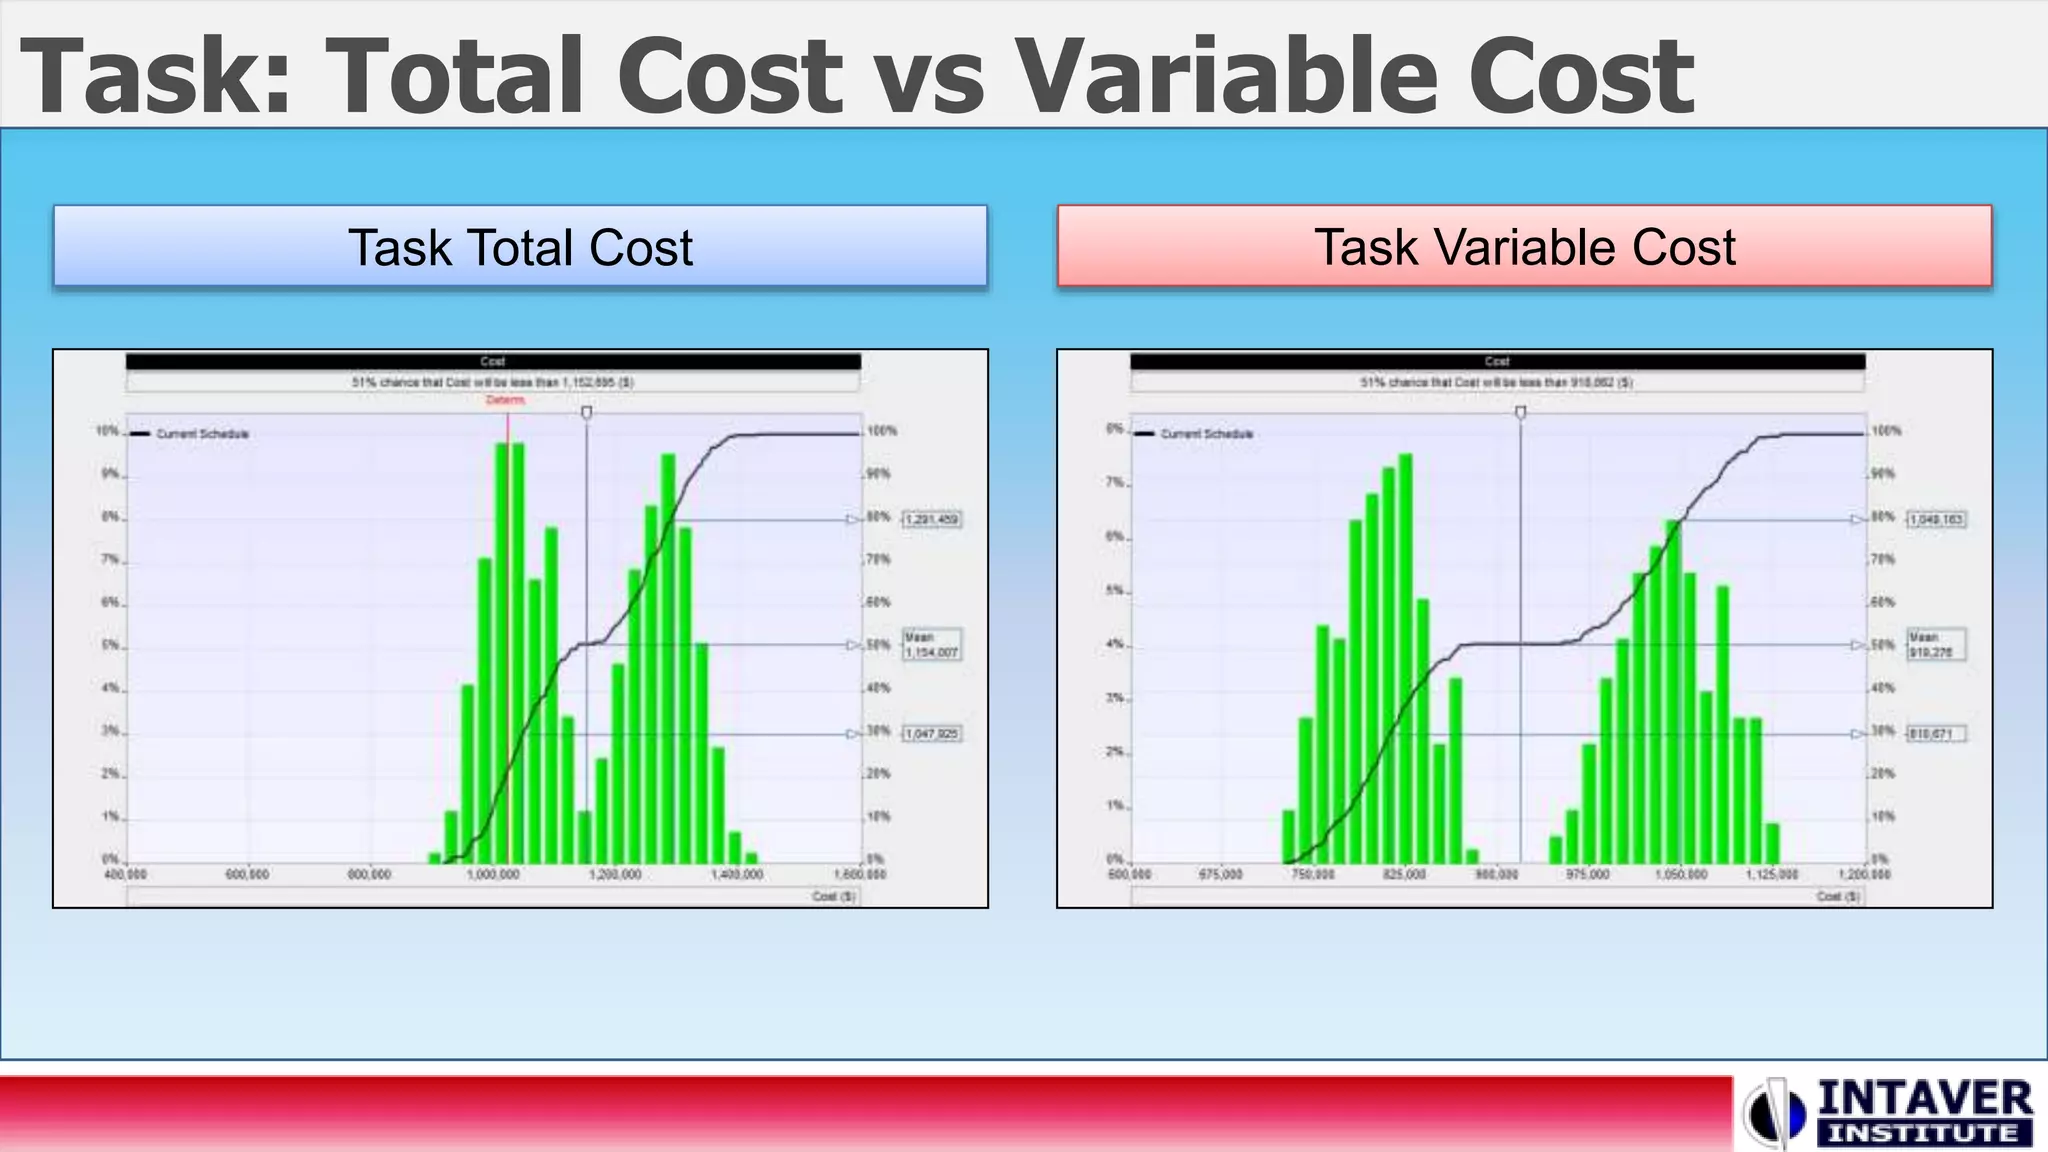
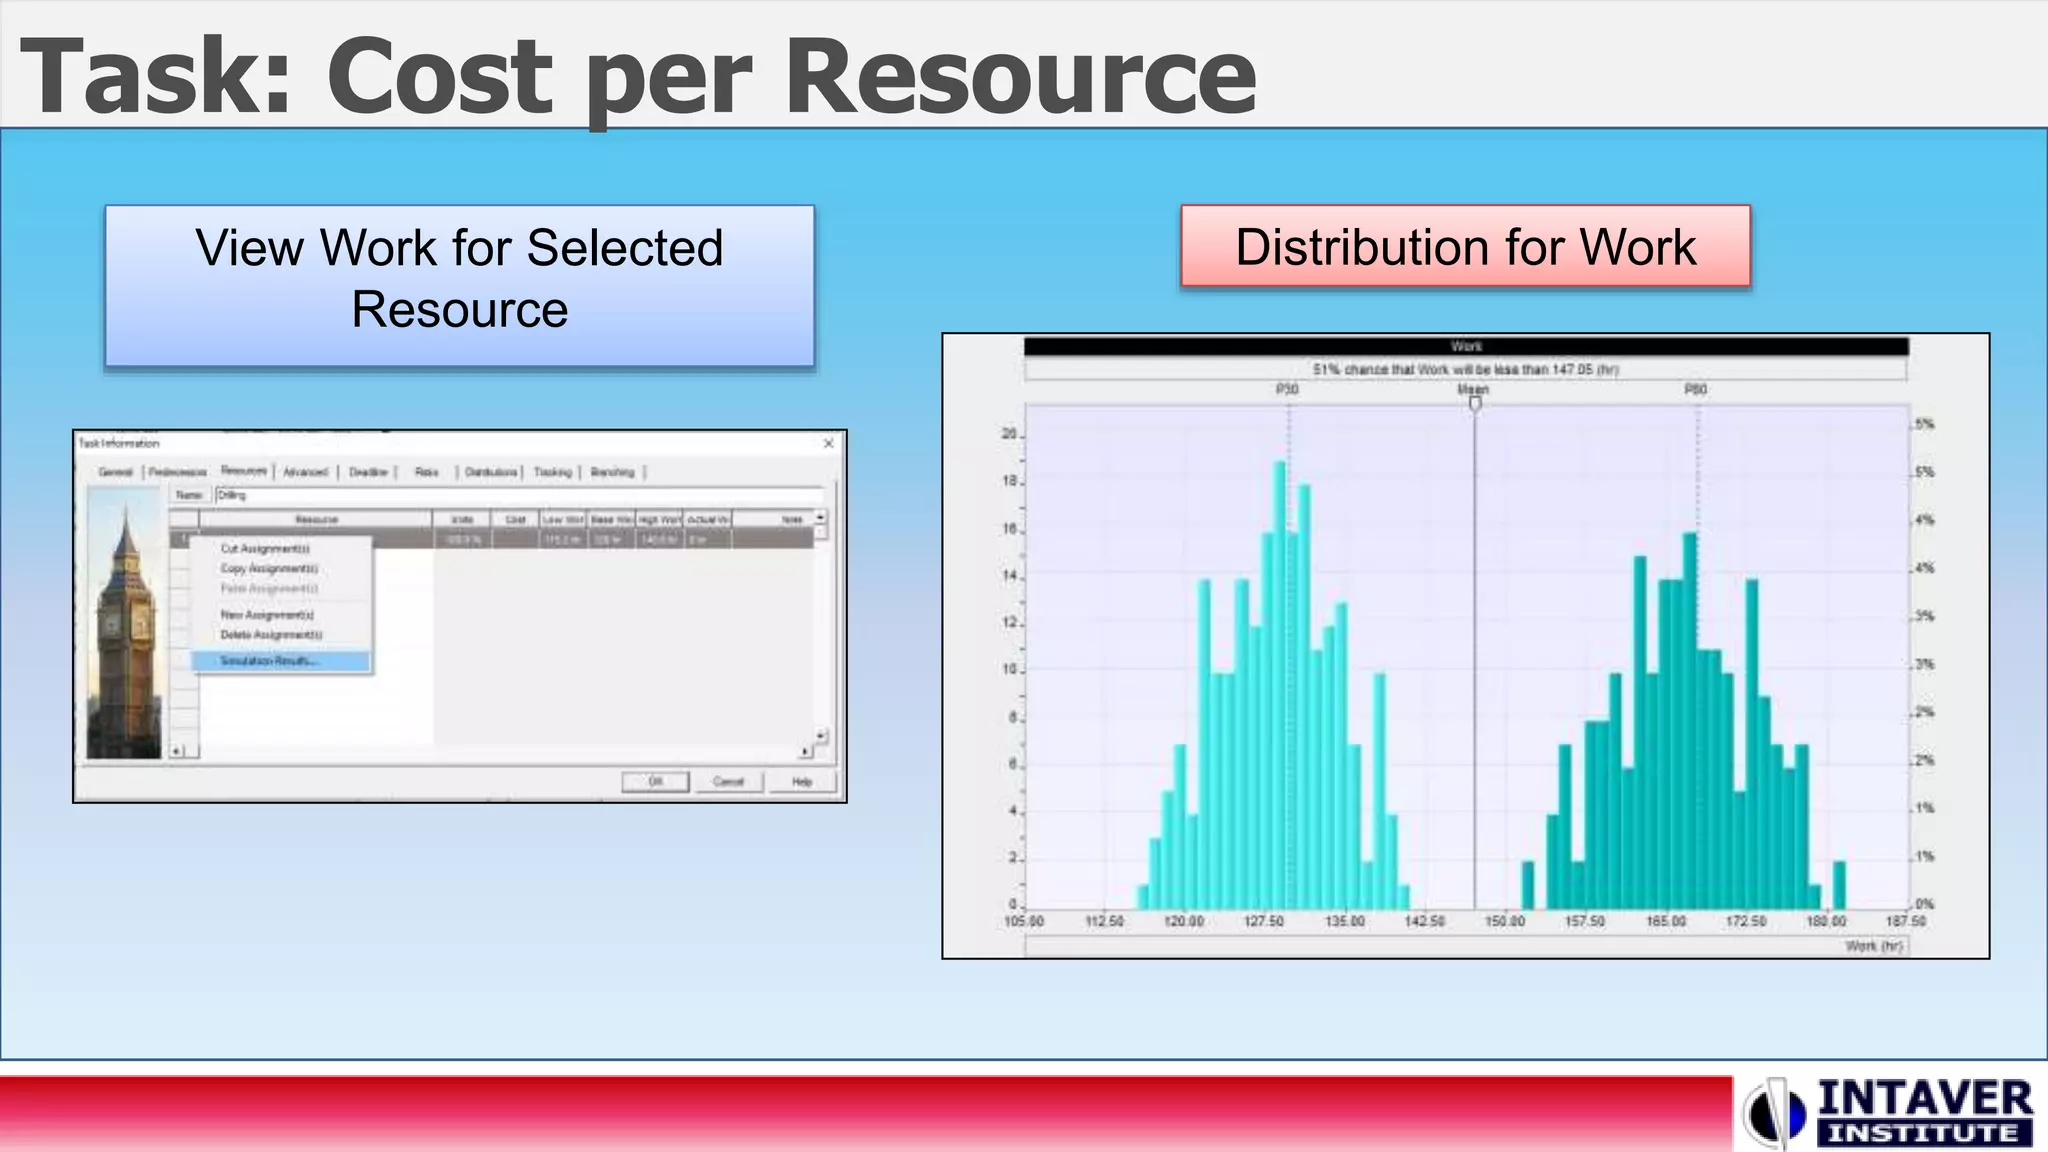
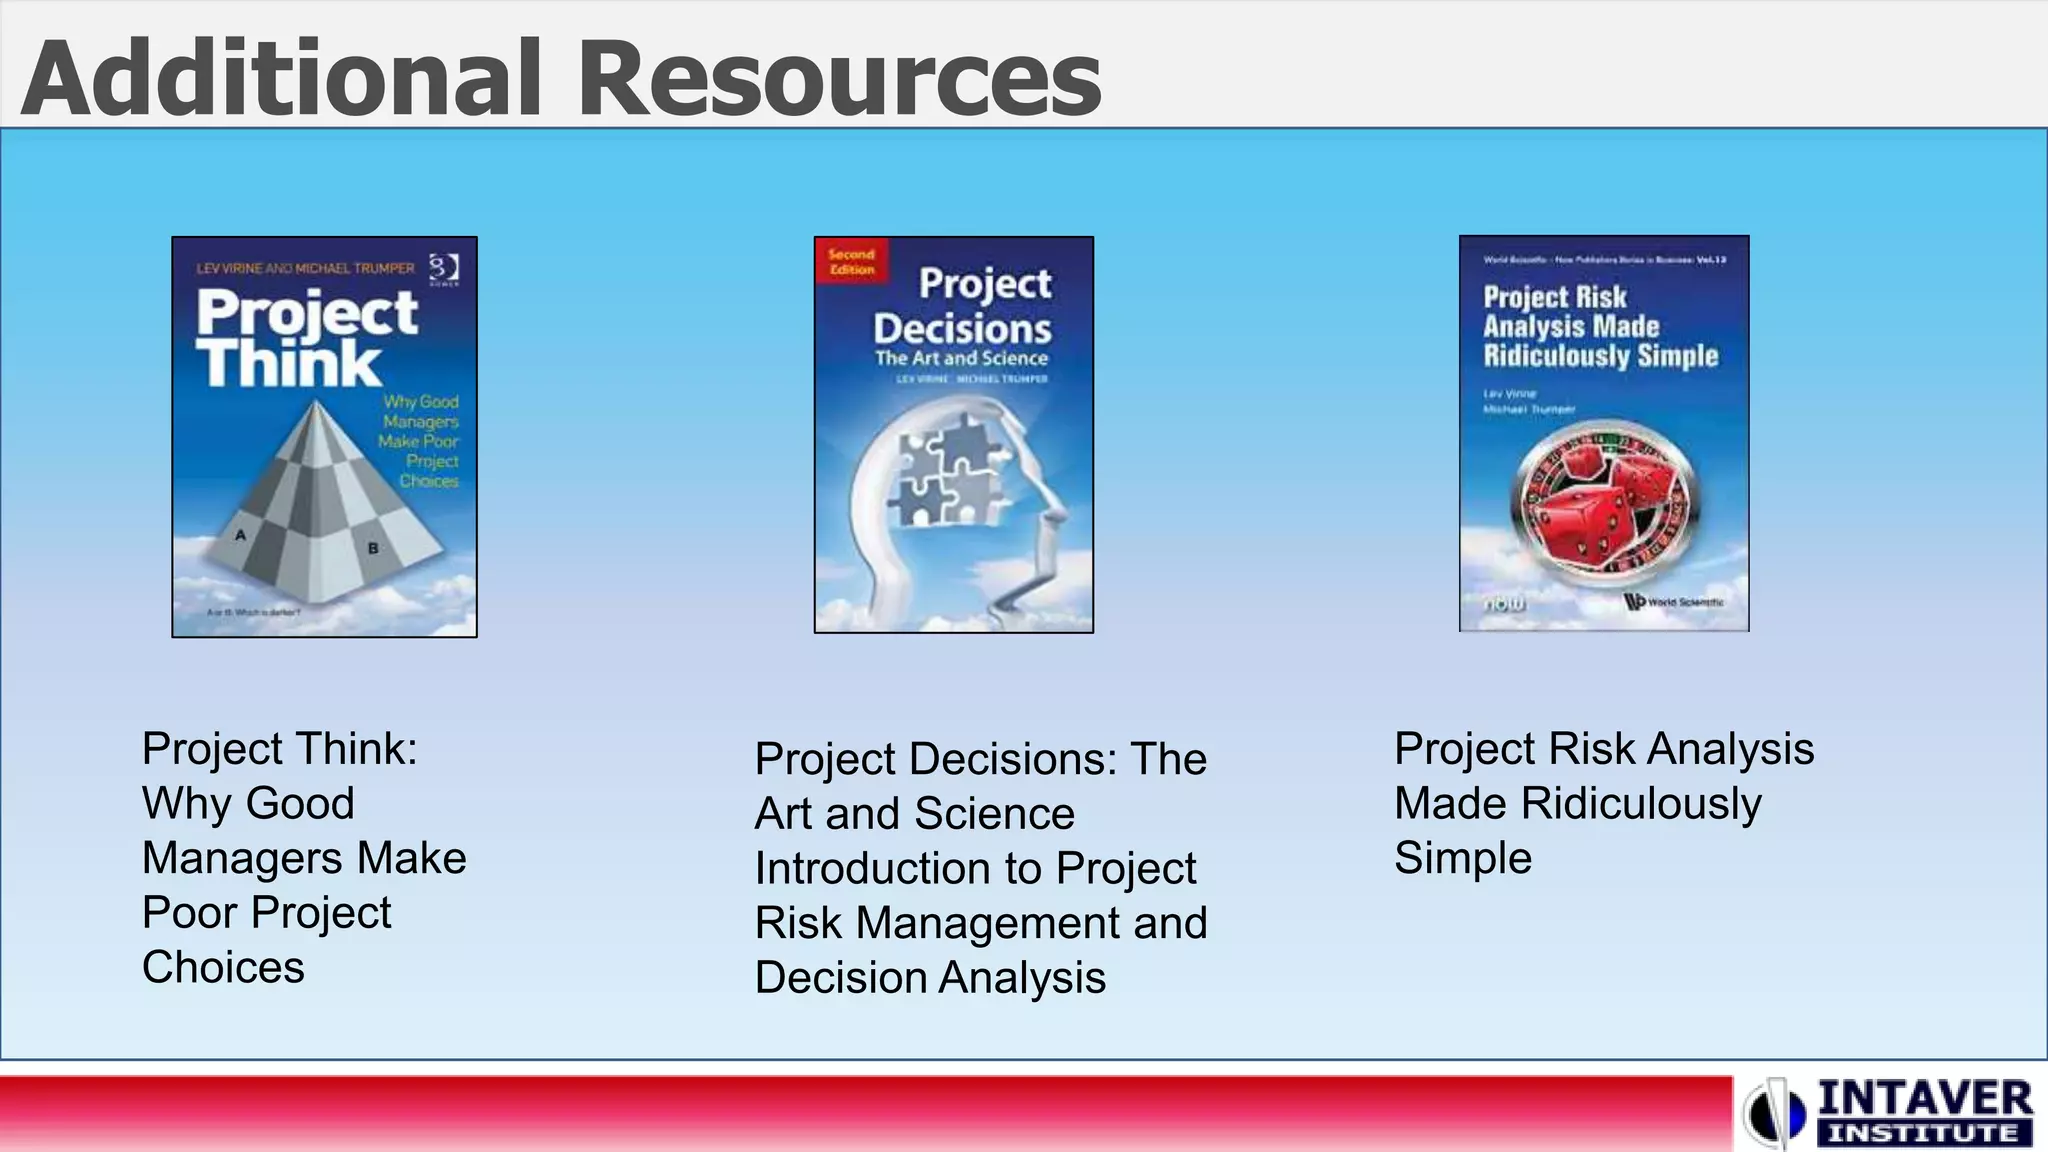
Monte Carlo Cost Risk
Analysis Reporting
Intaver Institute Inc.
400, 7015, Macleod Trail,
Calgary, AB, Canada
Tel: +1 (403) 692-2252
www.intaver.com
Cost Summary
Cost Histogram and Cumulative Probability
Multiple cumulative
probability plots for
different baselines
Cost Chart
Project Control
Indicators
Baseline Cost
Actual Cost
Risked Cost
Cash Flow
Project Cash Flow Cost for Selected Period of Time
Low
Base
High
Sensitivity Analysis
Task Cost Ranking Risk Cost Ranking
Task: Total Cost vs Variable Cost
Task Total Cost Task Variable Cost
Task: Cost per Resource
View Work for Selected
Resource
Distribution for Work
• White Papers and Articles: http://intaver.com/technology/articles-and-white-
papers/
• Online Tutorials: http://intaver.com/RiskyProjectTutorial
• Risk and Decision Analysis Books: http://www.projectdecisions.org
Contact Details
Michael Trumper
Intaver Institute Inc.
mtrumper@intaver.com
403.692.2252
Additional Resources
Project Think:
Why Good
Managers Make
Poor Project
Choices
Project Decisions: The
Art and Science
Introduction to Project
Risk Management and
Decision Analysis
Project Risk Analysis
Made Ridiculously
Simple

Project Cost Risk Analysis - Reporting

  • 1.
    Monte Carlo CostRisk Analysis Reporting Intaver Institute Inc. 400, 7015, Macleod Trail, Calgary, AB, Canada Tel: +1 (403) 692-2252 www.intaver.com
  • 2.
    Cost Summary Cost Histogramand Cumulative Probability Multiple cumulative probability plots for different baselines
  • 3.
  • 4.
    Cash Flow Project CashFlow Cost for Selected Period of Time Low Base High
  • 5.
    Sensitivity Analysis Task CostRanking Risk Cost Ranking
  • 6.
    Task: Total Costvs Variable Cost Task Total Cost Task Variable Cost
  • 7.
    Task: Cost perResource View Work for Selected Resource Distribution for Work
  • 8.
    • White Papersand Articles: http://intaver.com/technology/articles-and-white- papers/ • Online Tutorials: http://intaver.com/RiskyProjectTutorial • Risk and Decision Analysis Books: http://www.projectdecisions.org Contact Details Michael Trumper Intaver Institute Inc. mtrumper@intaver.com 403.692.2252 Additional Resources
  • 9.
    Additional Resources Project Think: WhyGood Managers Make Poor Project Choices Project Decisions: The Art and Science Introduction to Project Risk Management and Decision Analysis Project Risk Analysis Made Ridiculously Simple

Editor's Notes

  • #2 Welcome to Intaver Institutes video : Monte Carlo Cost Risk Analysis Reporting. We are going to be taking a look at the various analysis and reporting views that are available to assess project cost risk.
  • #3 After running a Monte Carlo simulation, two of the most popular reports are histograms and cumulative probability. In this particular example we have a combined histogram and cumulative probability chart. On the left Y axis is the probability. We can see that the most likely value occurs 9% of the time. On the right Y axis is the cumulative probability values with markers placed at 10 percentile, Mean, and 90 percentile. Cumulative probability is useful for setting cost contingency, which would be the difference between the Deterministic value (the red line) and a cumulative probability with a higher confidence level such as P80. In addition, we can plot multiple cost scenarios representing different risk management strategies as cumulative probability plots. In this particular view we are looking a a pre and post mitigated baselines.
  • #4 The Cost Chart provides a view of the forecasted cost of a project over time for deterministic and risked costs. As we can see, because the project has a high probability of running longer it will cost more. If there are actual costs, they are will be plotted on the chart and project cost control indicators are displayed at the bottom right.
  • #5 The Cash Flow chart shows probabilistic cash flow over set periodicity (Months, Bi-Monthly, Quarterly or Annually). In this particular view, we can see that for the period of February, there is a high probability that costs will be well above the current forecast due to risk. In addition, we can see that because of delays, the project should expect to experience two additional months of costs. Because February shows a large jump in expected cash flow, we can take a look a detailed view of the probabilistic cash flow for that particular period. The large spike on the right is due to a probability of a critical risk occuring.
  • #6 Sensitivity analysis or Tornado charts provides insight into which tasks or risks have the most potential to drive costs in the project. On the left we have a list of tasks ranked by how much their risks and uncertainties impact the cost of the project. On the right, we have a similar ranking of risks. It is extremely likely that the highest ranked risks are assigned to the highest ranked activities. To minimize potential cost overruns, we need to focus our risk management efforts on these tasks and risks.
  • #7 In the previous views we have been looking at project level analysis, however, it is possible to drill down to the activity level to view the cost analysis. On the left, the chart shows us probabilistic total task costs. Of note the histogram is bimodal, which shows two distinct distributions. The one on the left is due to uncertainty or natural variance and the second to the right is due to a serious risk event occurring. The chart on the right shows similar results but for resource costs. In this chart the second distribution is even more distinct so that we know that the risk is tightly correlated with the resources allocated to this activity.
  • #8 If we would like to further investigate the source, we can look at the specific variable work (and therefore costs) for each resource allocated to a specific tasks. This particular view which is very tightly correlated with the previous results would indicate that in order to control costs, we would need to focus on this particular resource as being the root cause of the predicted cost overruns in this activity.
  • #9 Thank you for watching our video on Monte Carlo Cost Risk Analysis Reporting. Please visit our site at intaver.com to learn more about risk analysis and our upcoming videos and webinars.
  • #10 If you are interested in finding out more about Decision Analysis and Risk Management a list of our publications and a variety of resources can be found at our website Project Decisions.org