Download to read offline


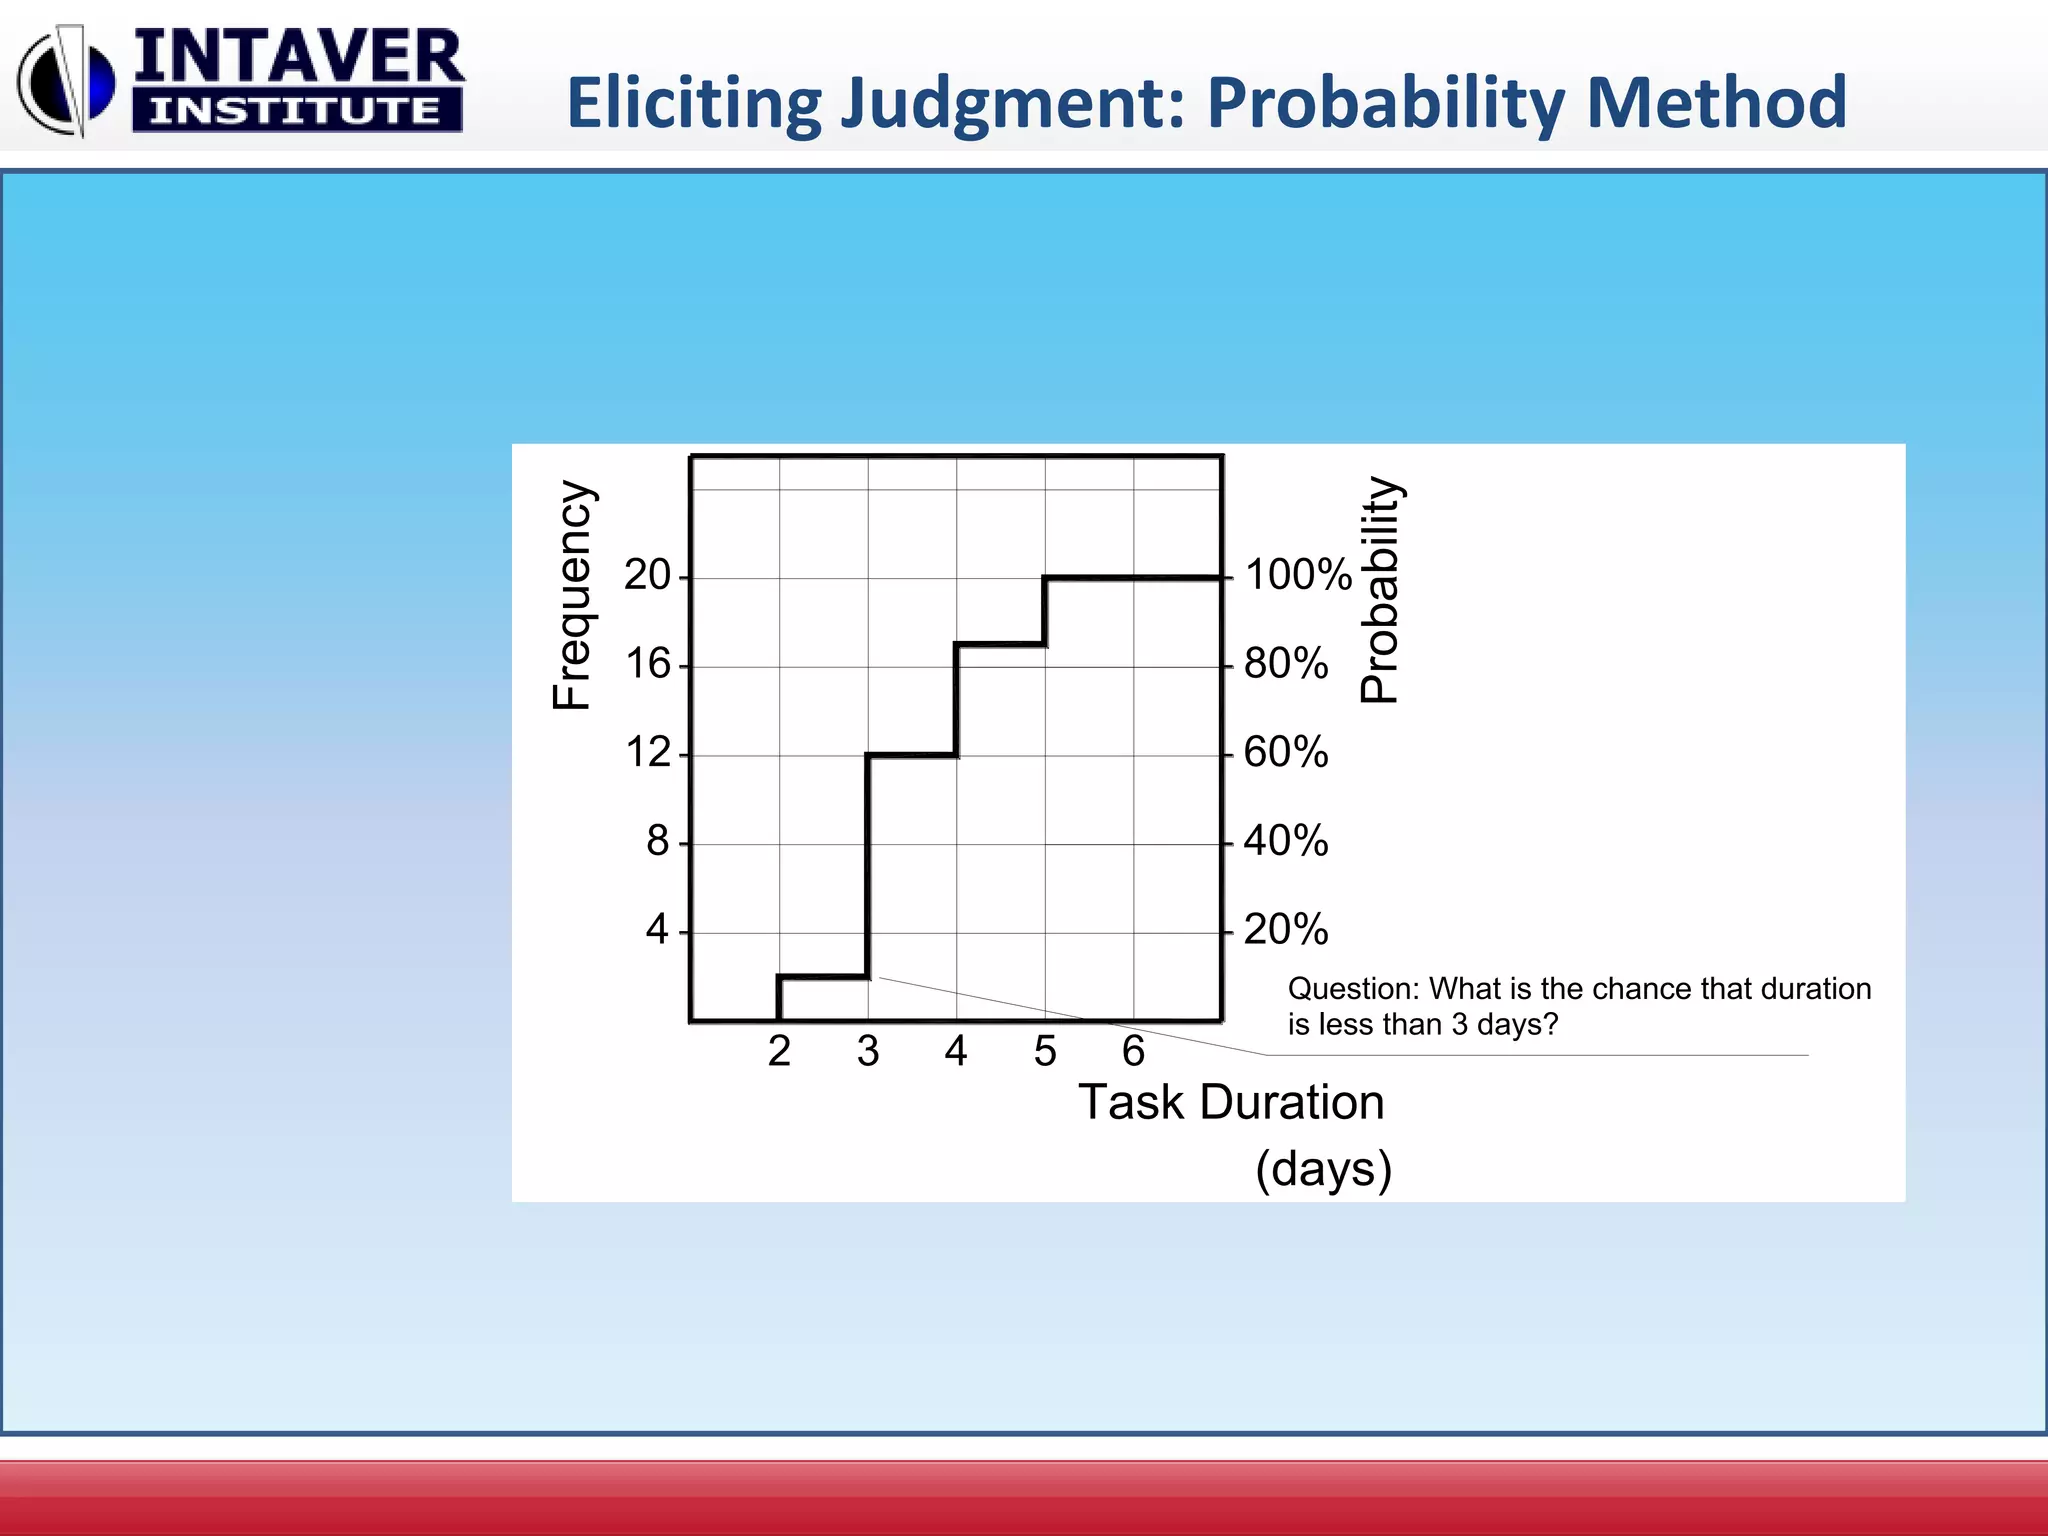
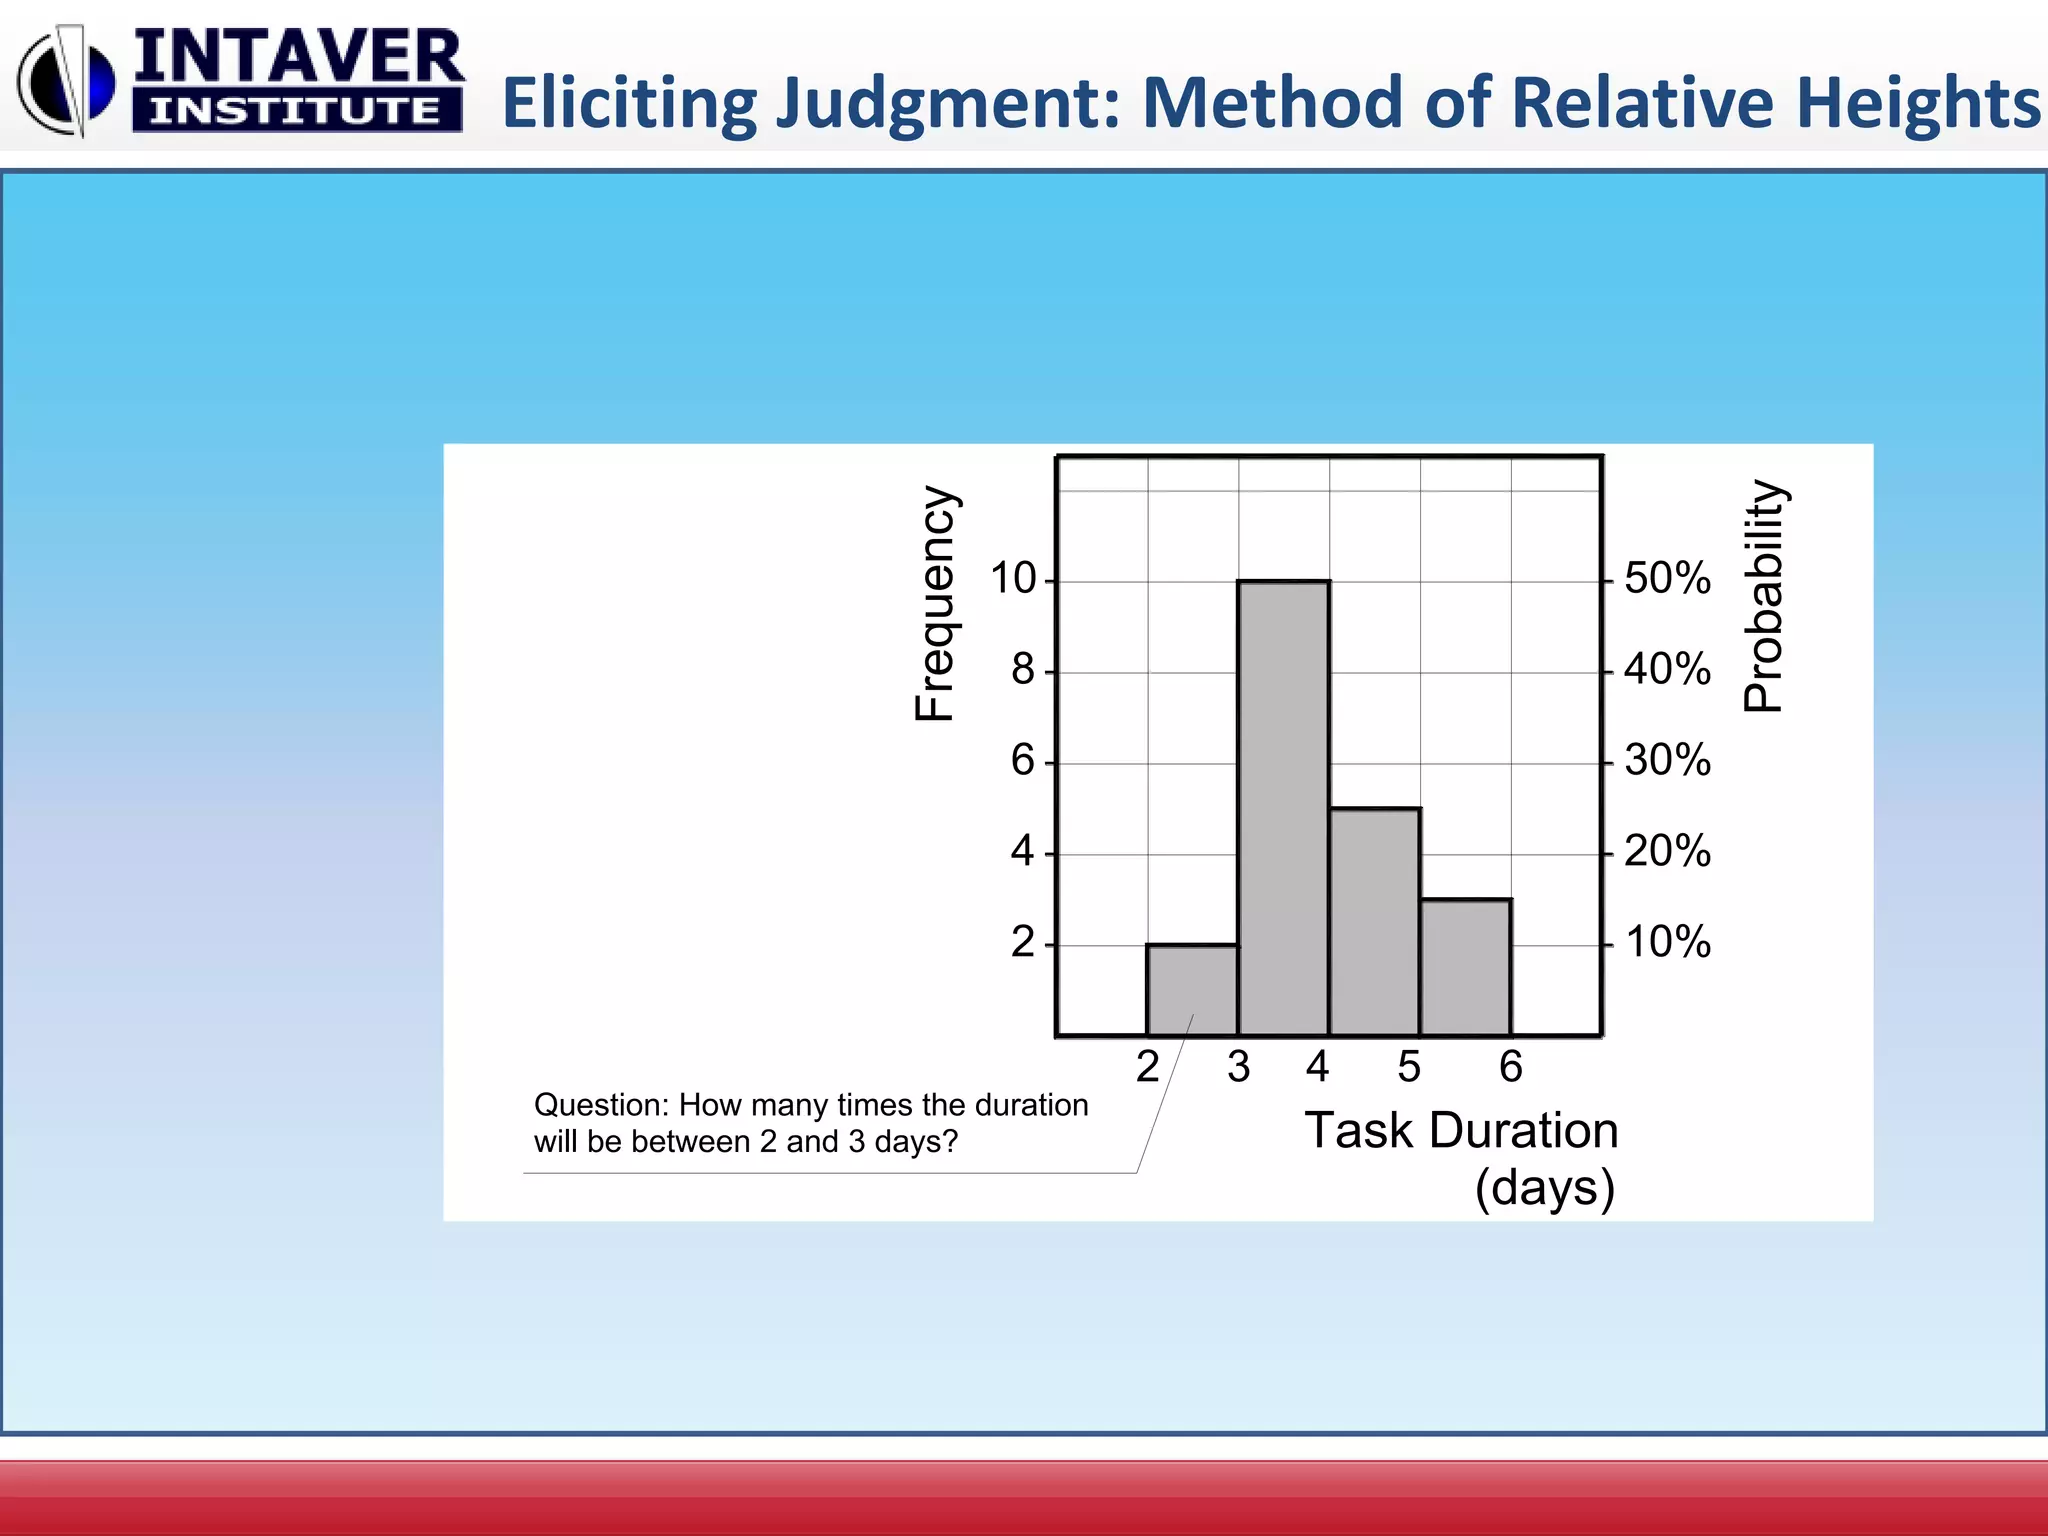

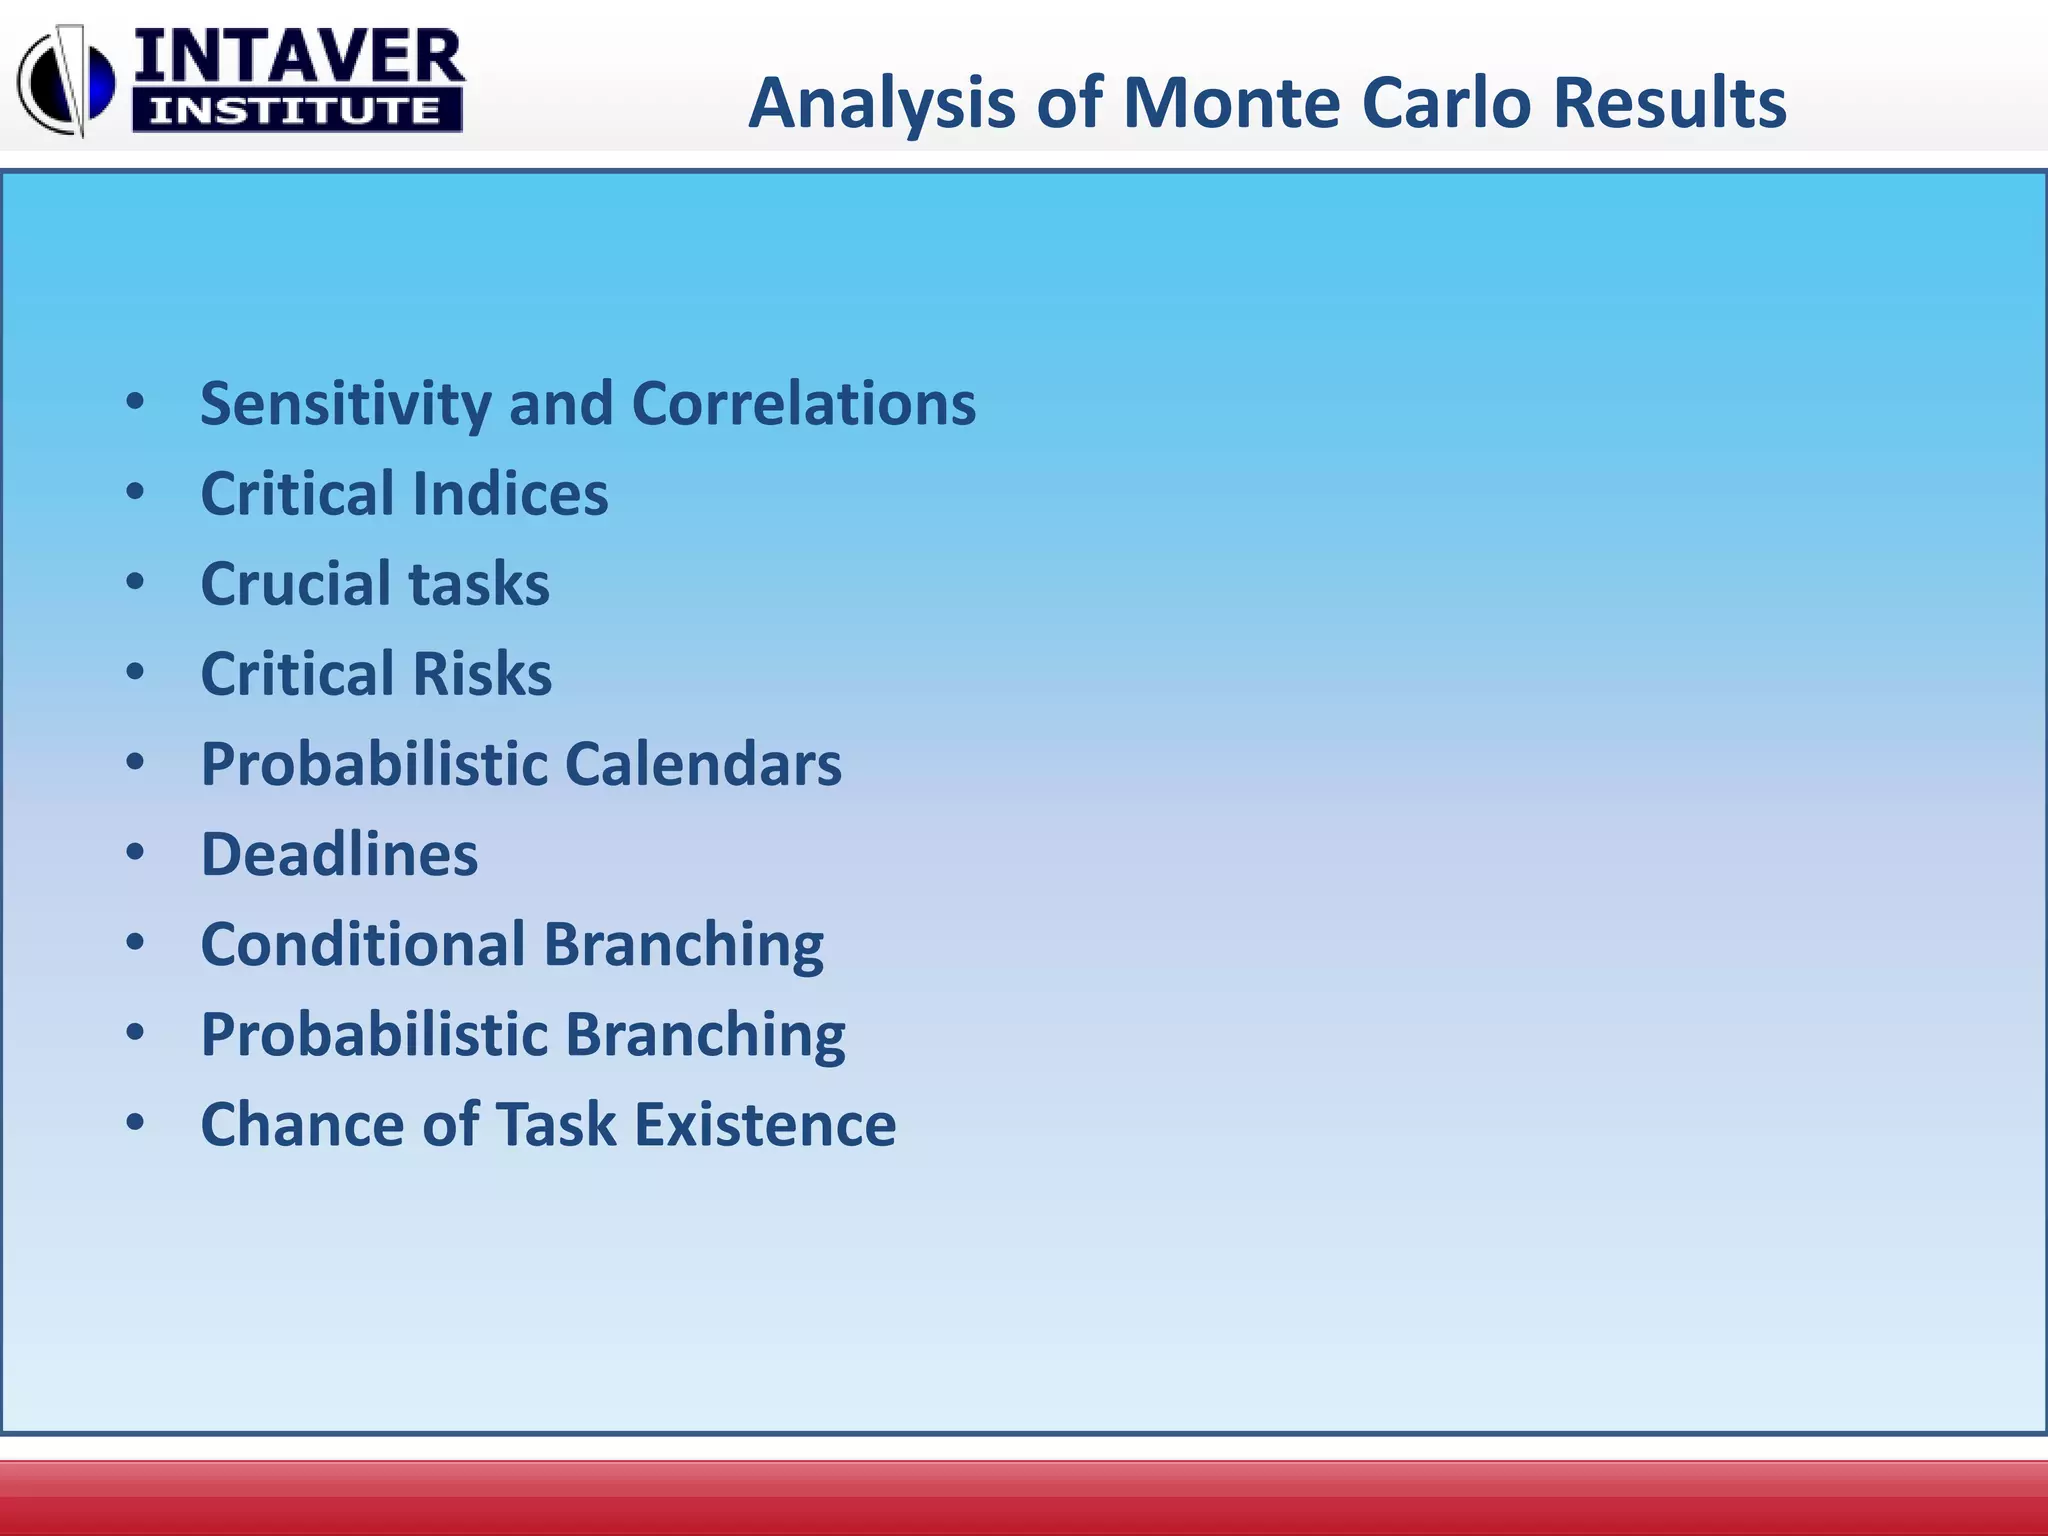
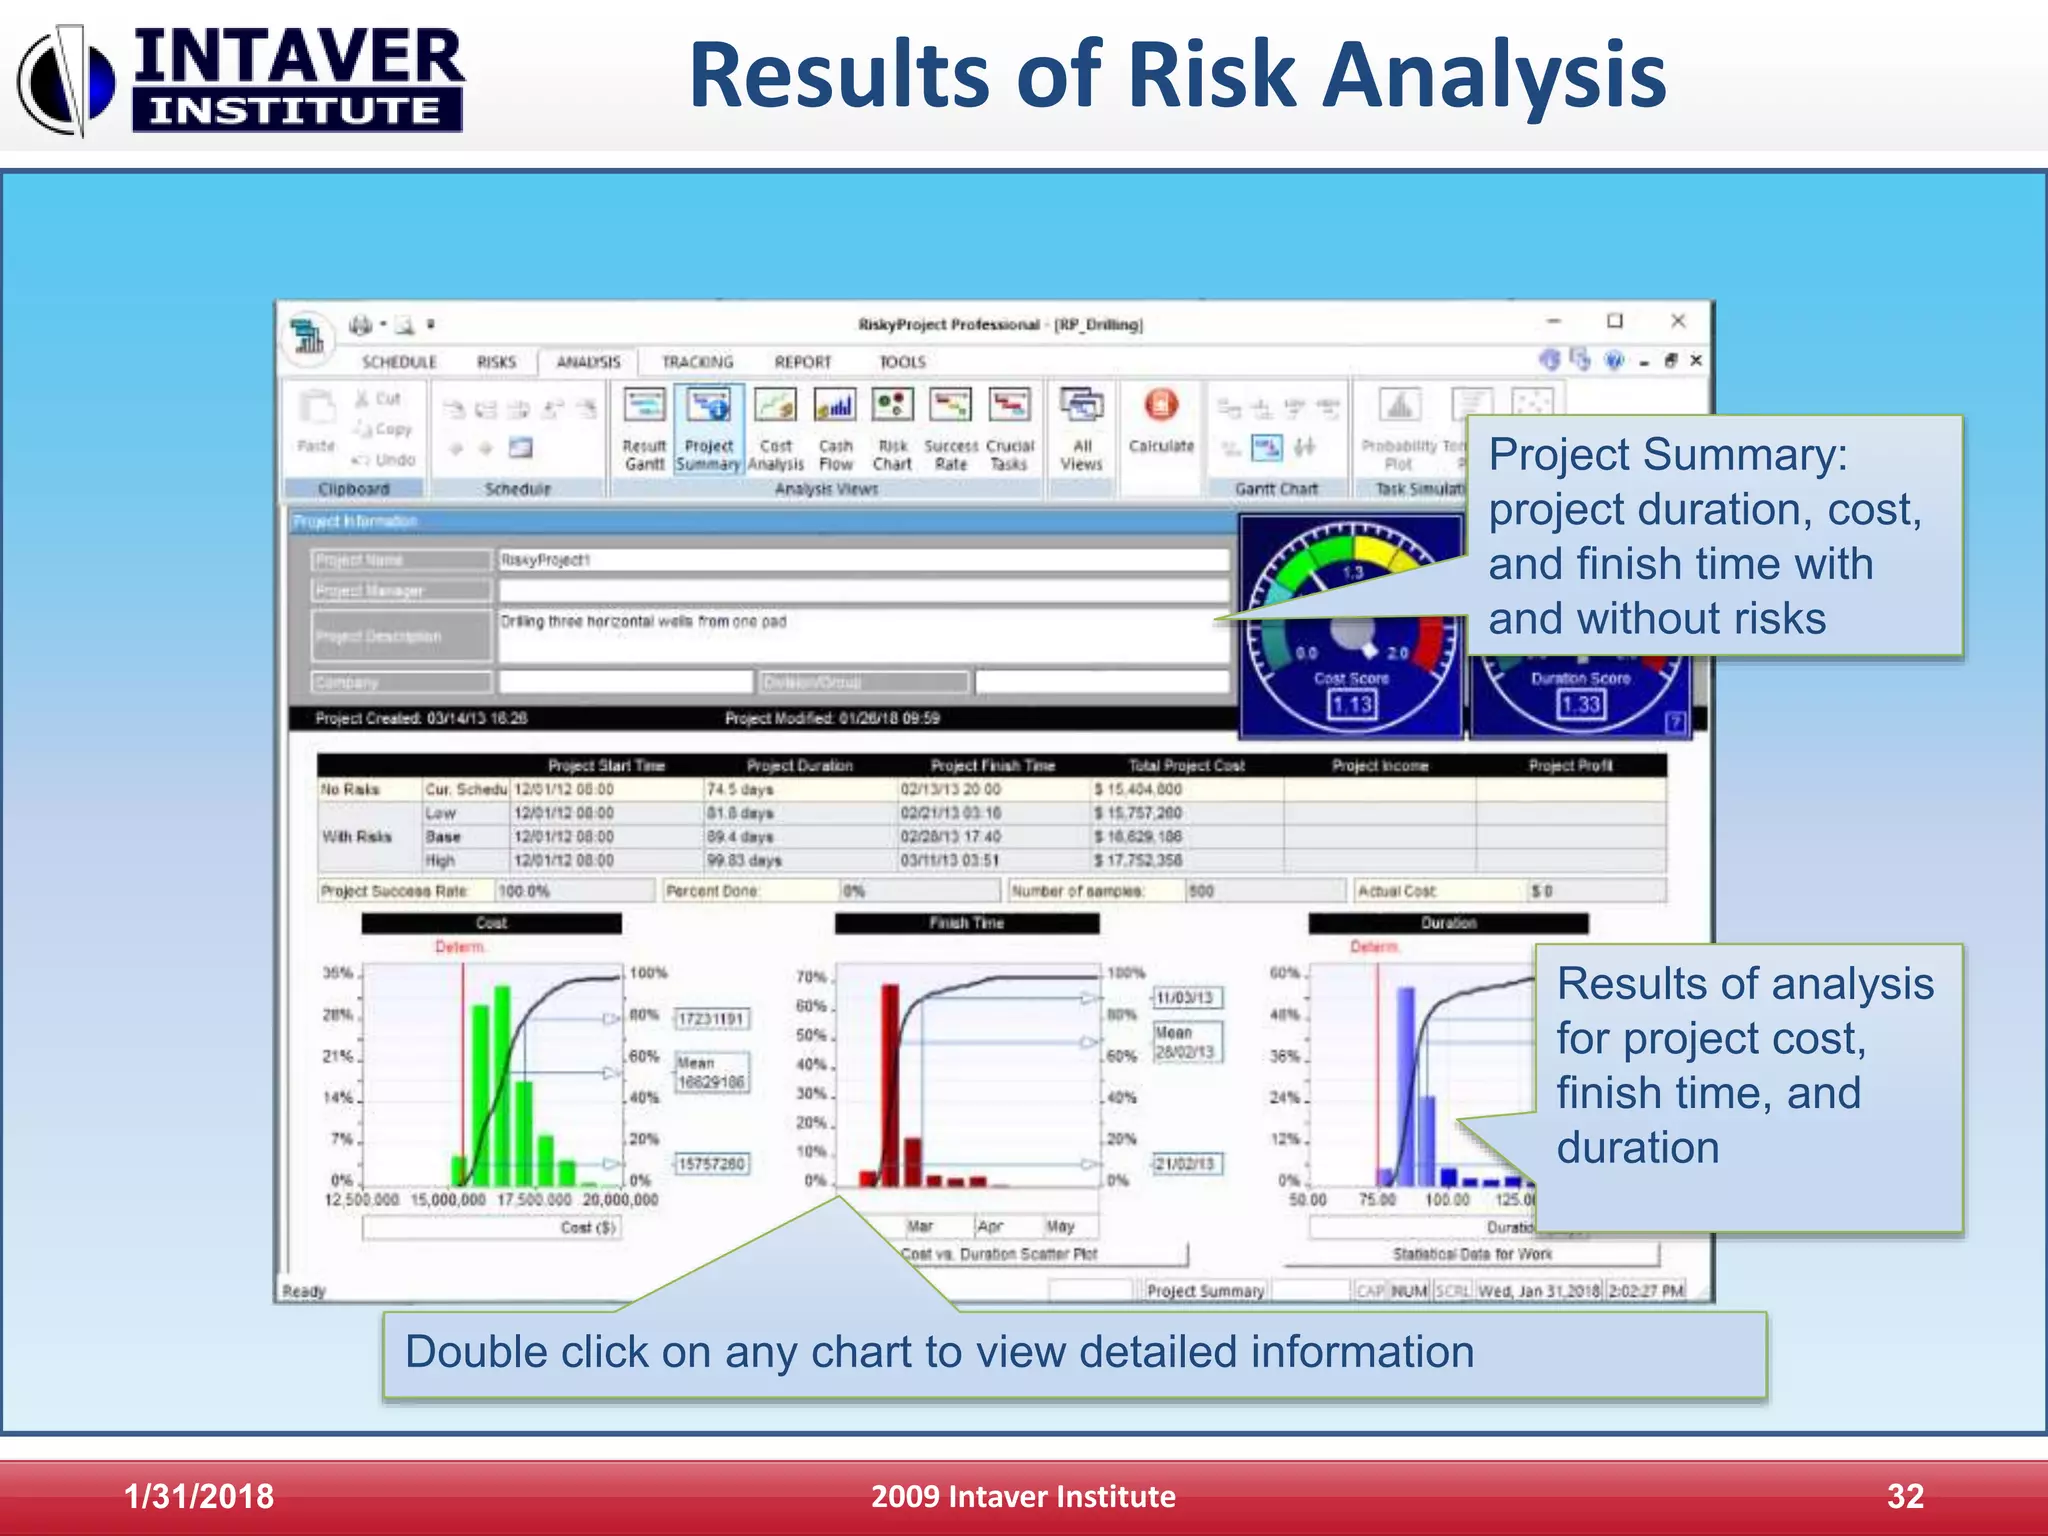

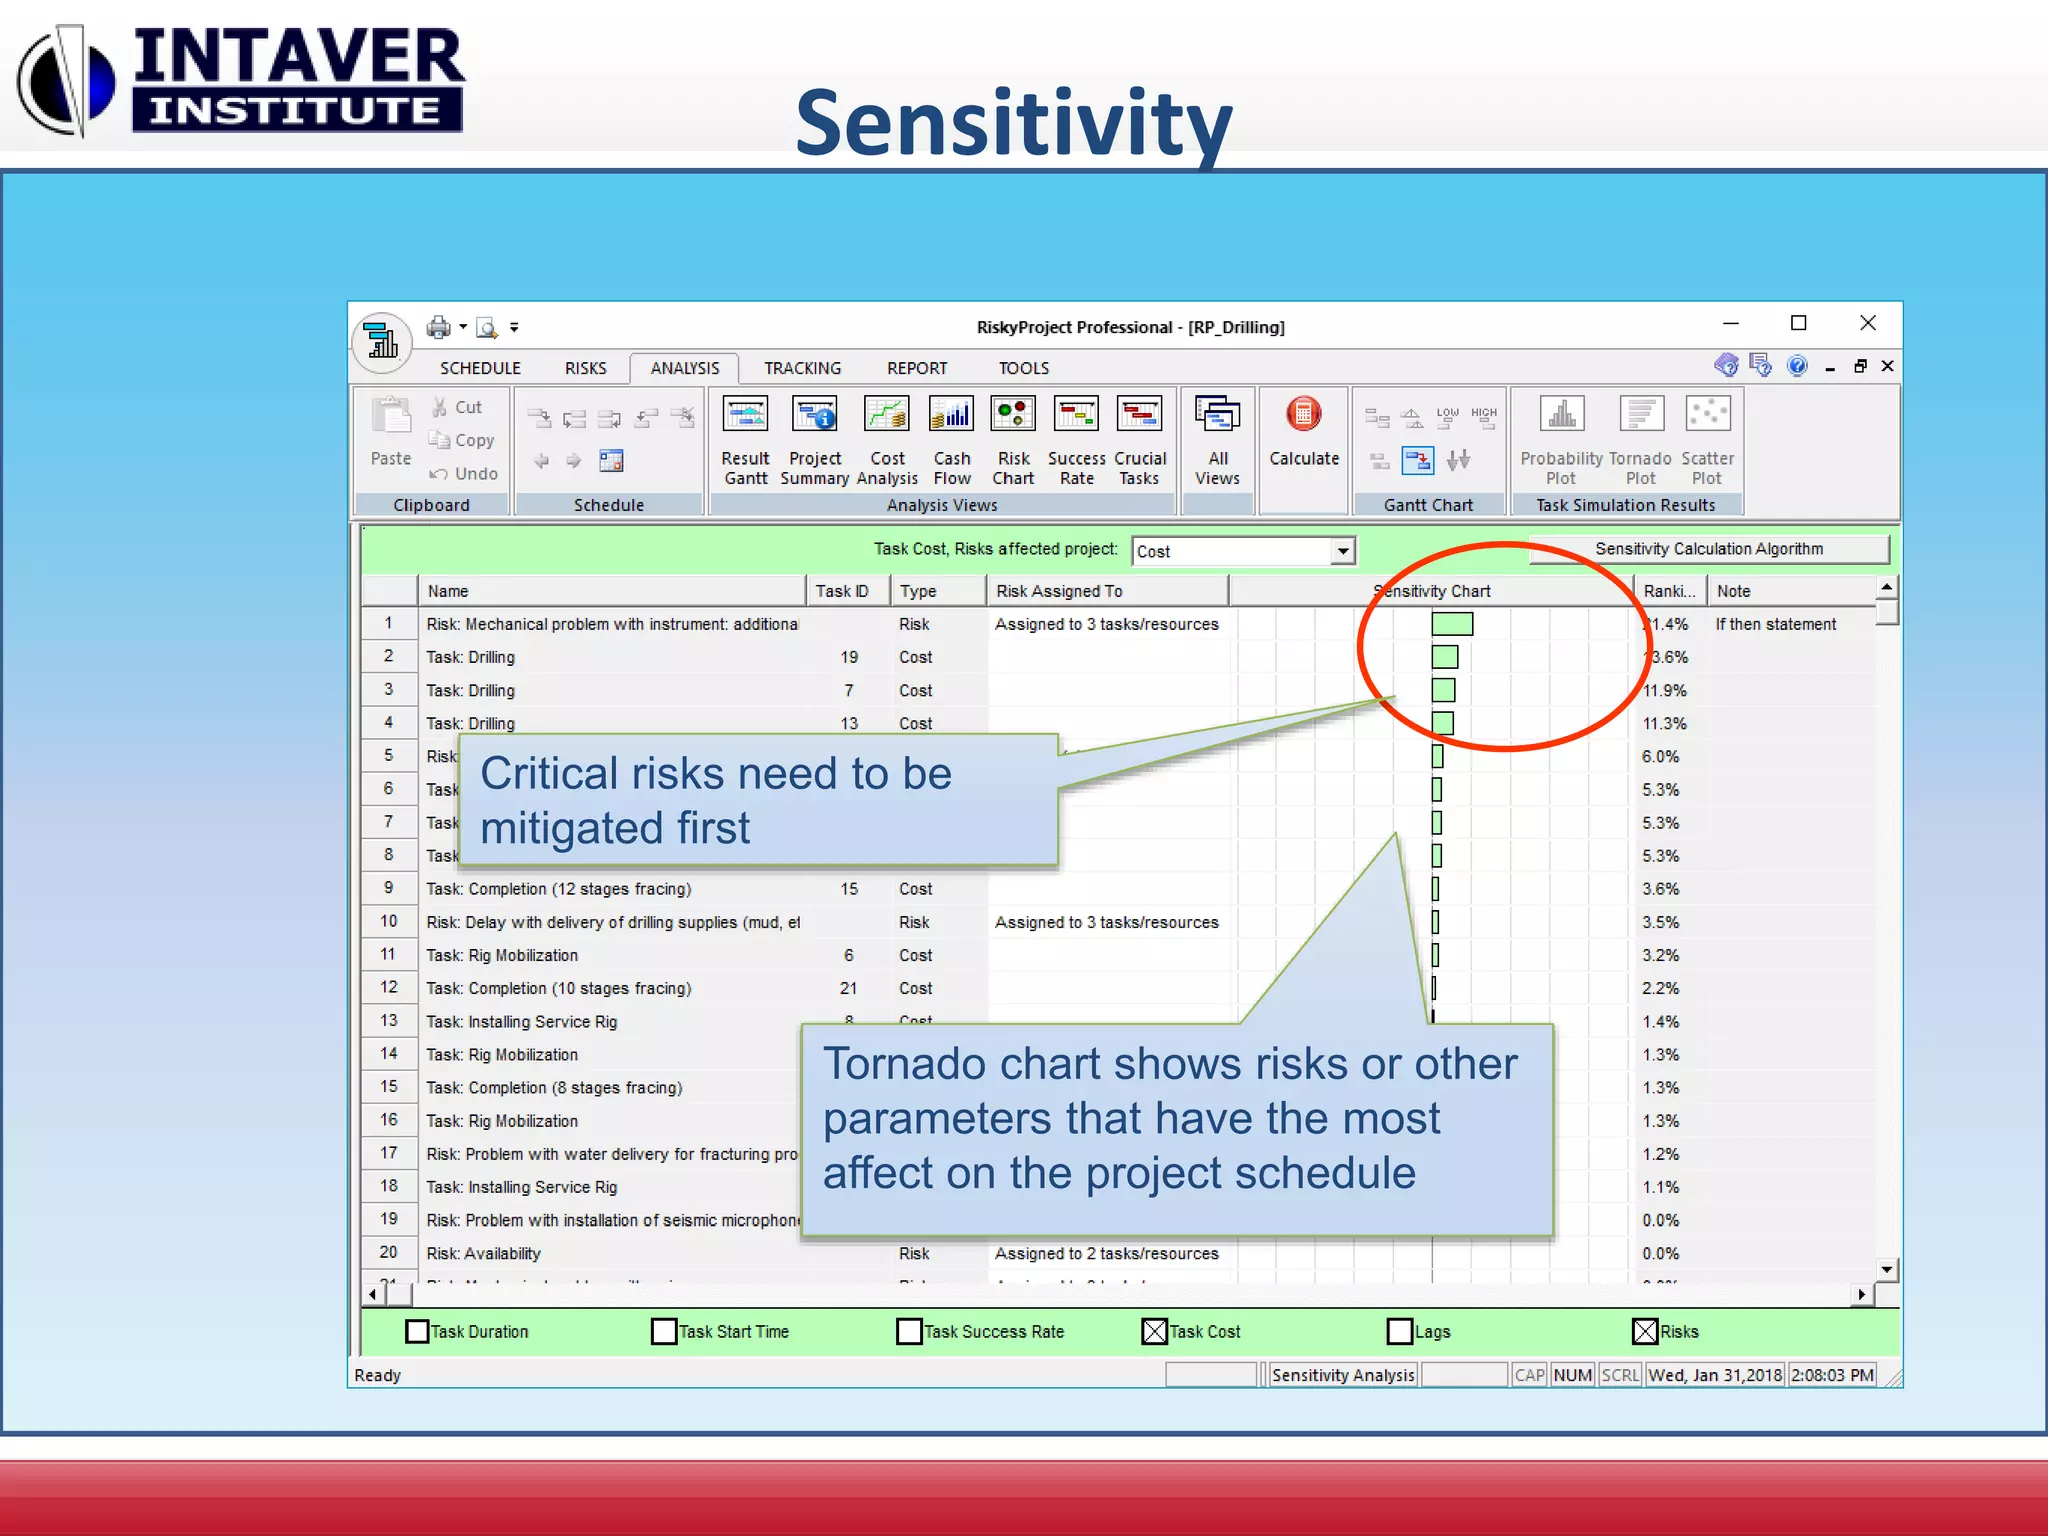
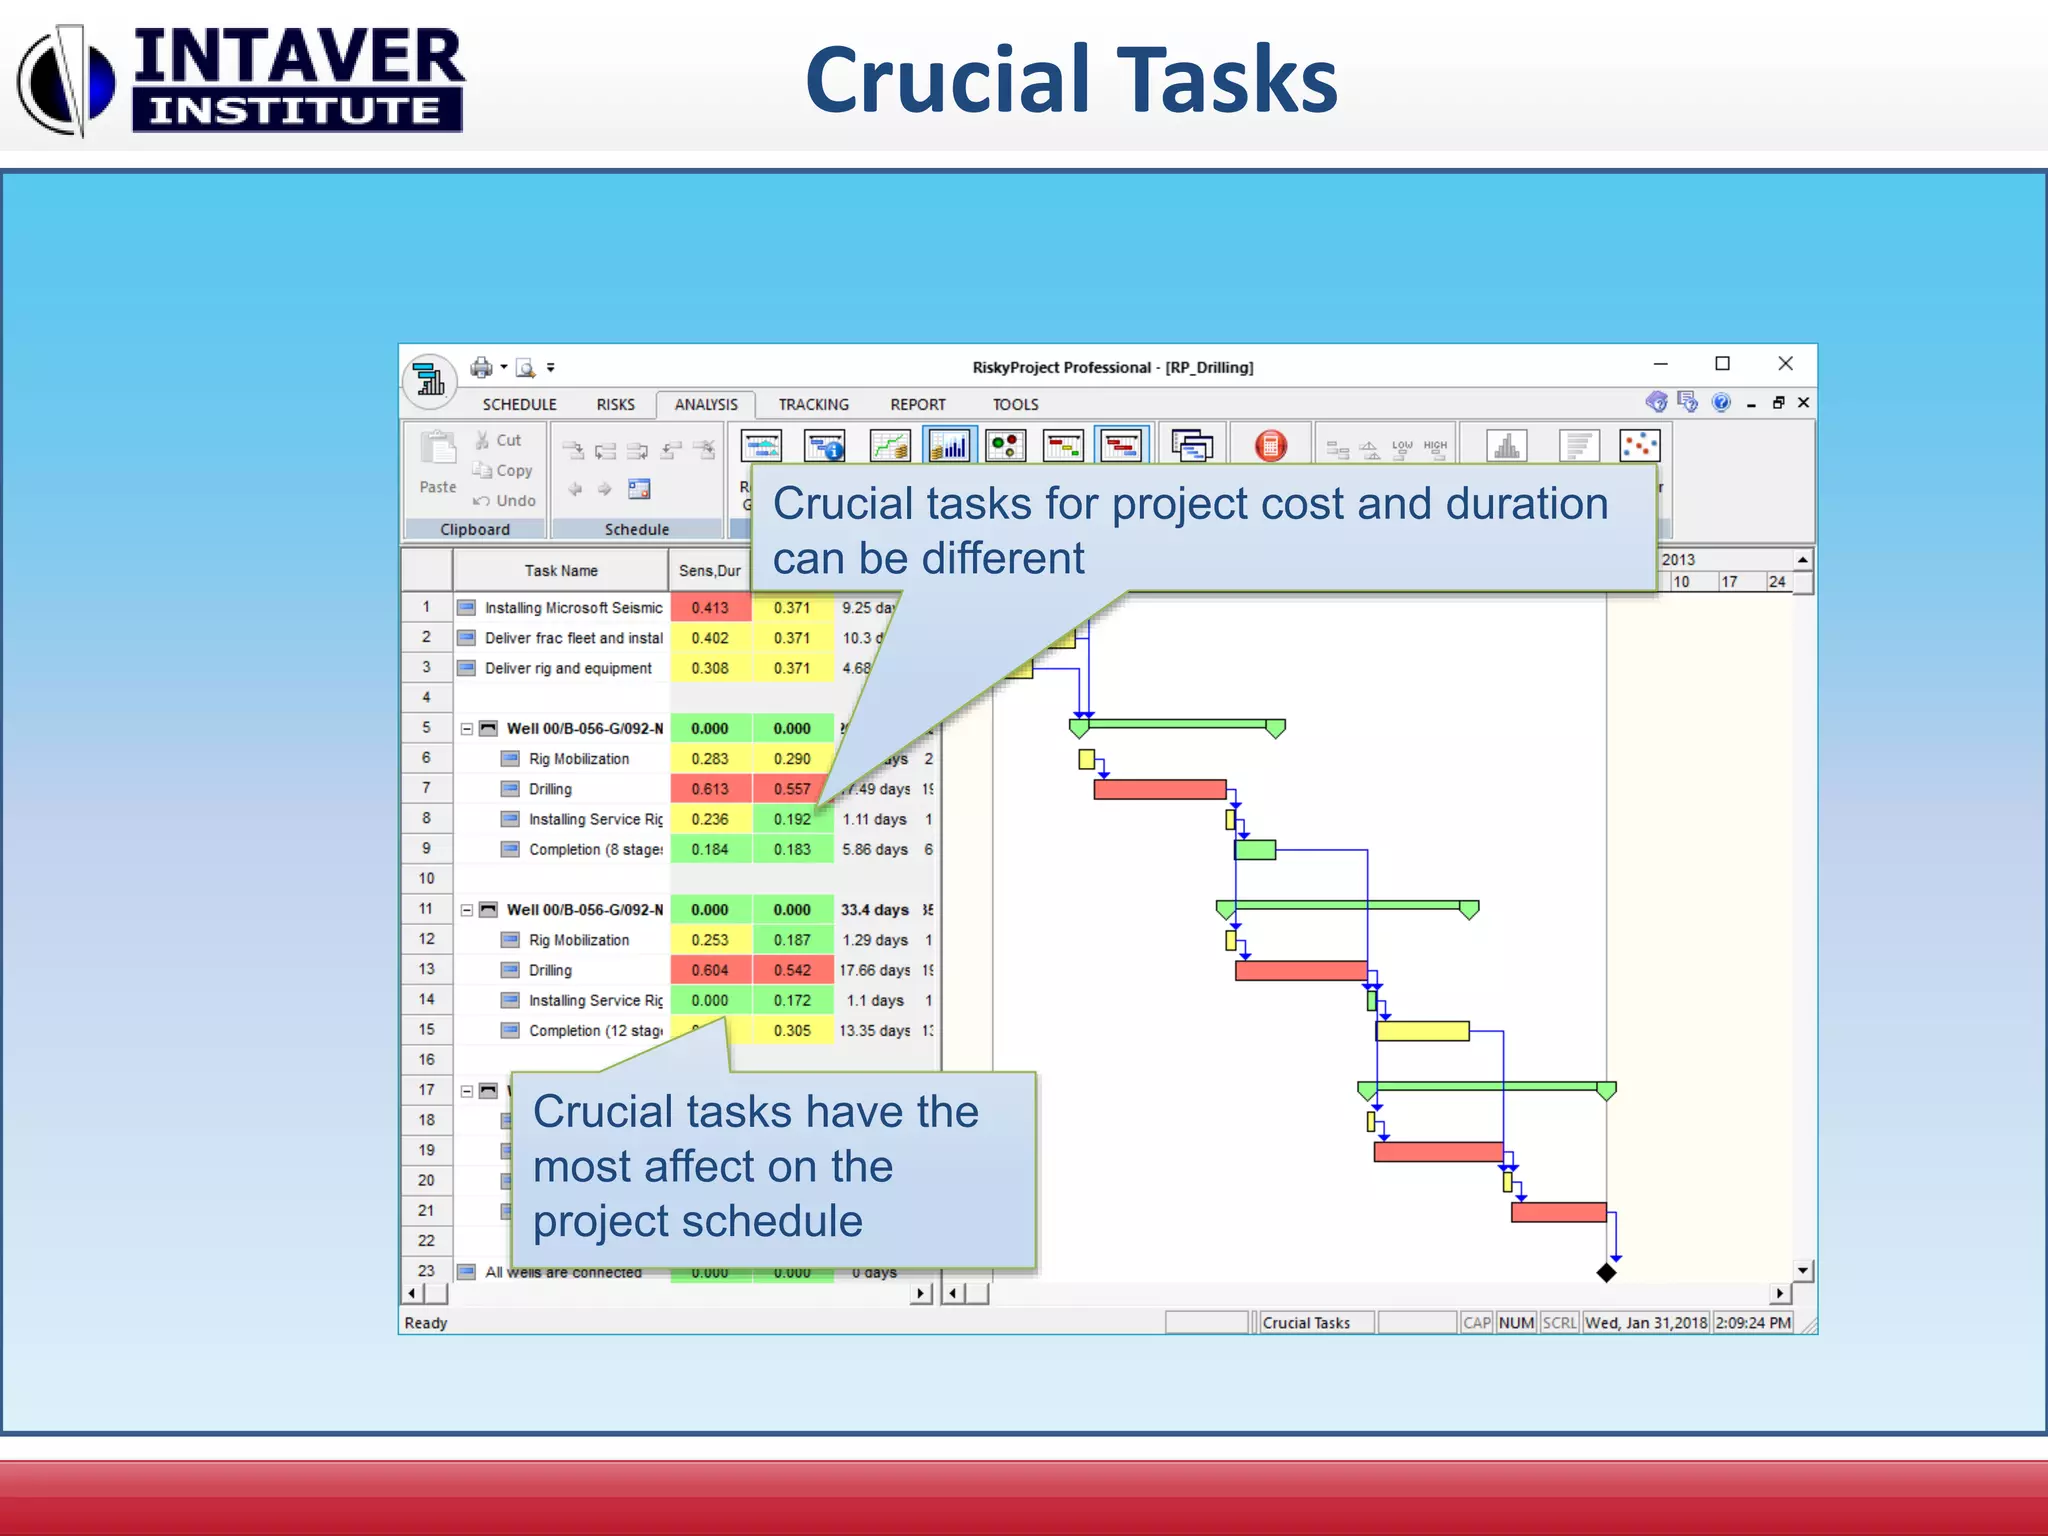

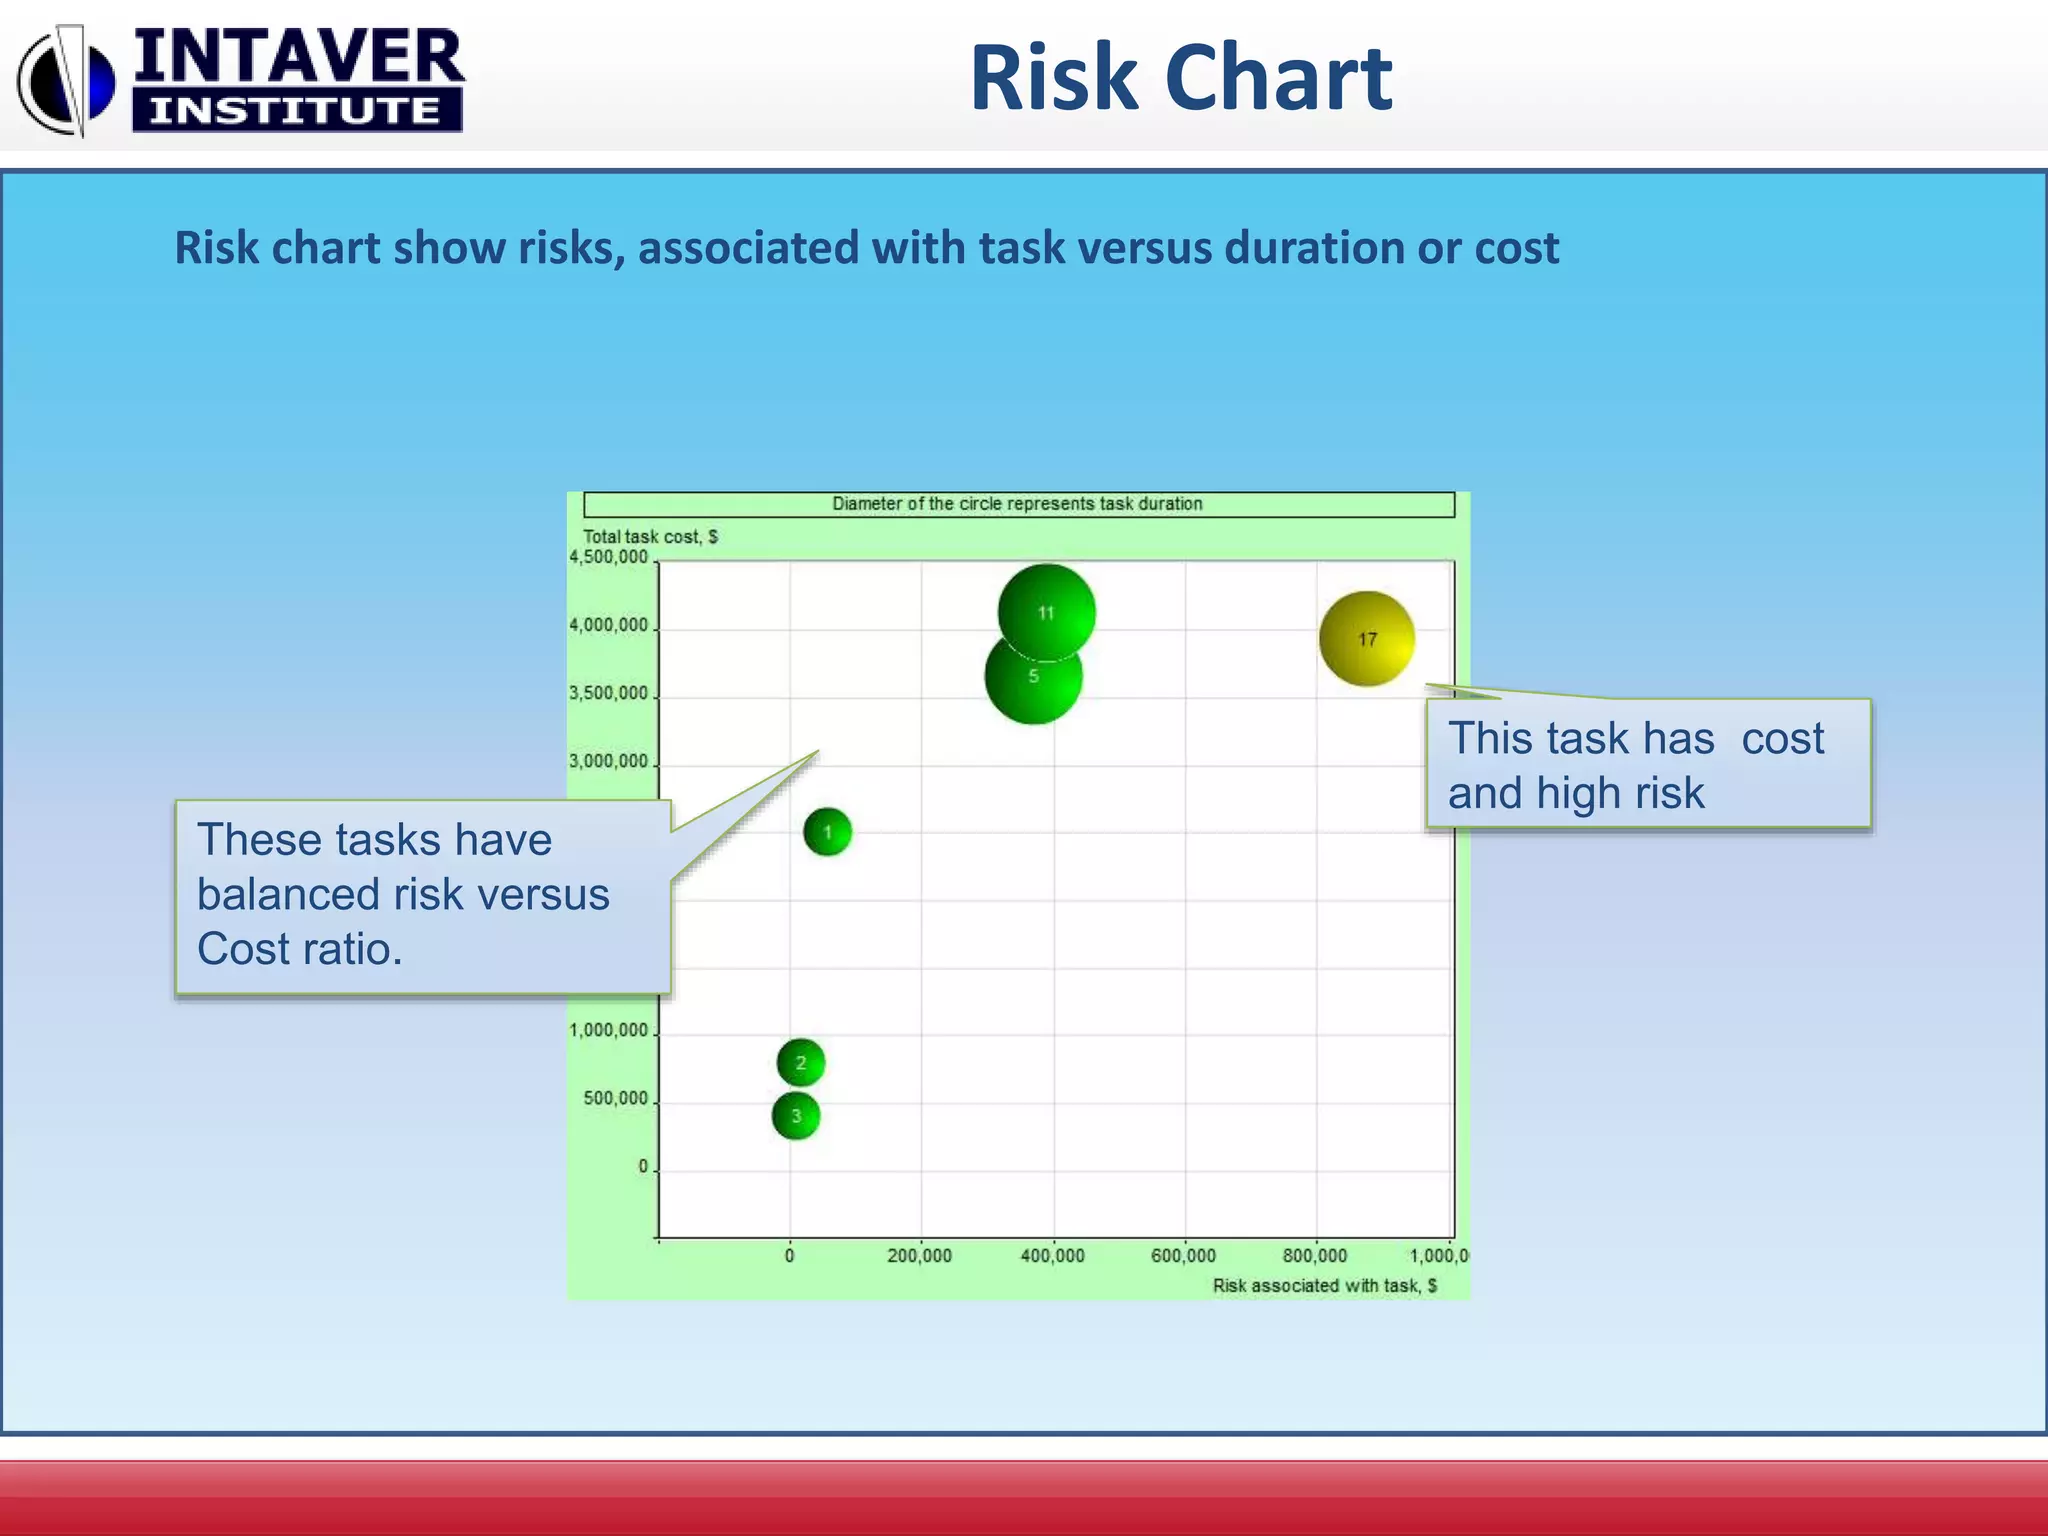

The document discusses the challenges of project management, focusing on risk management as a key factor for project success. It highlights techniques like Monte Carlo simulations for analyzing risks and uncertainties that affect project duration and costs, along with methods for eliciting probability judgments from experts. The document outlines workflows for risk event modeling and emphasizes the importance of identifying critical risks to improve project outcomes.


![Primavera Monte Carlo[1]](https://cdn.slidesharecdn.com/ss_thumbnails/29e0ac57-26a3-45d1-b4bf-c67f2218016c-160504153318-thumbnail.jpg?width=640&height=640&fit=bounds)


