Download as PDF, PPTX


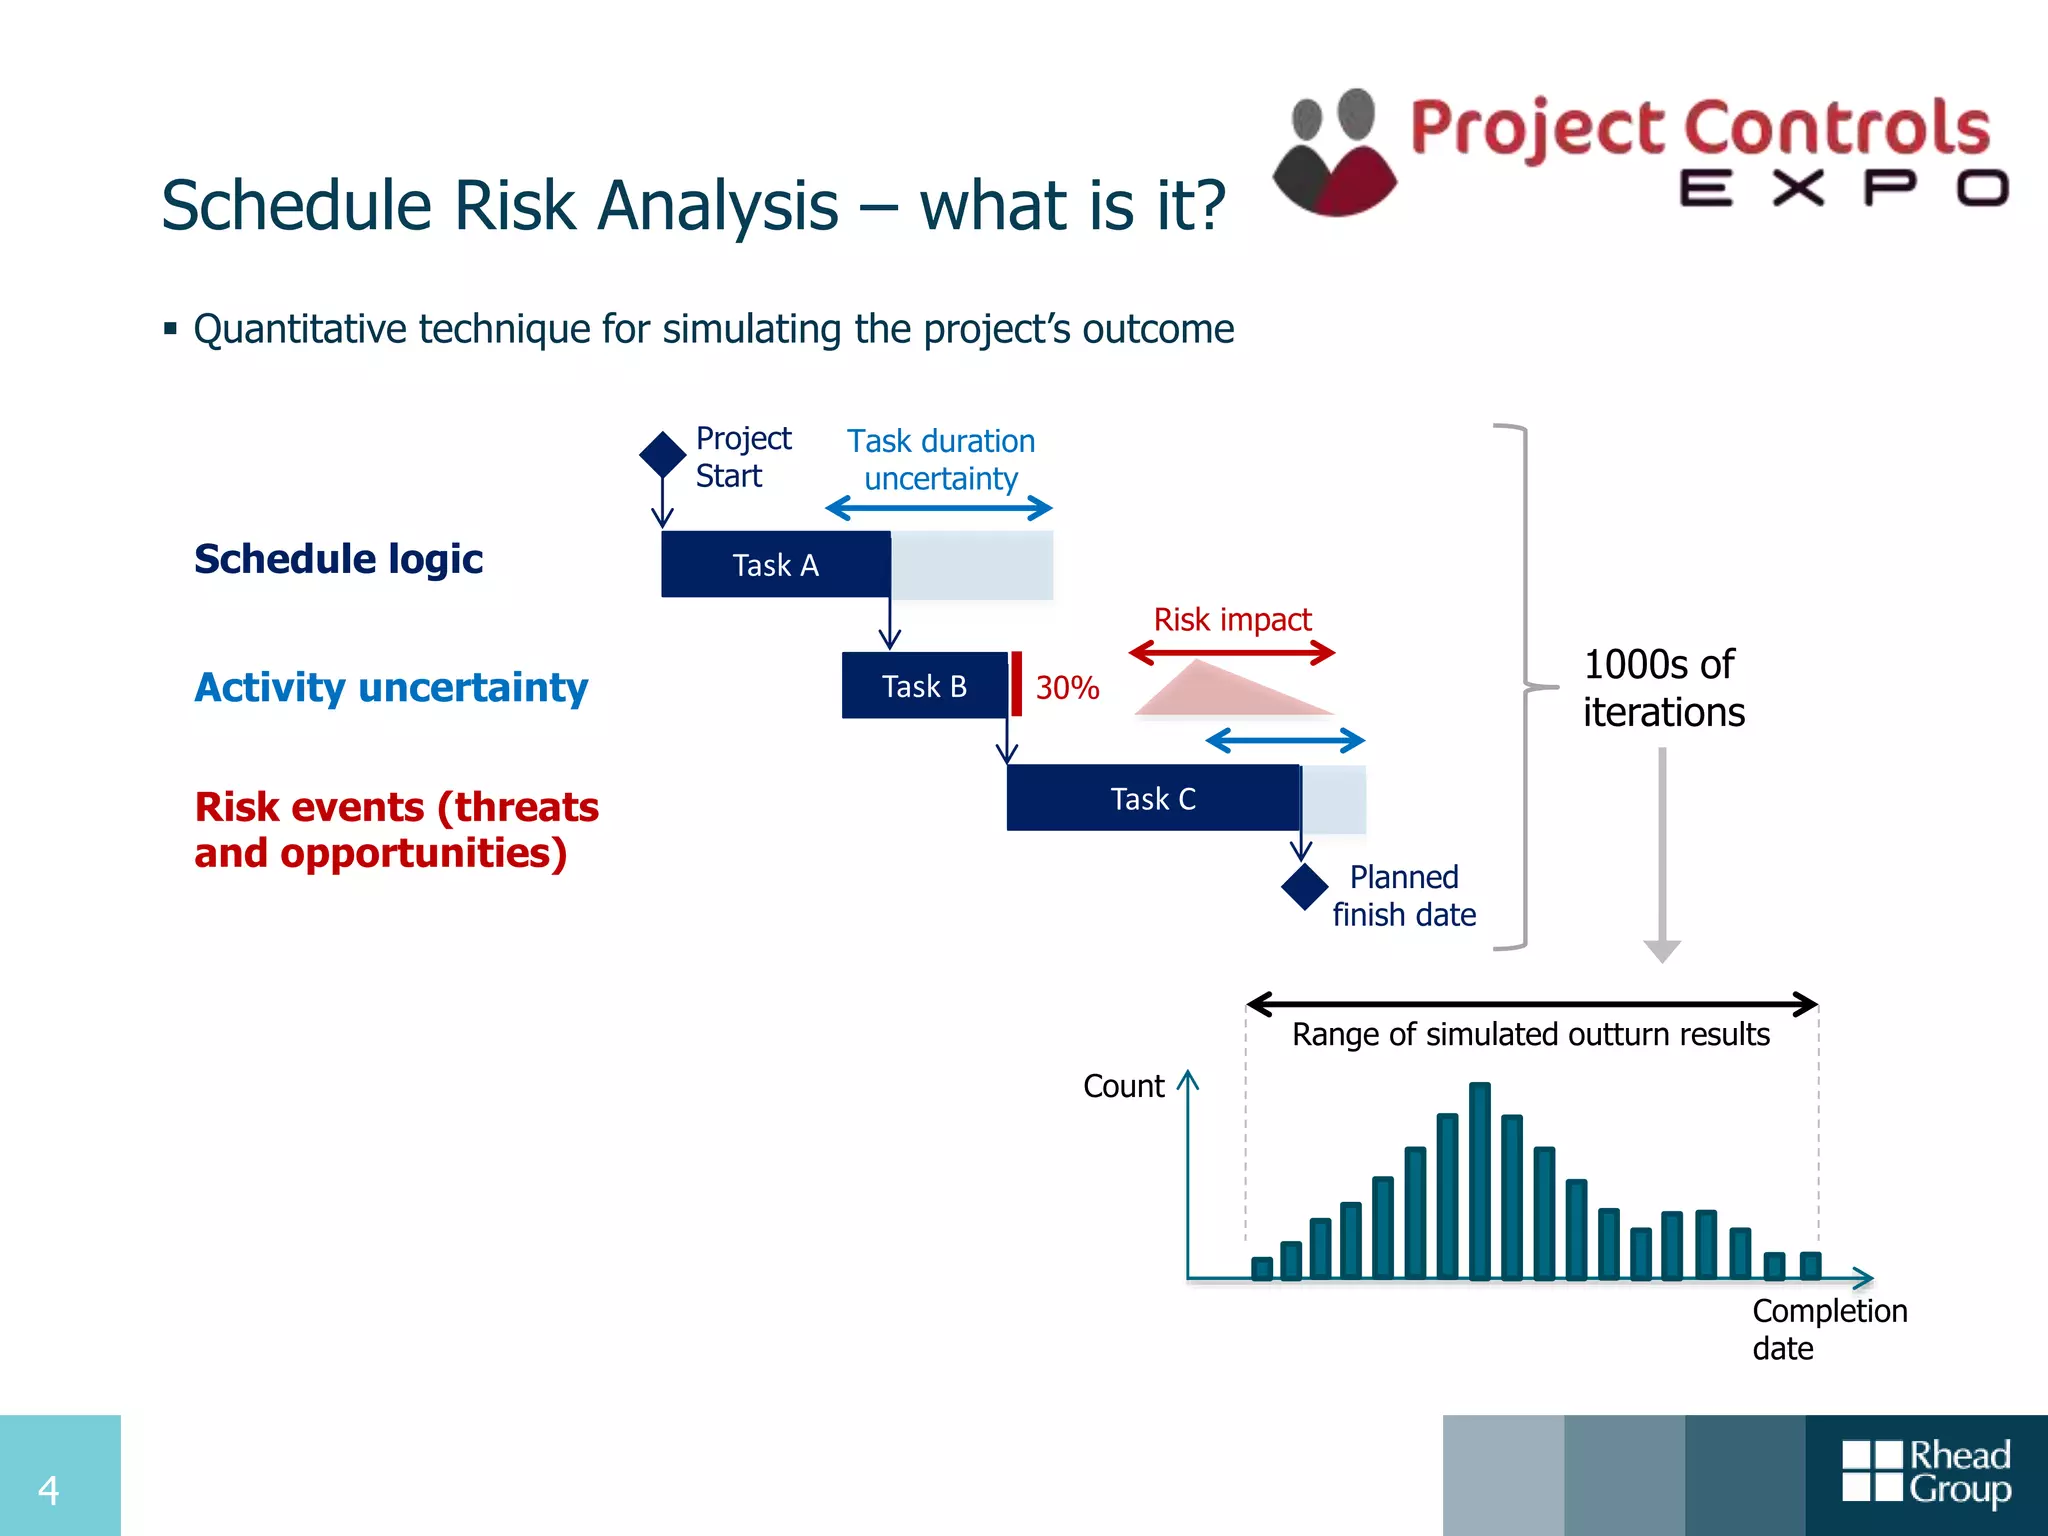
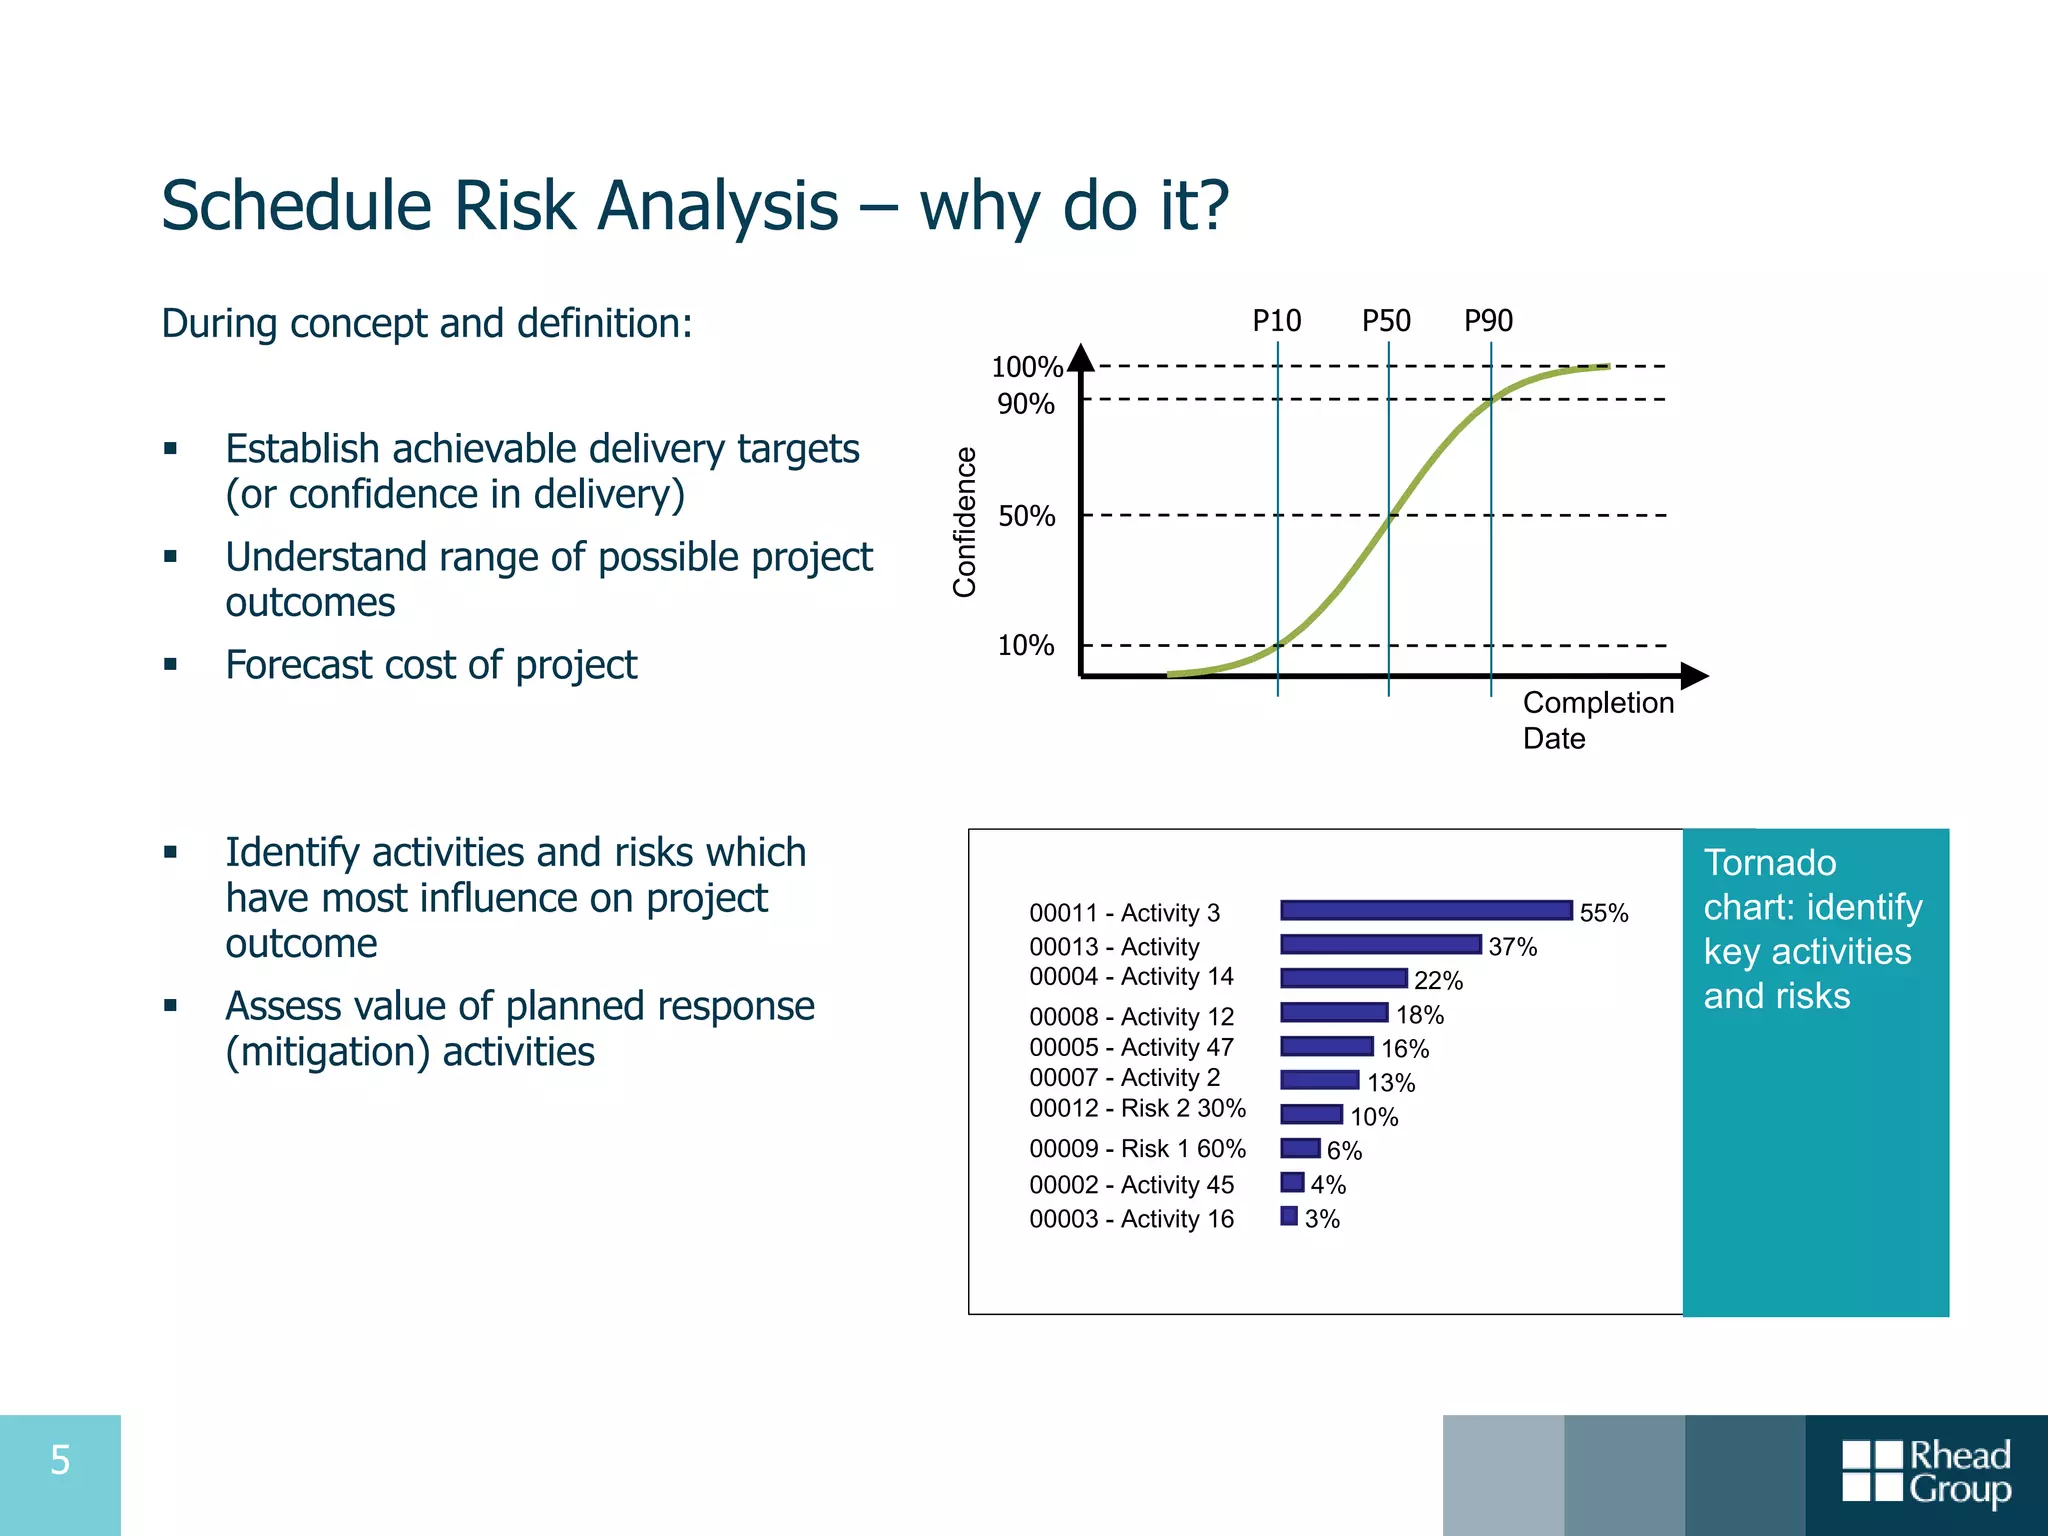
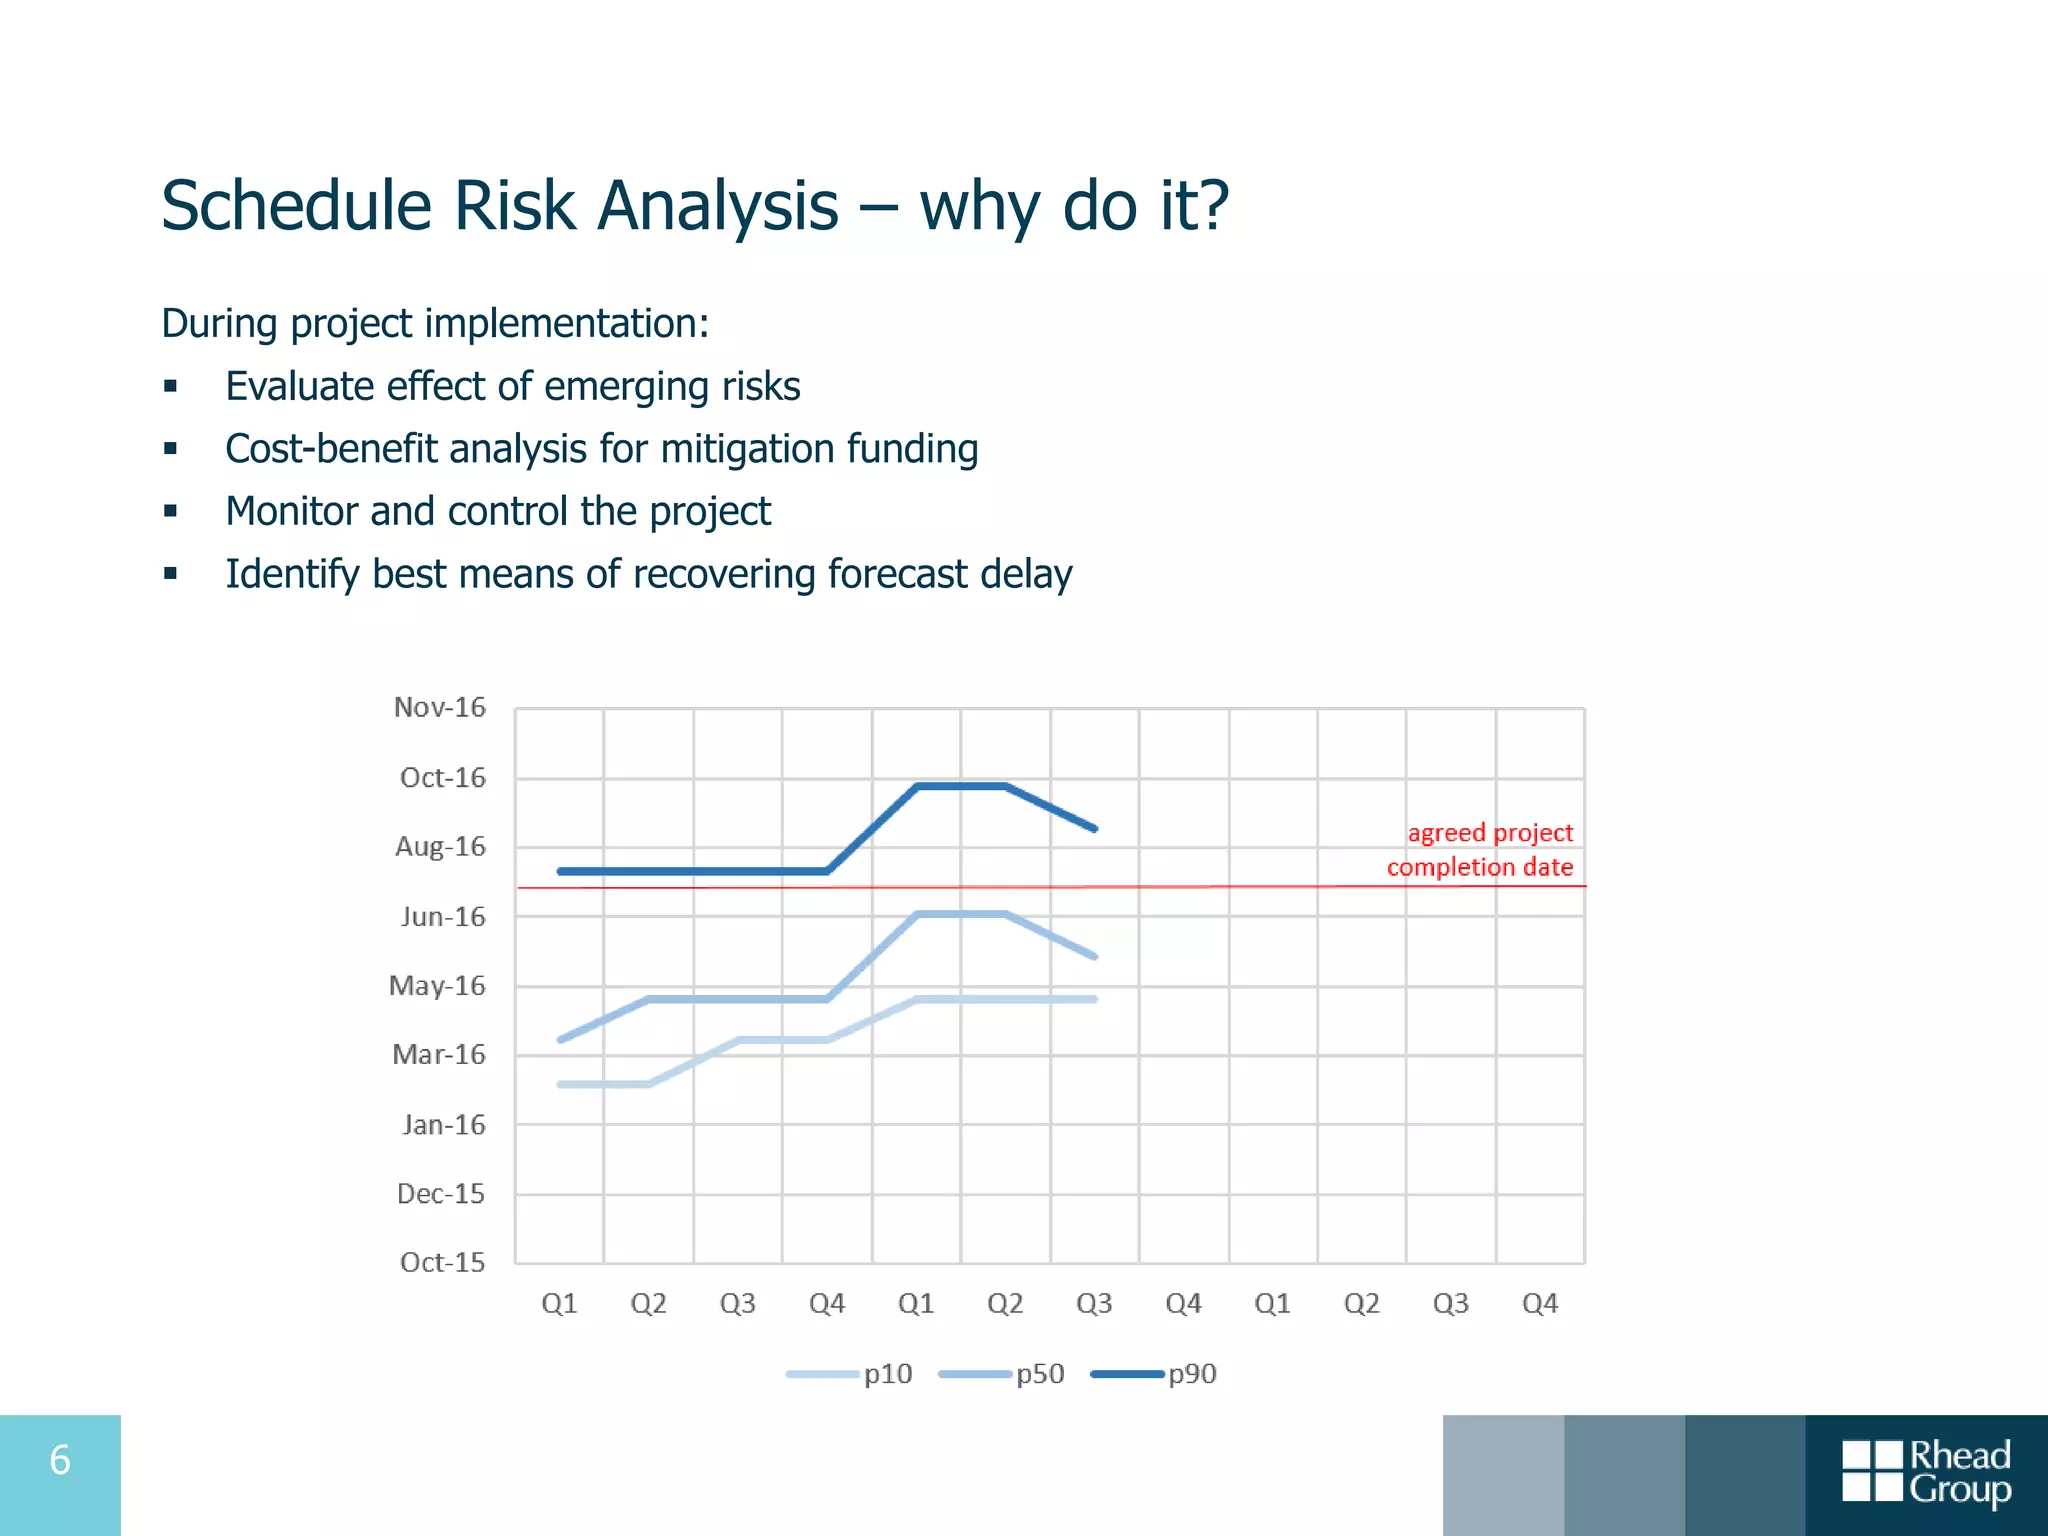

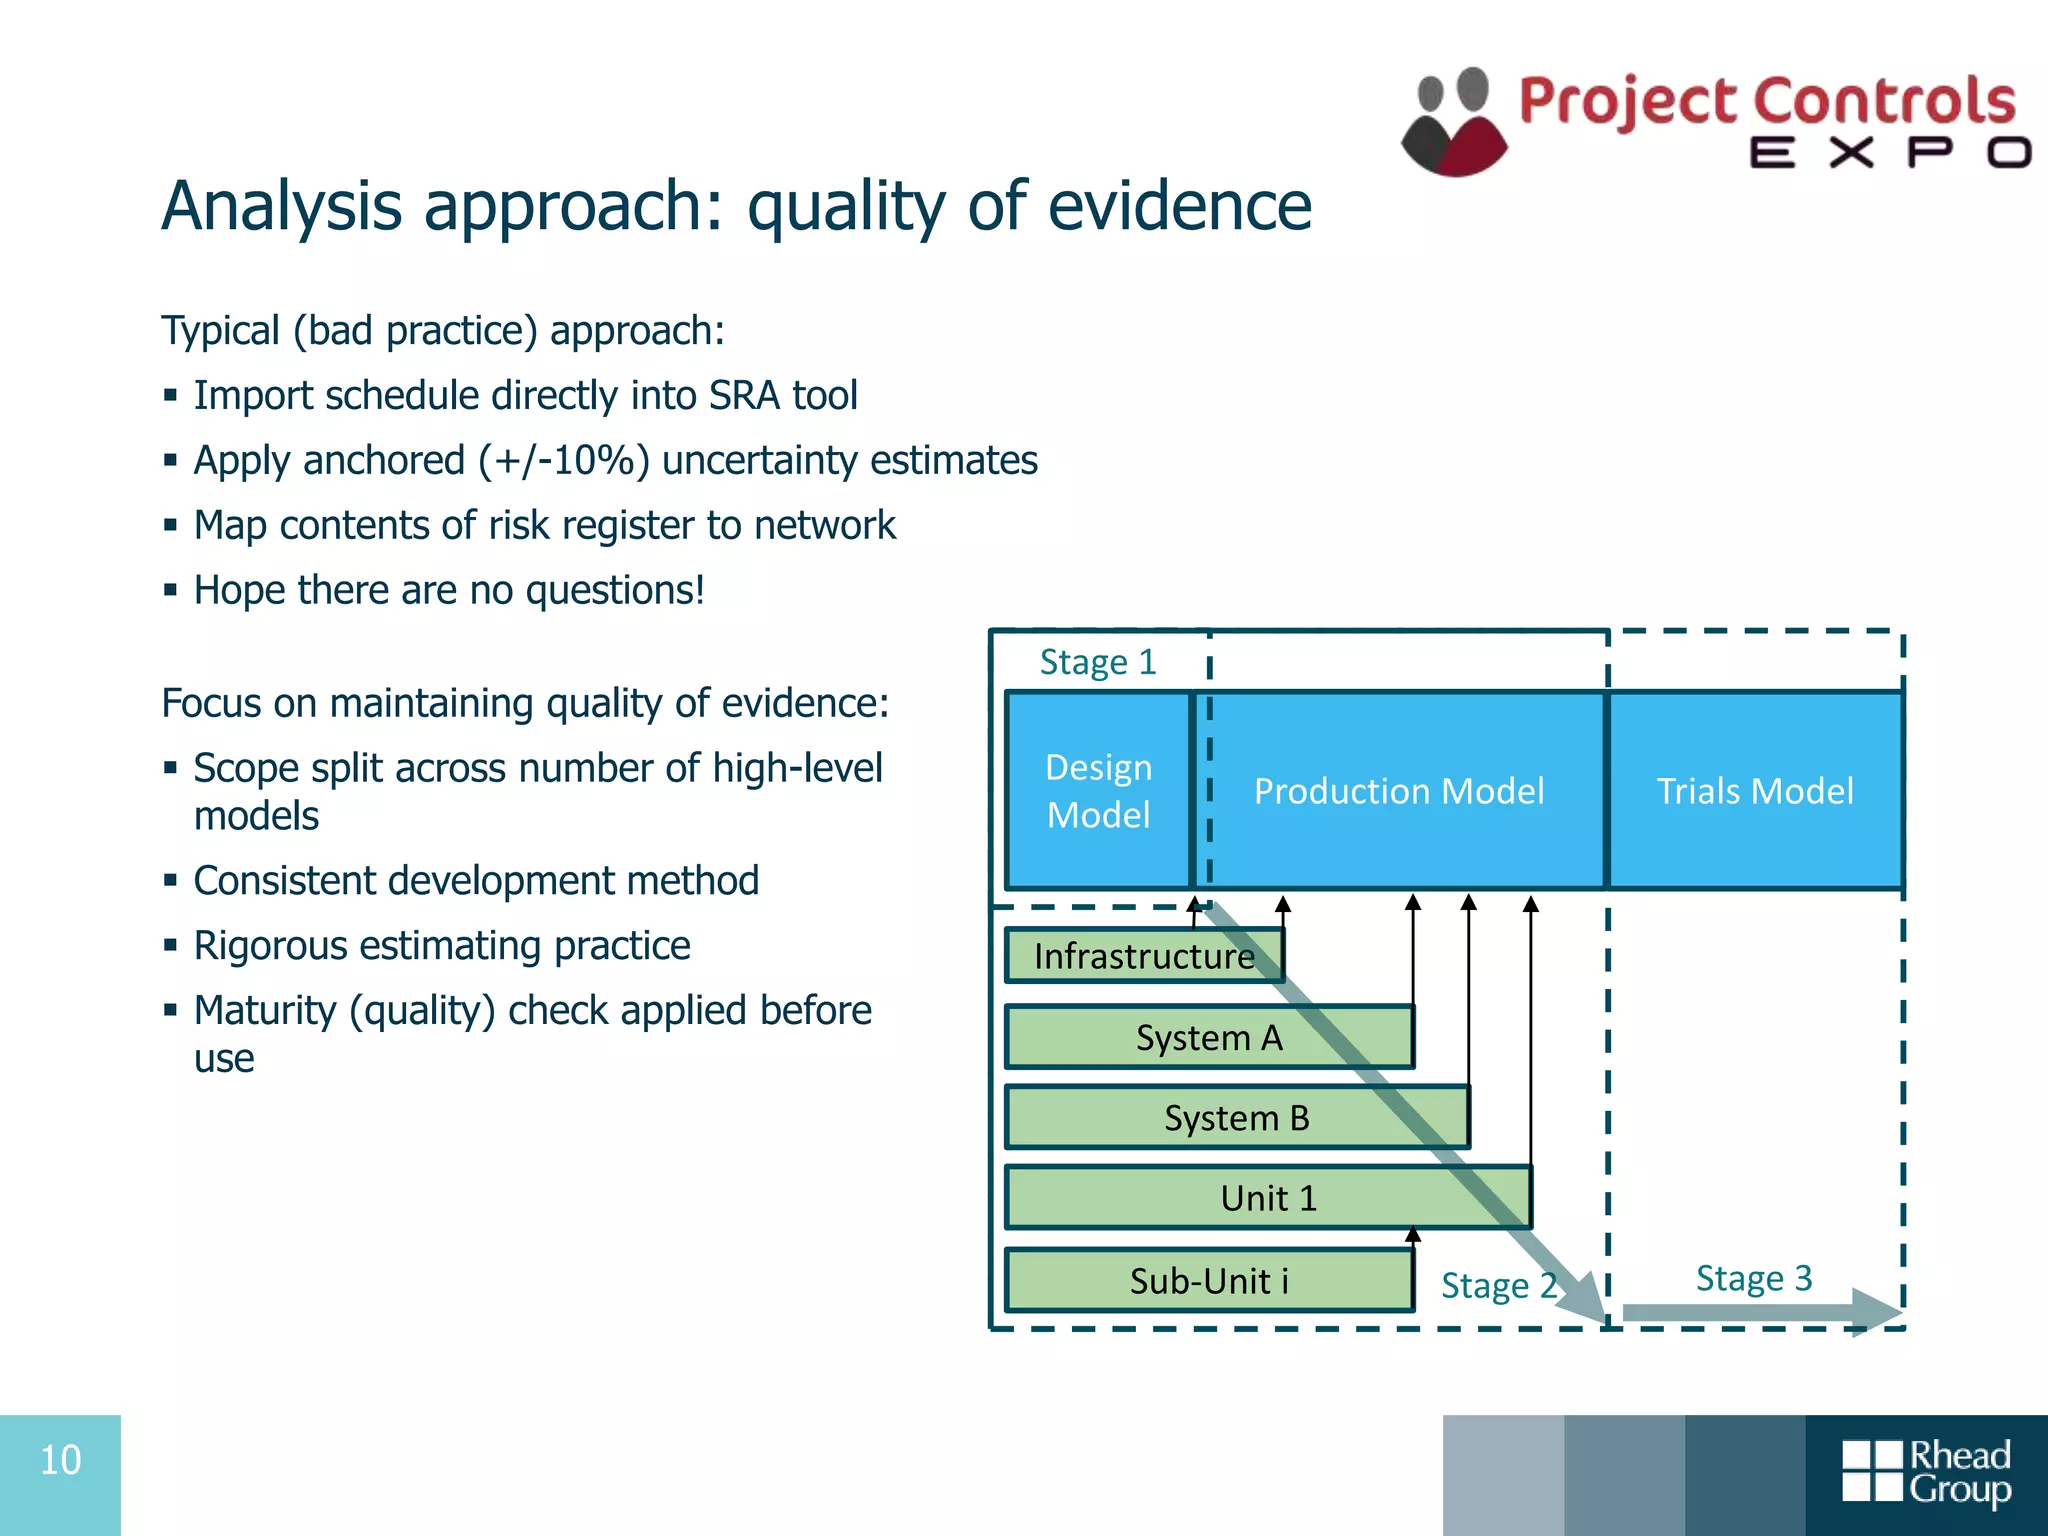


The document presents a detailed overview of schedule risk analysis, particularly for complex projects, highlighting its significance in establishing achievable project delivery targets and understanding potential outcomes. It covers the speaker's expertise, the analysis approach, and a case study illustrating the implementation of these techniques in a large public sector engineering project. Key elements include developing models, assessing risks, and ensuring quality evidence to support decision-making and enhance project monitoring.