Downloaded 145 times


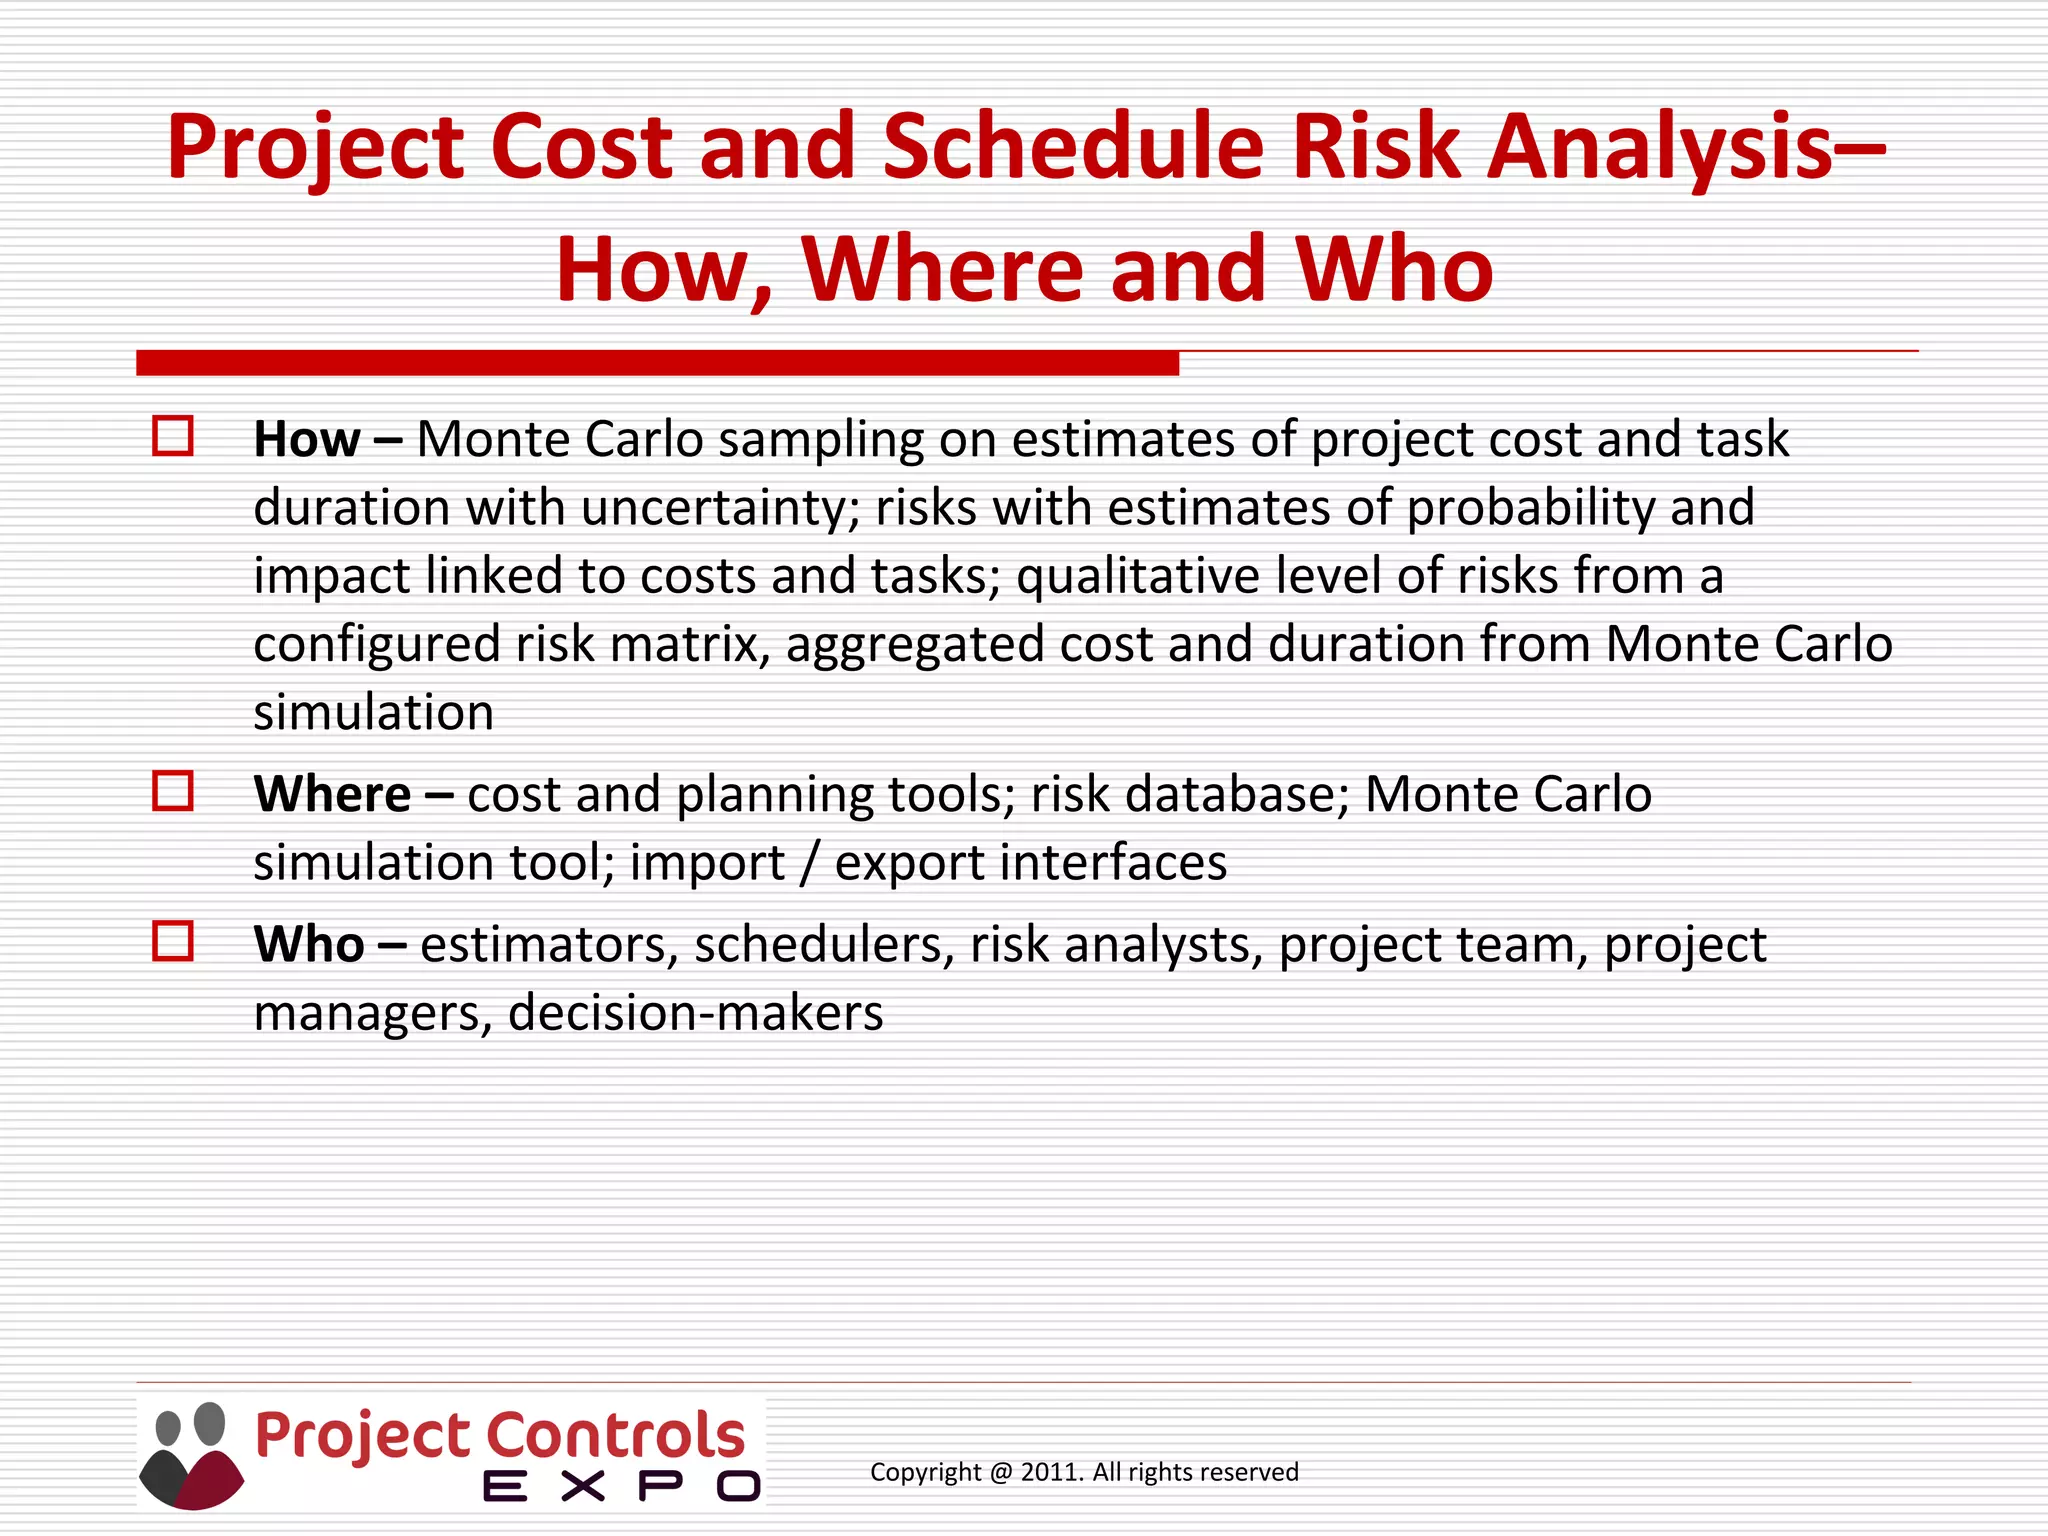
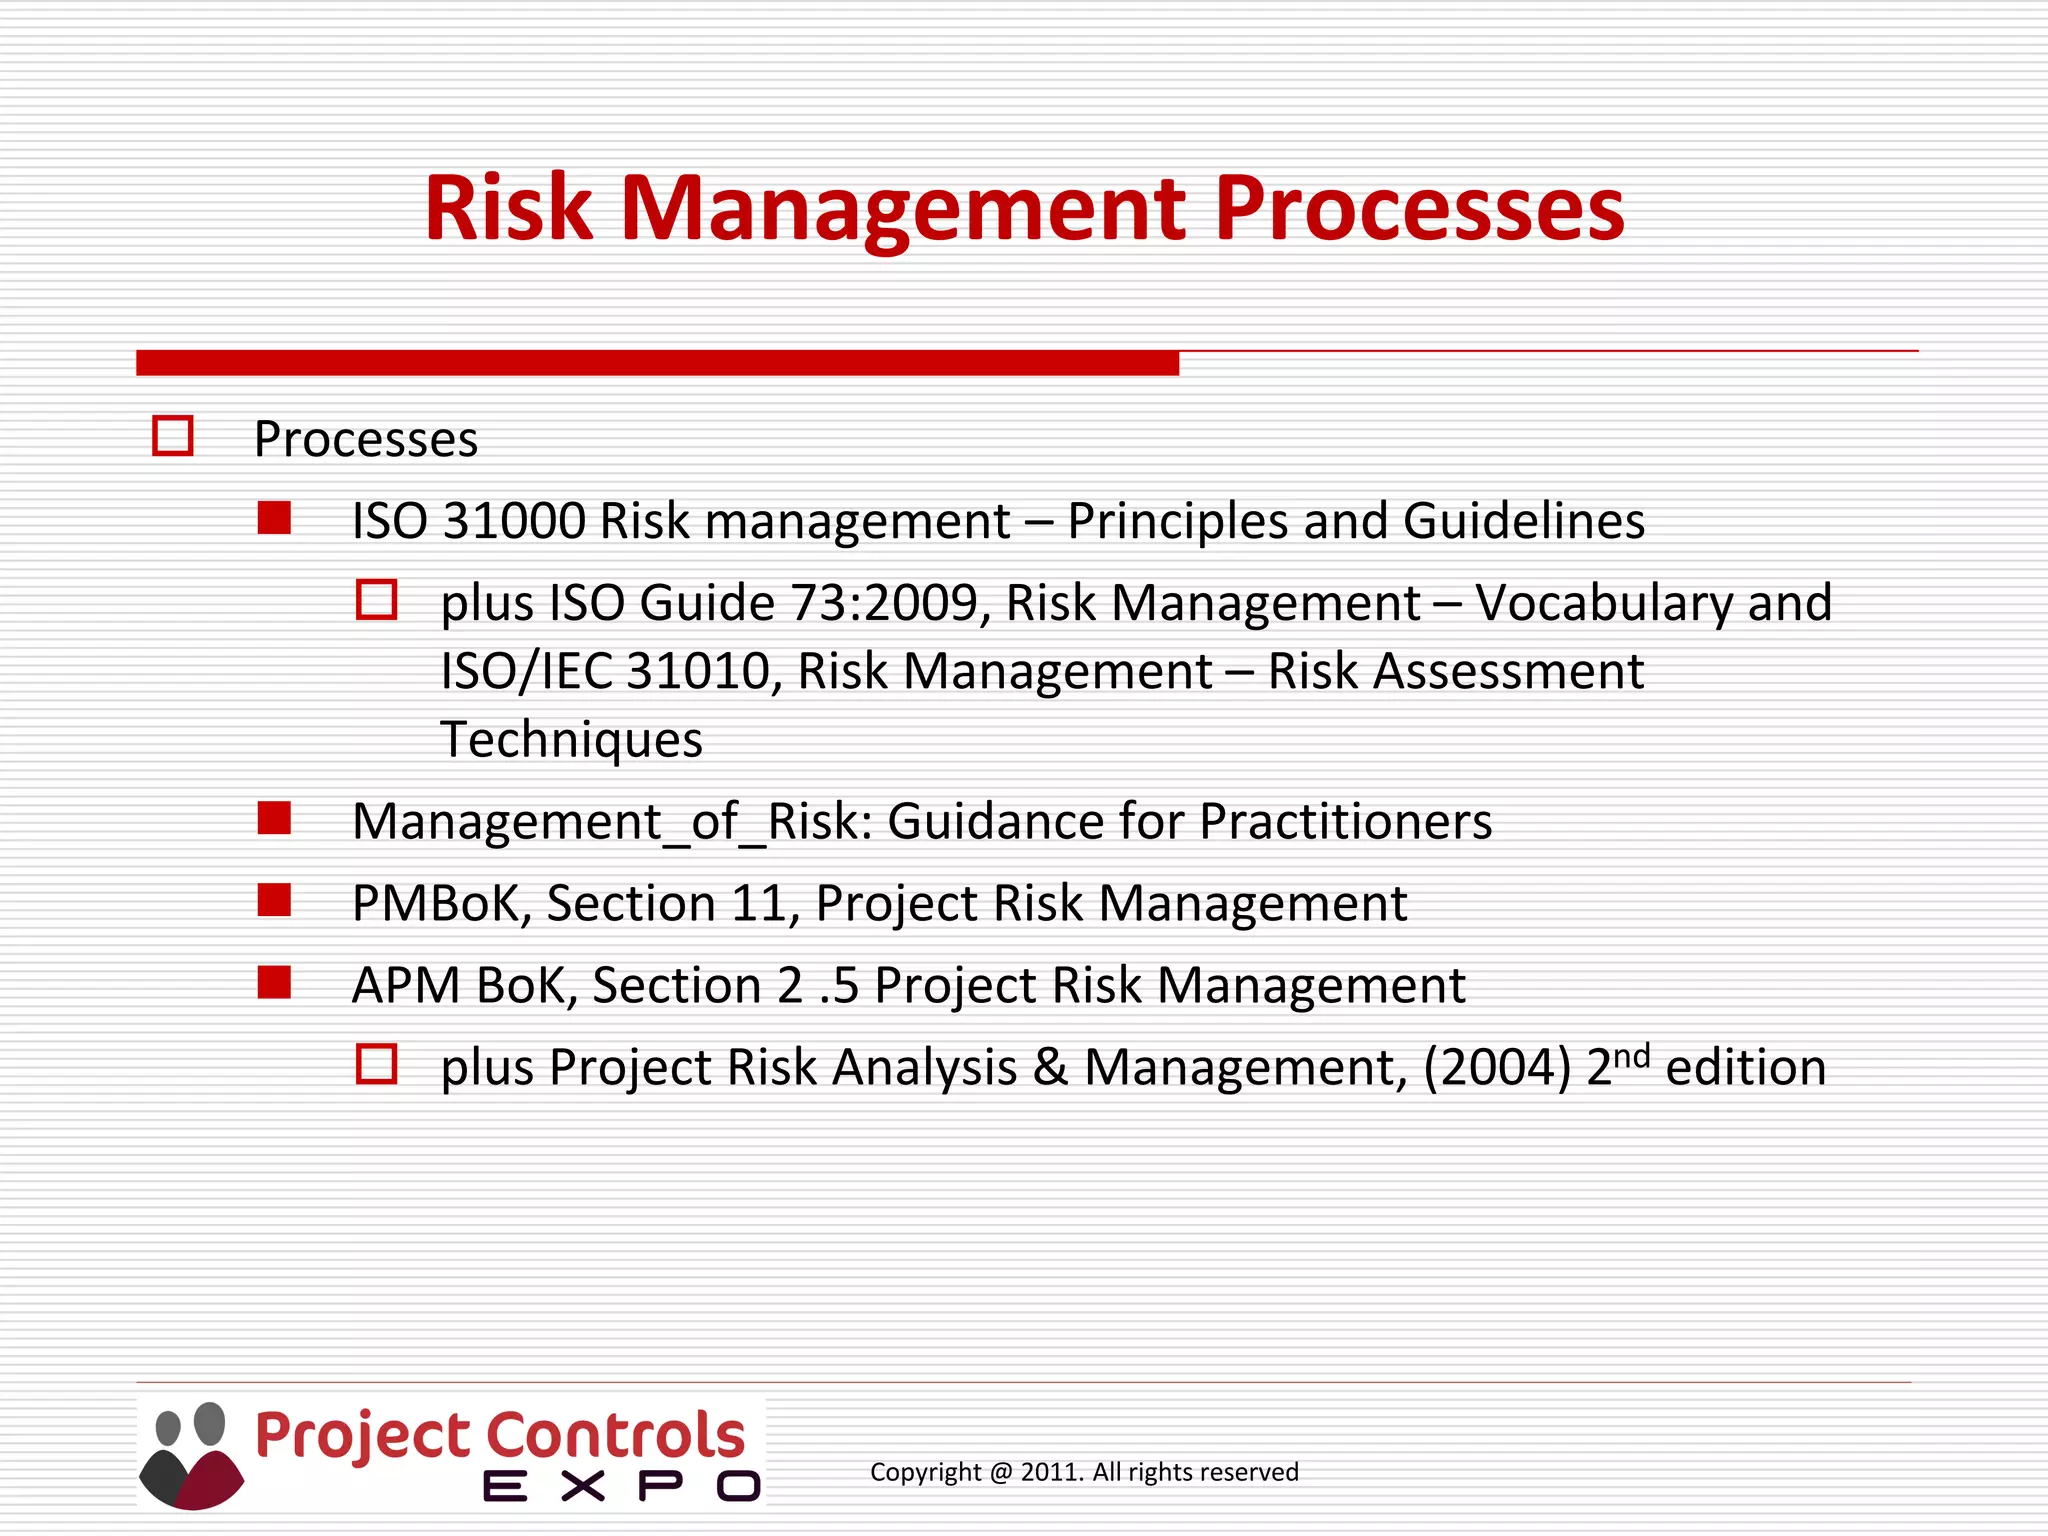
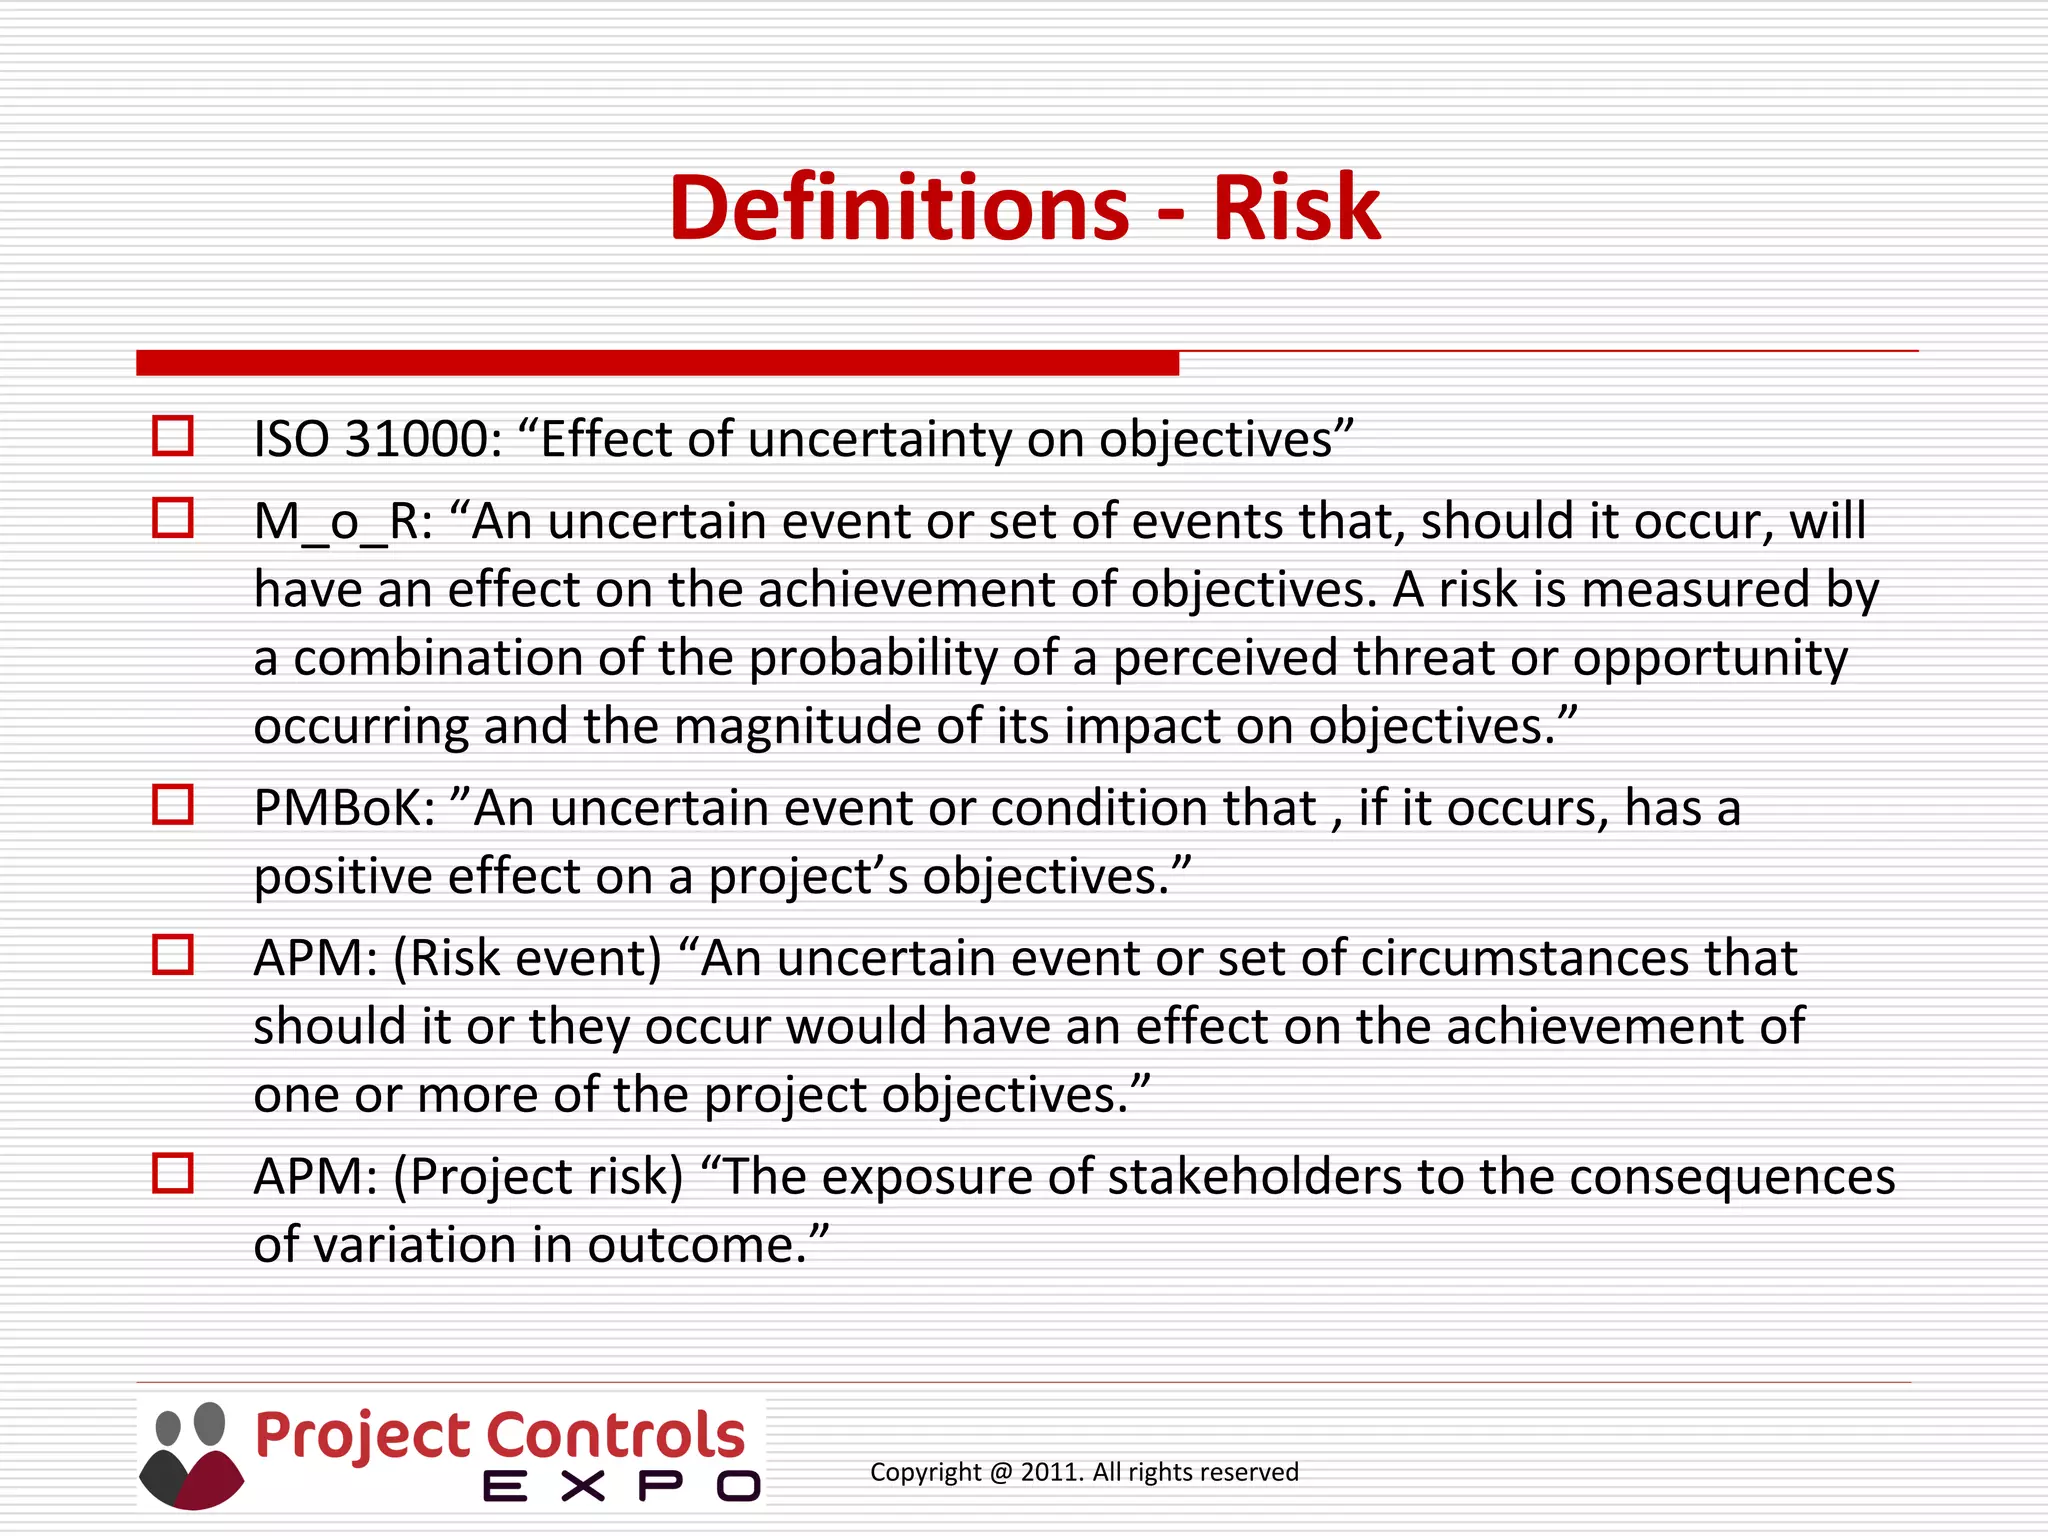
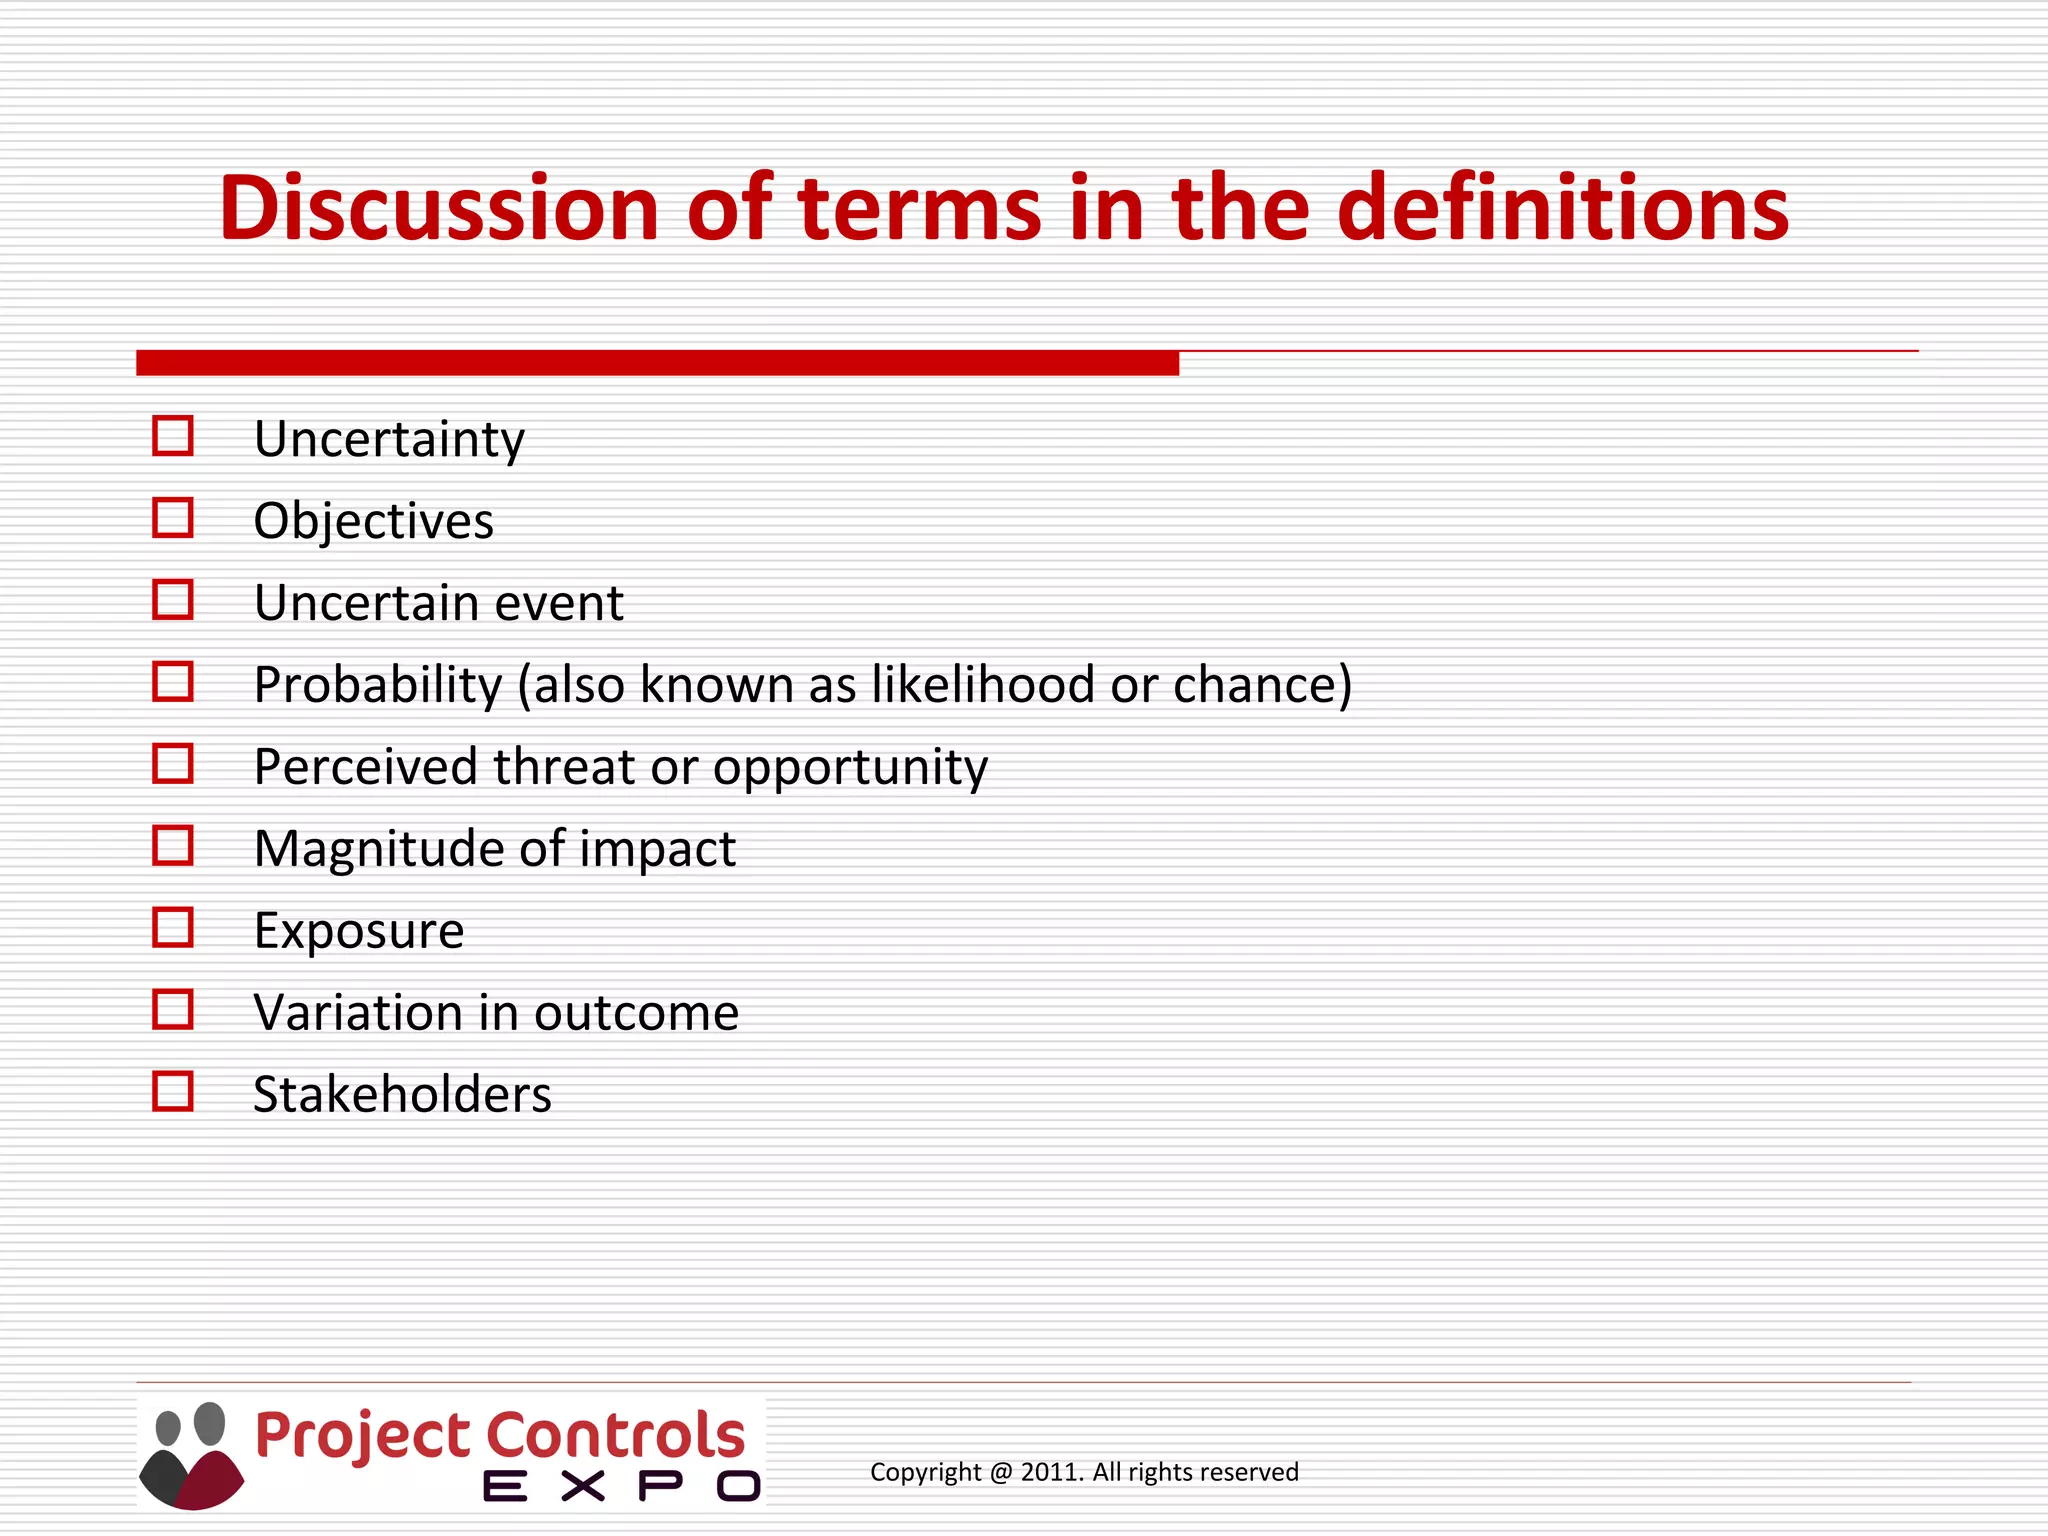
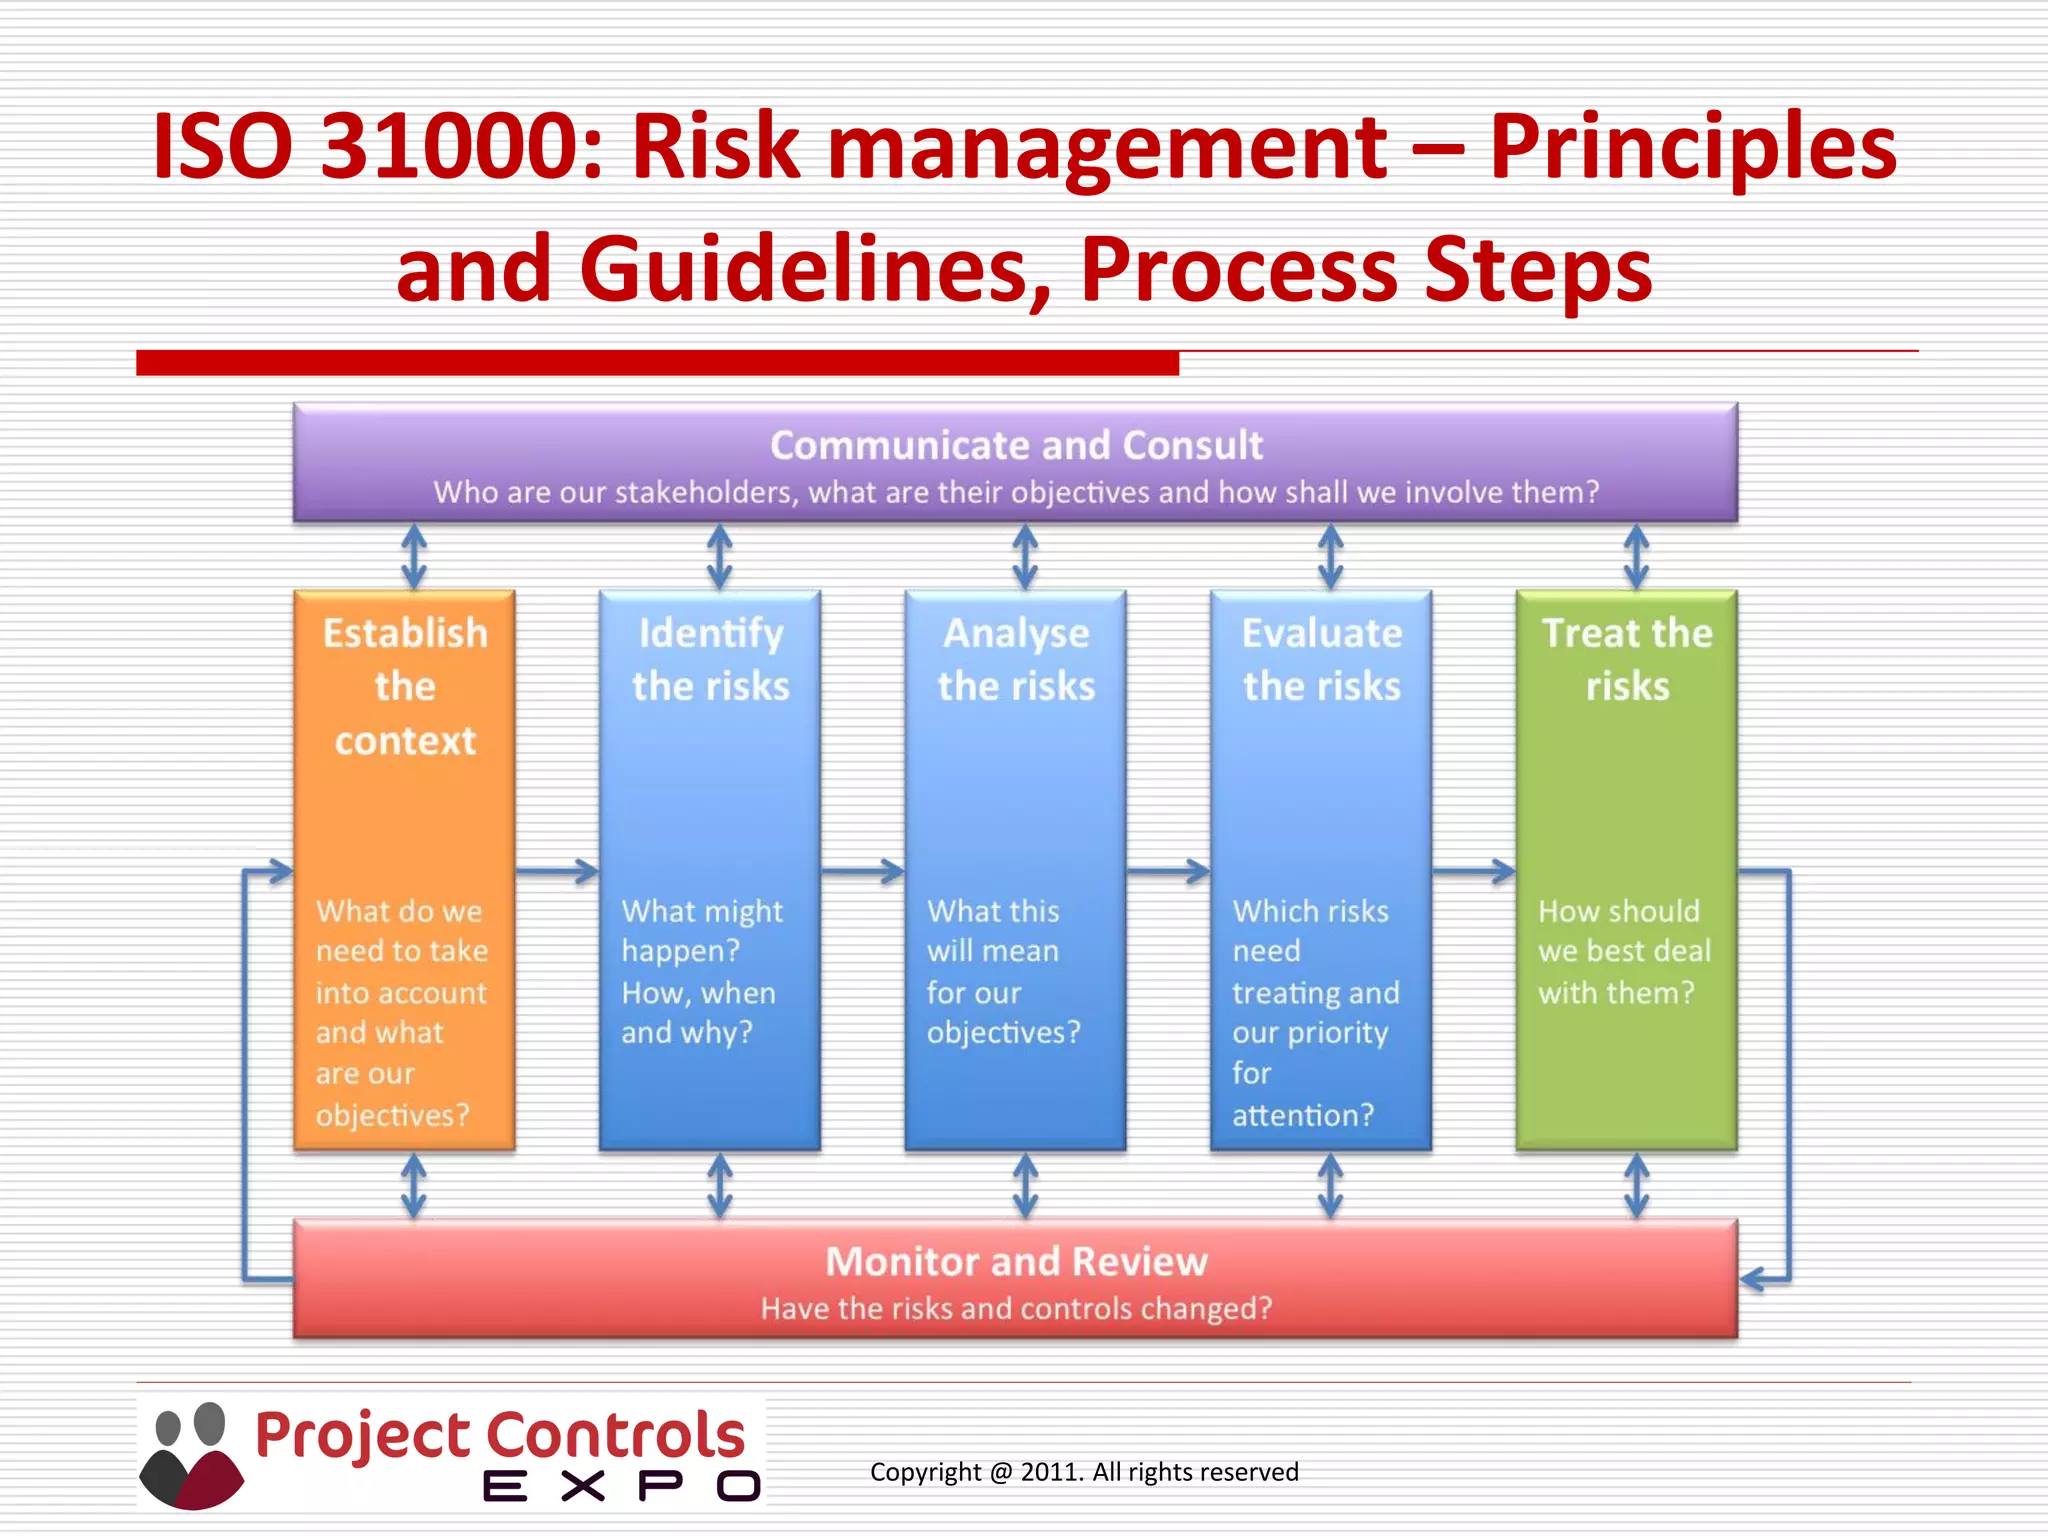
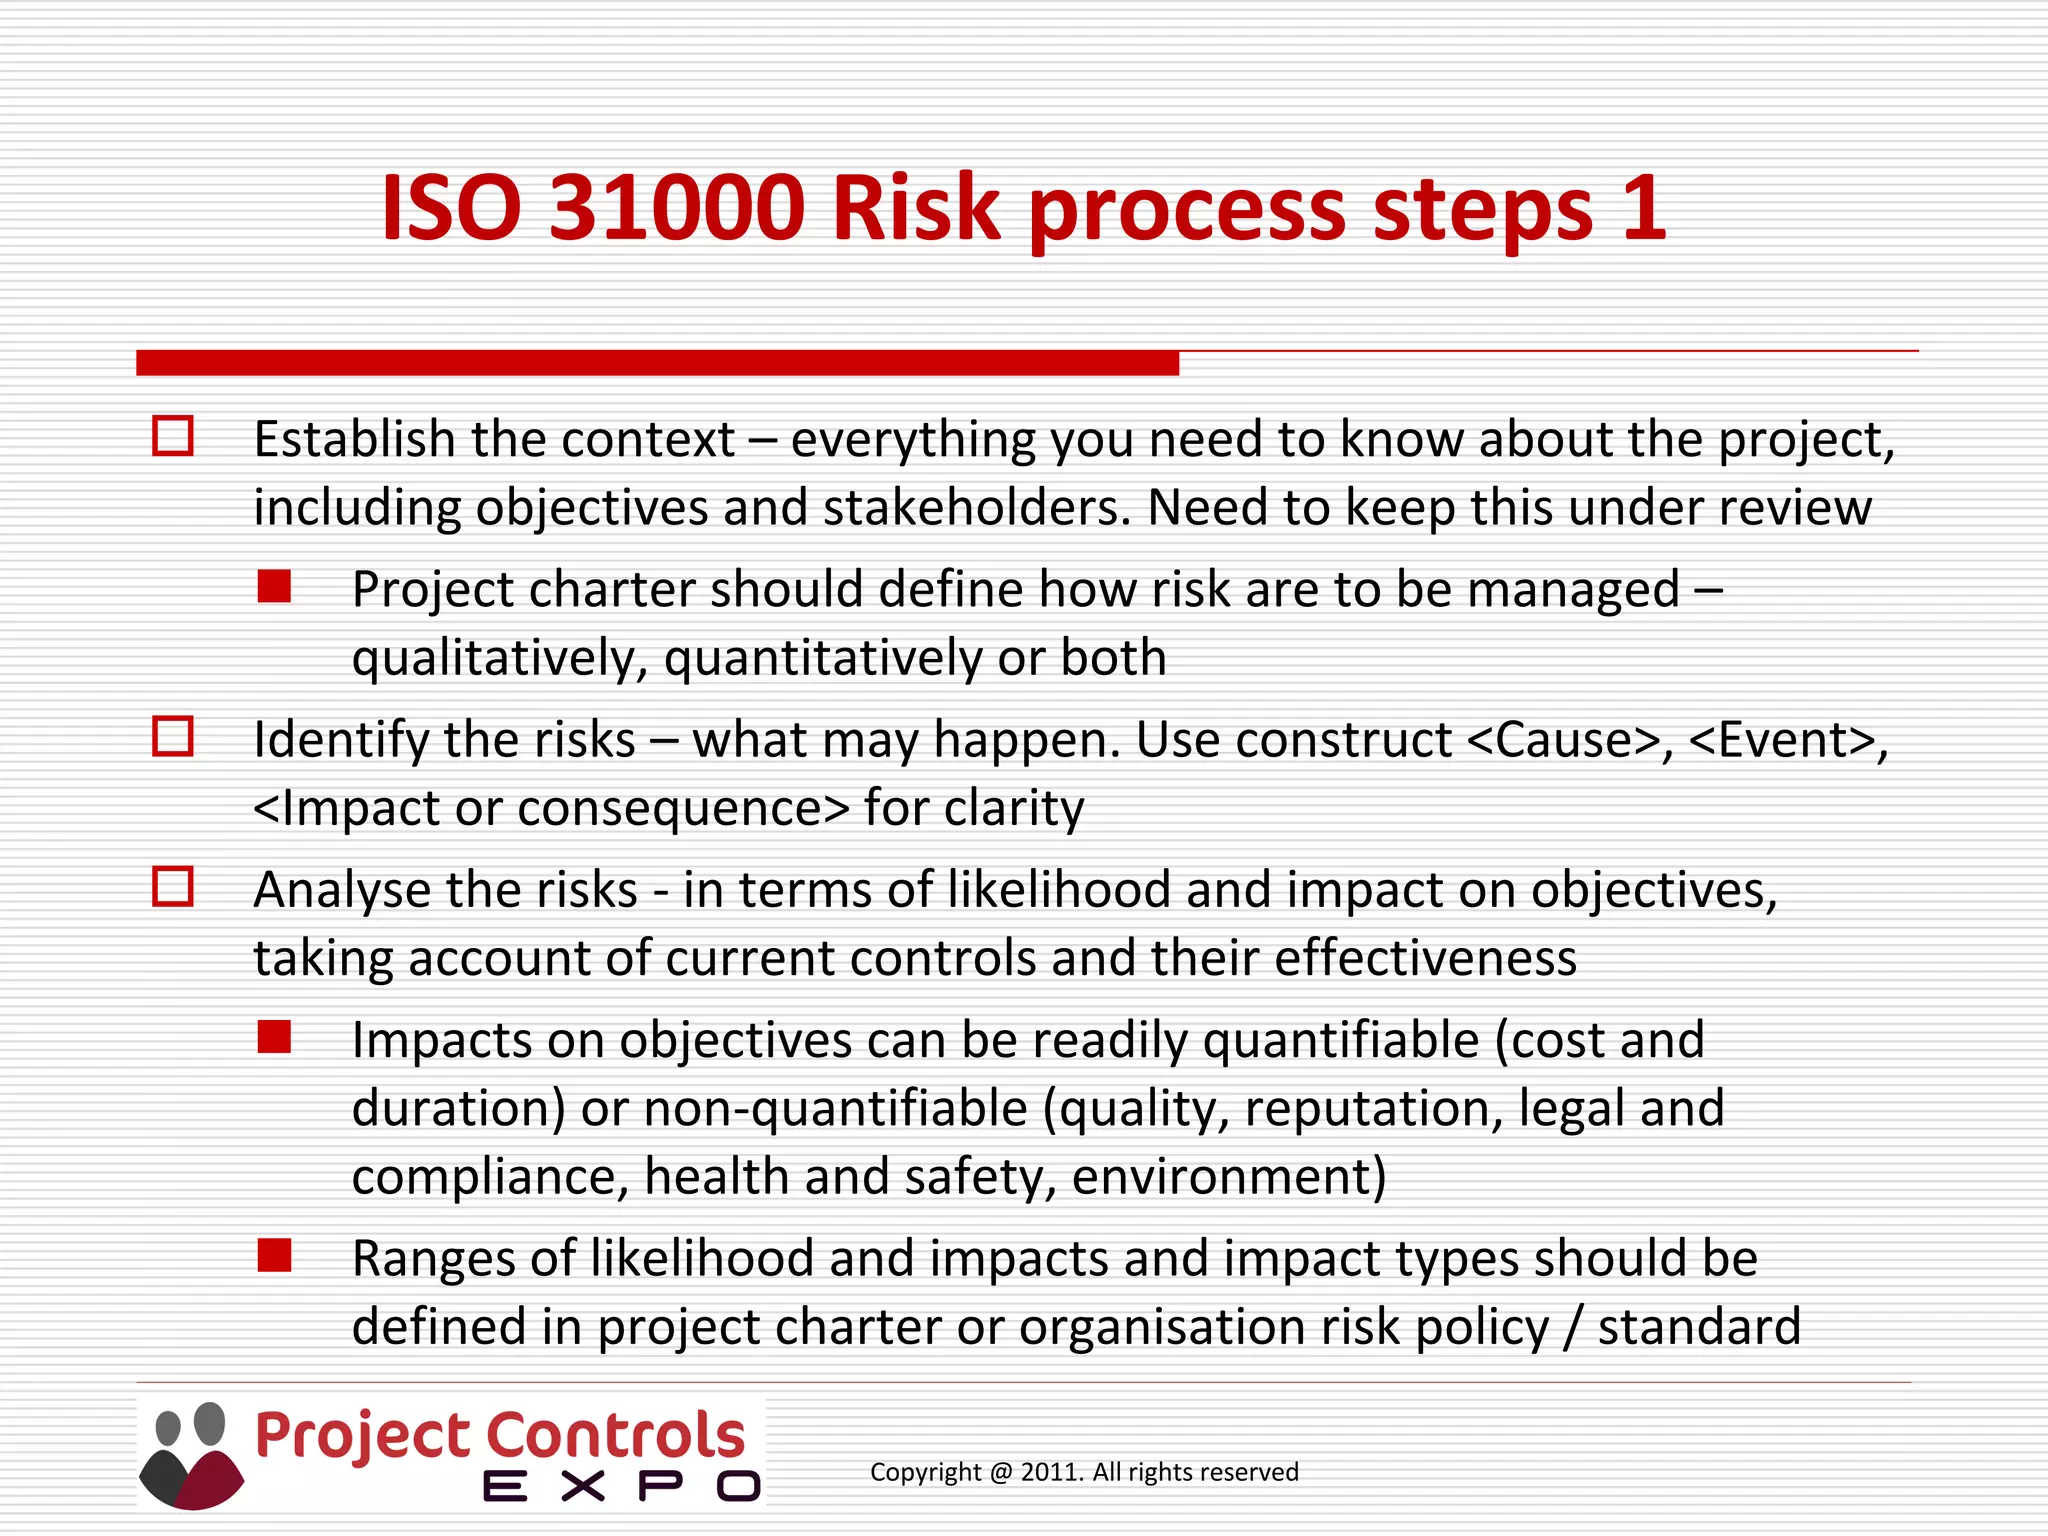
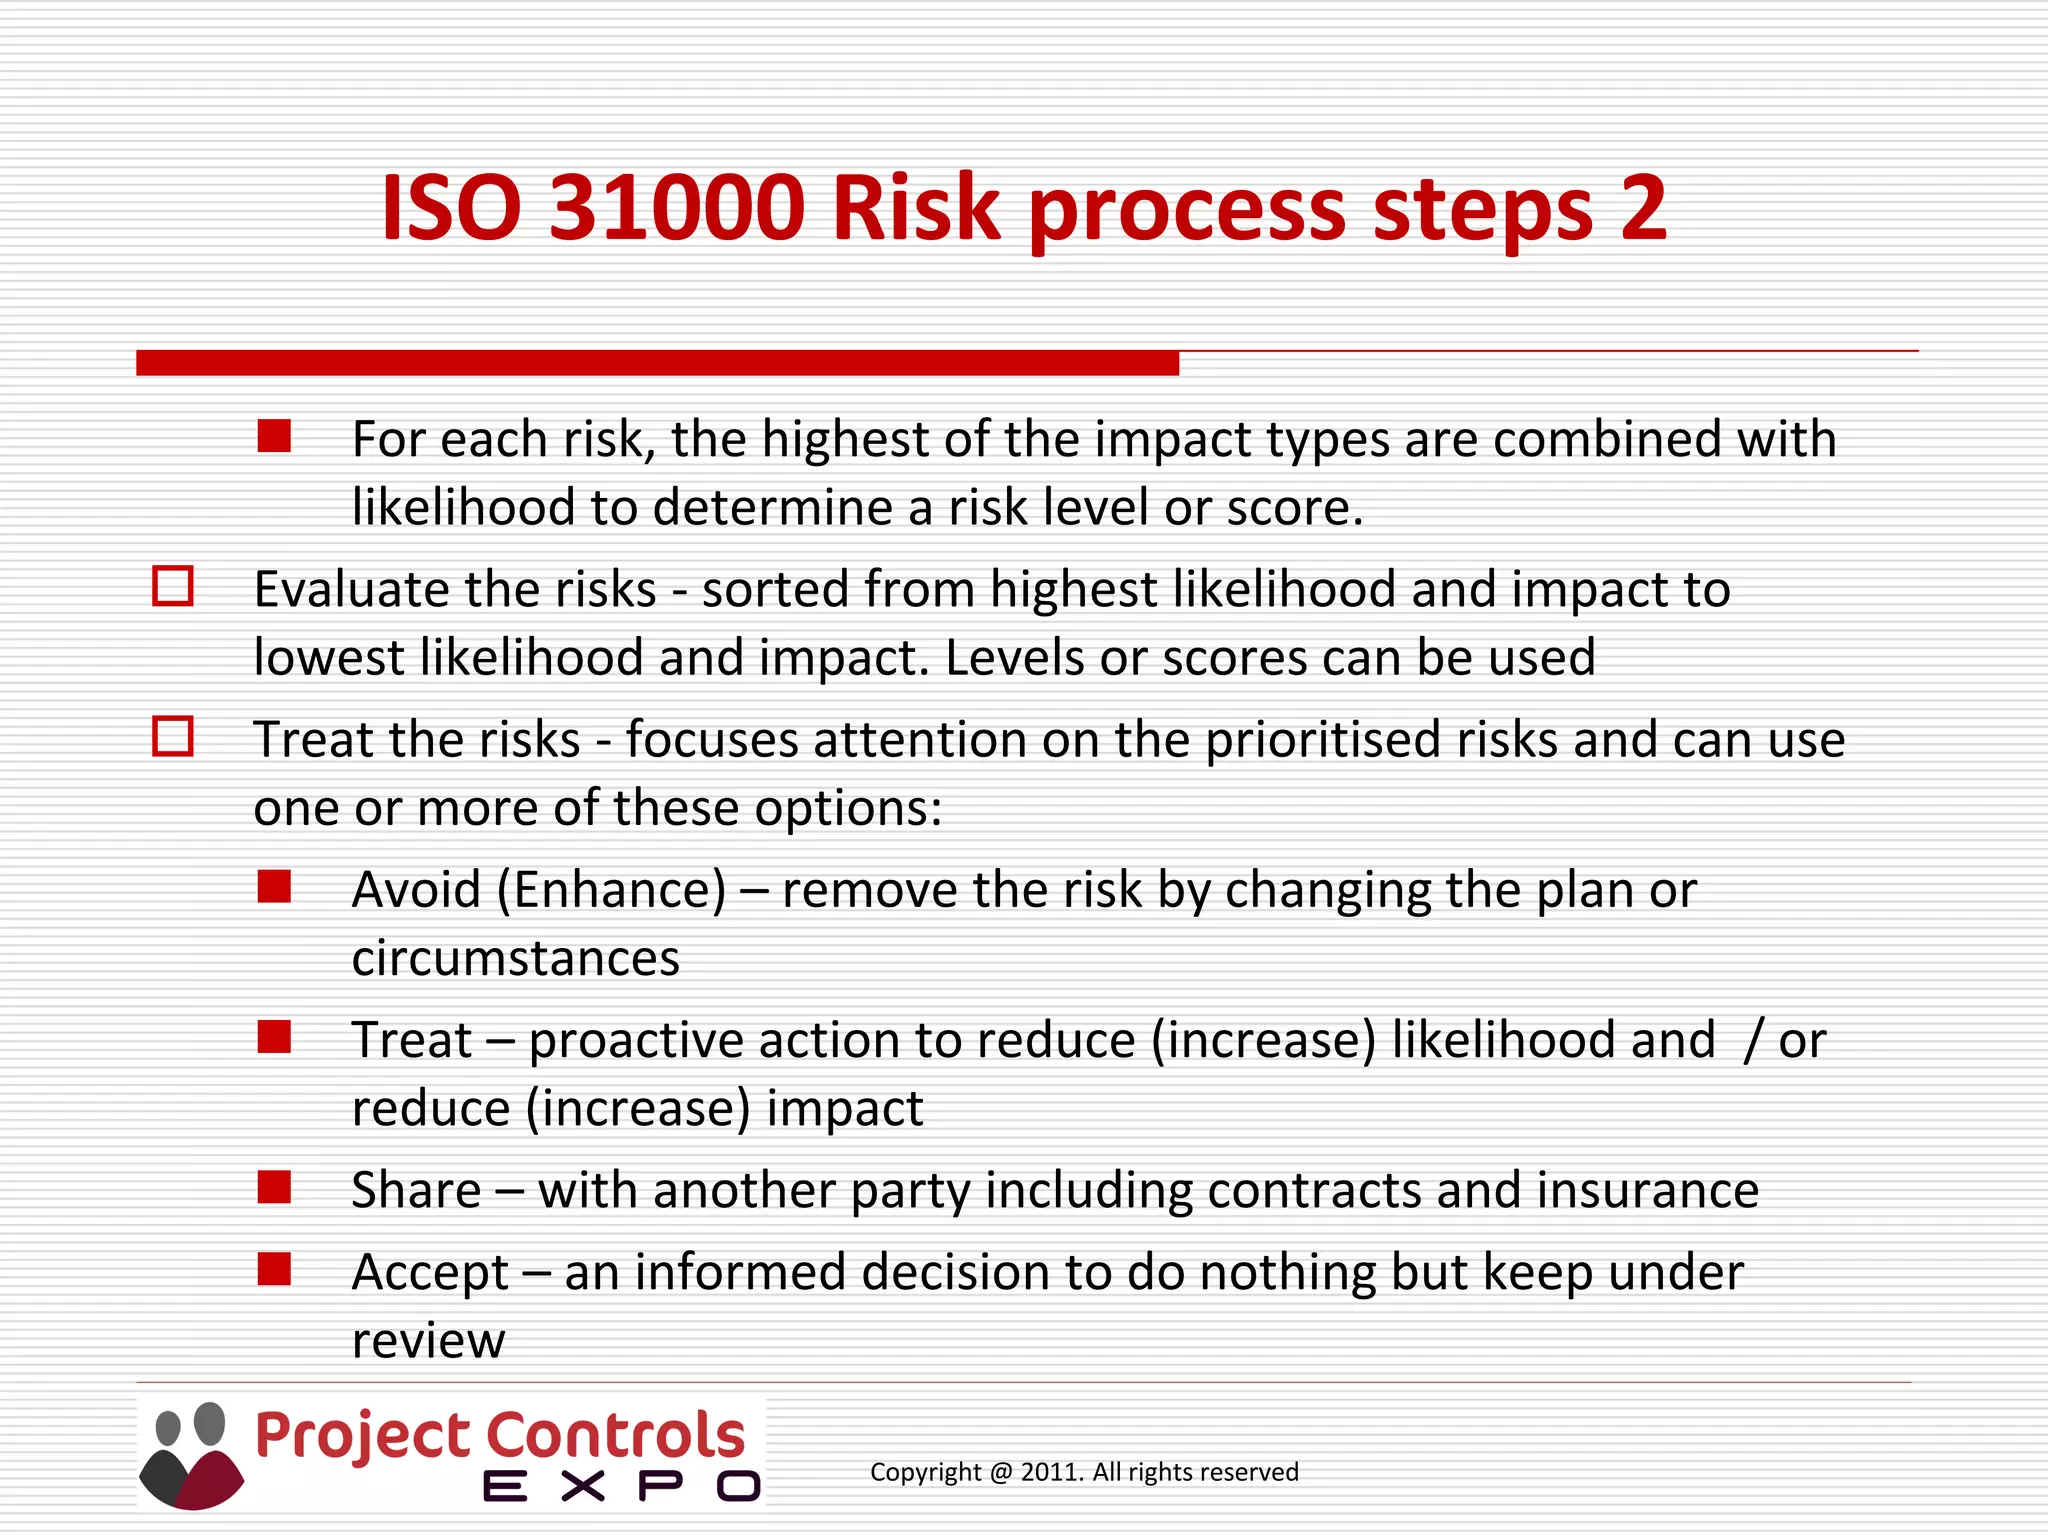
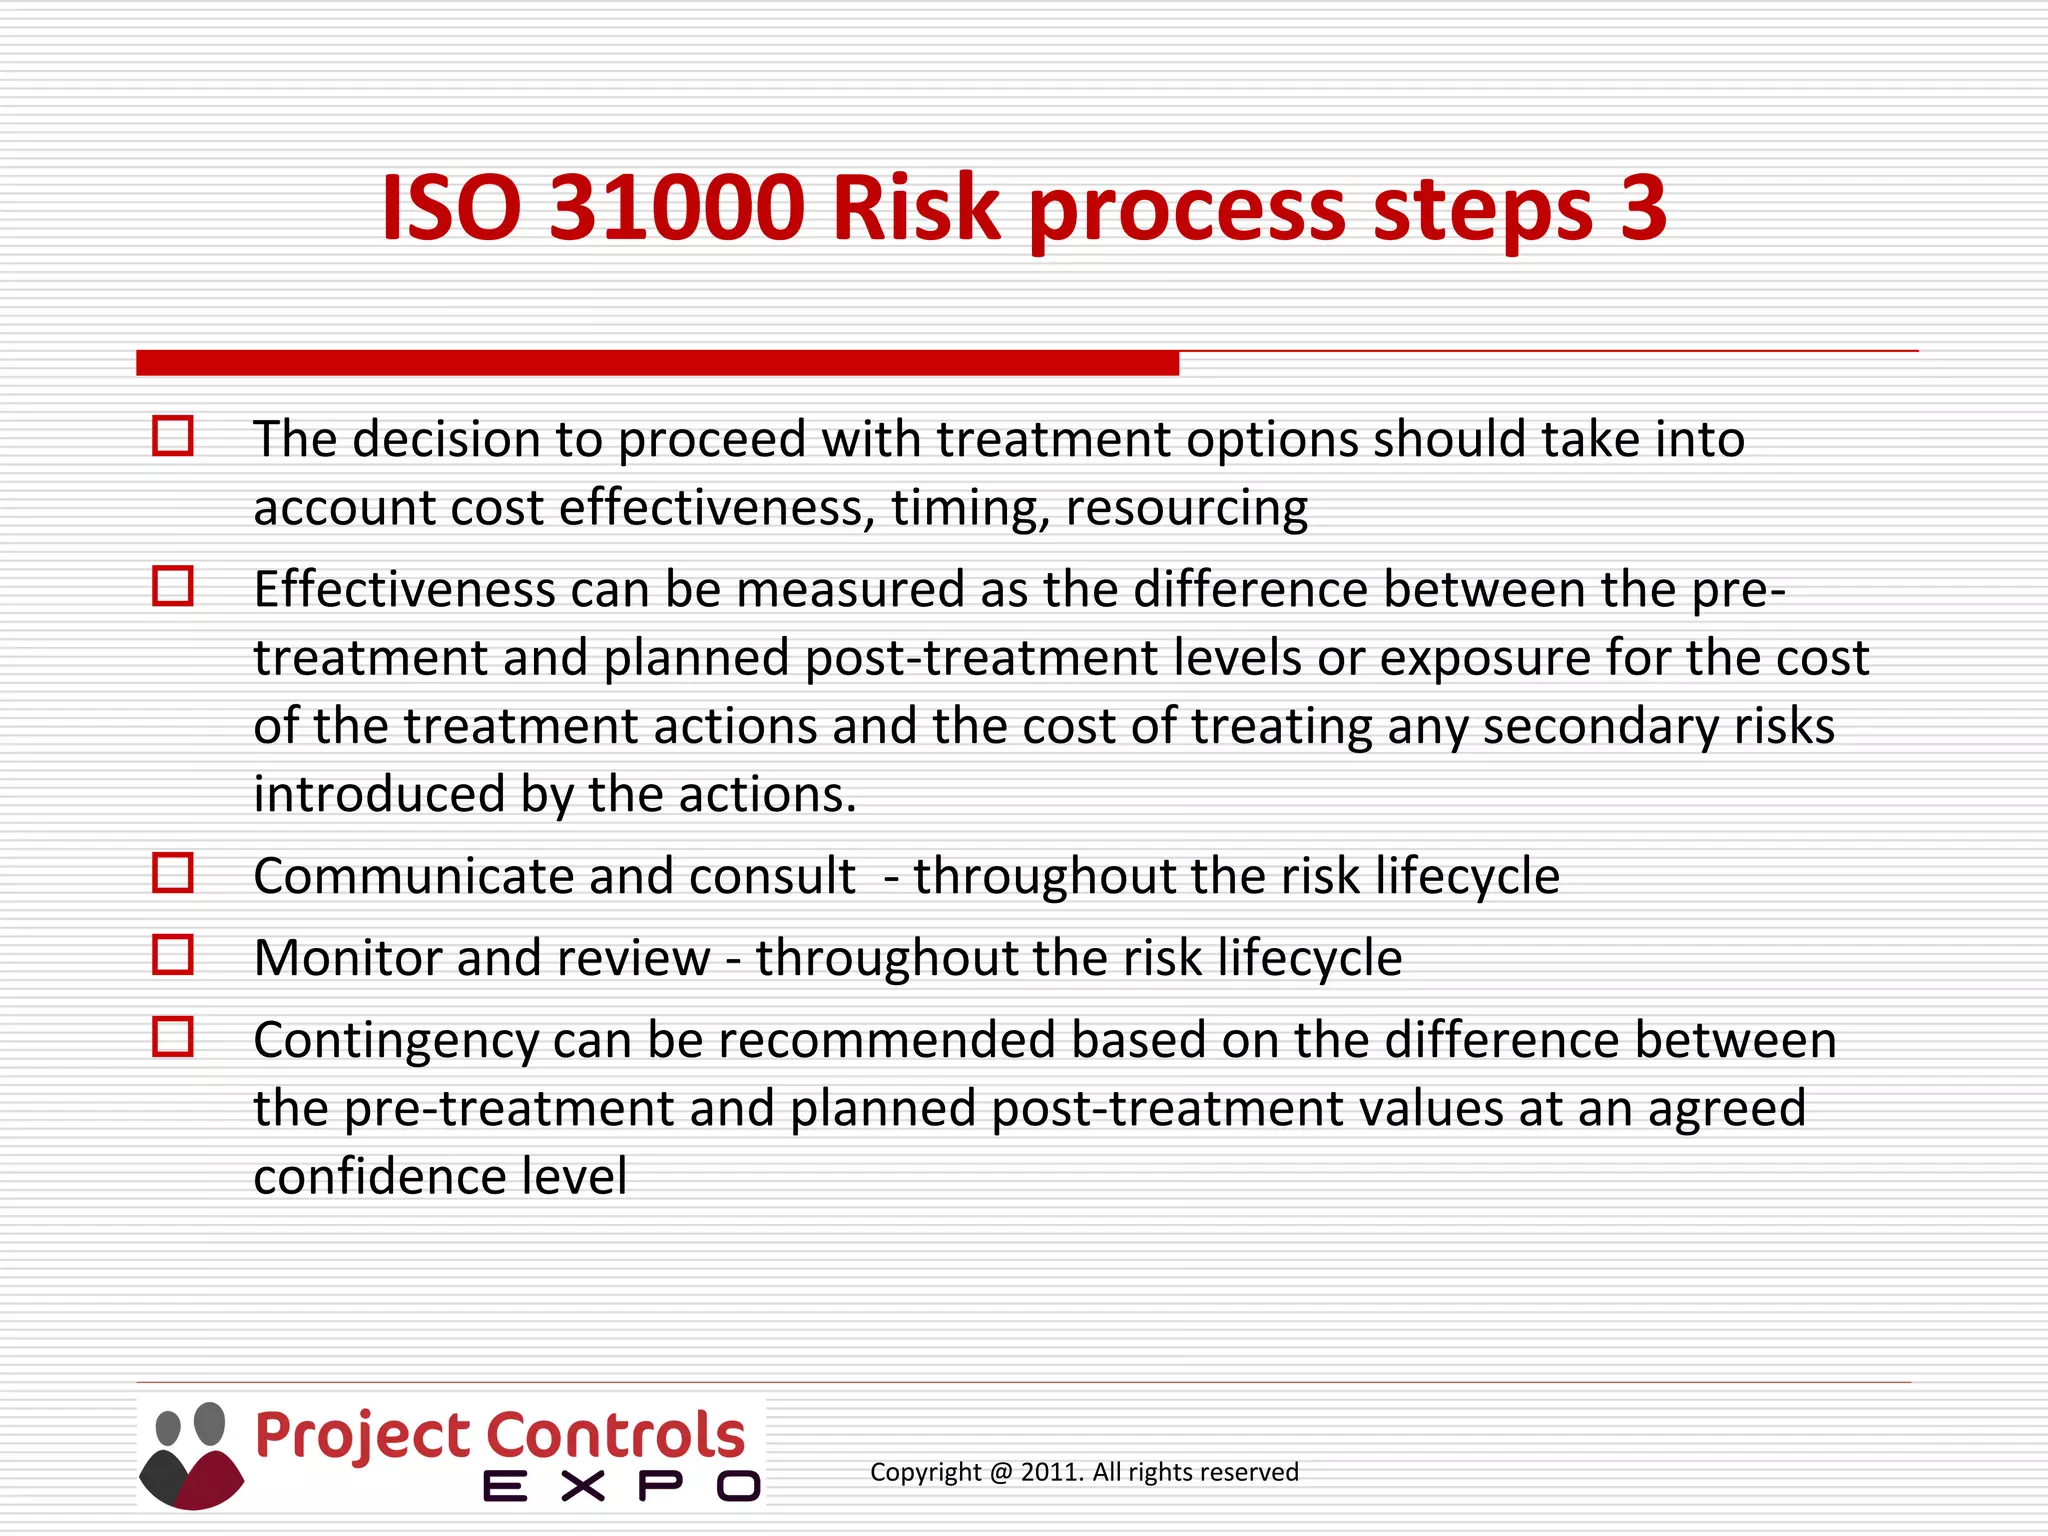
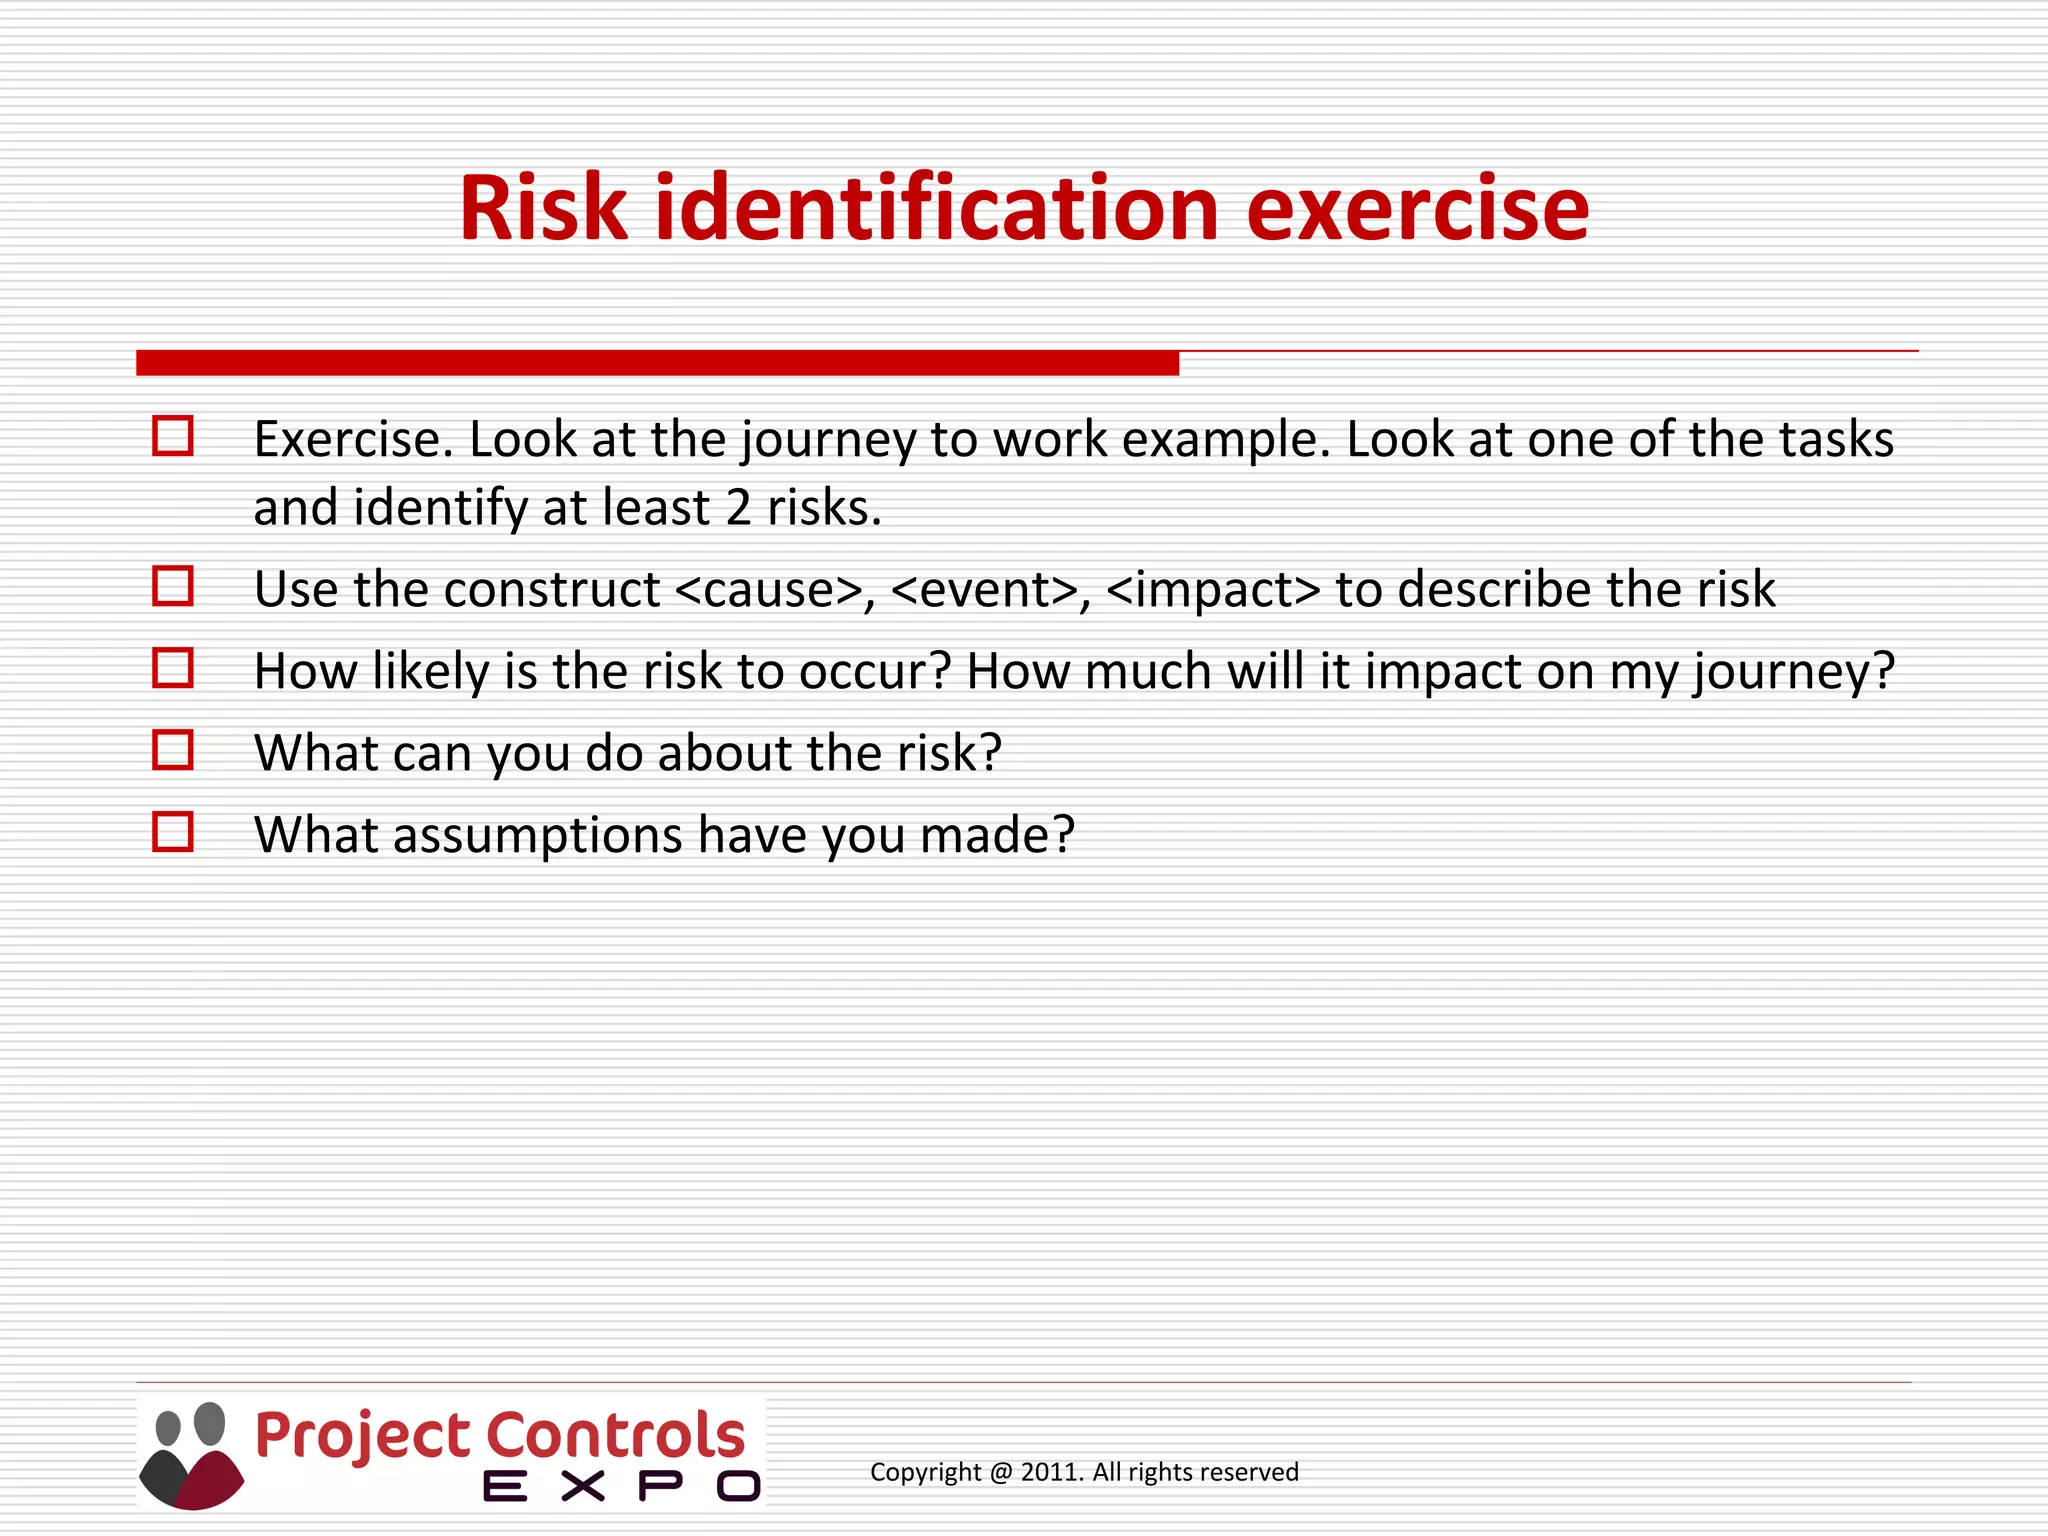
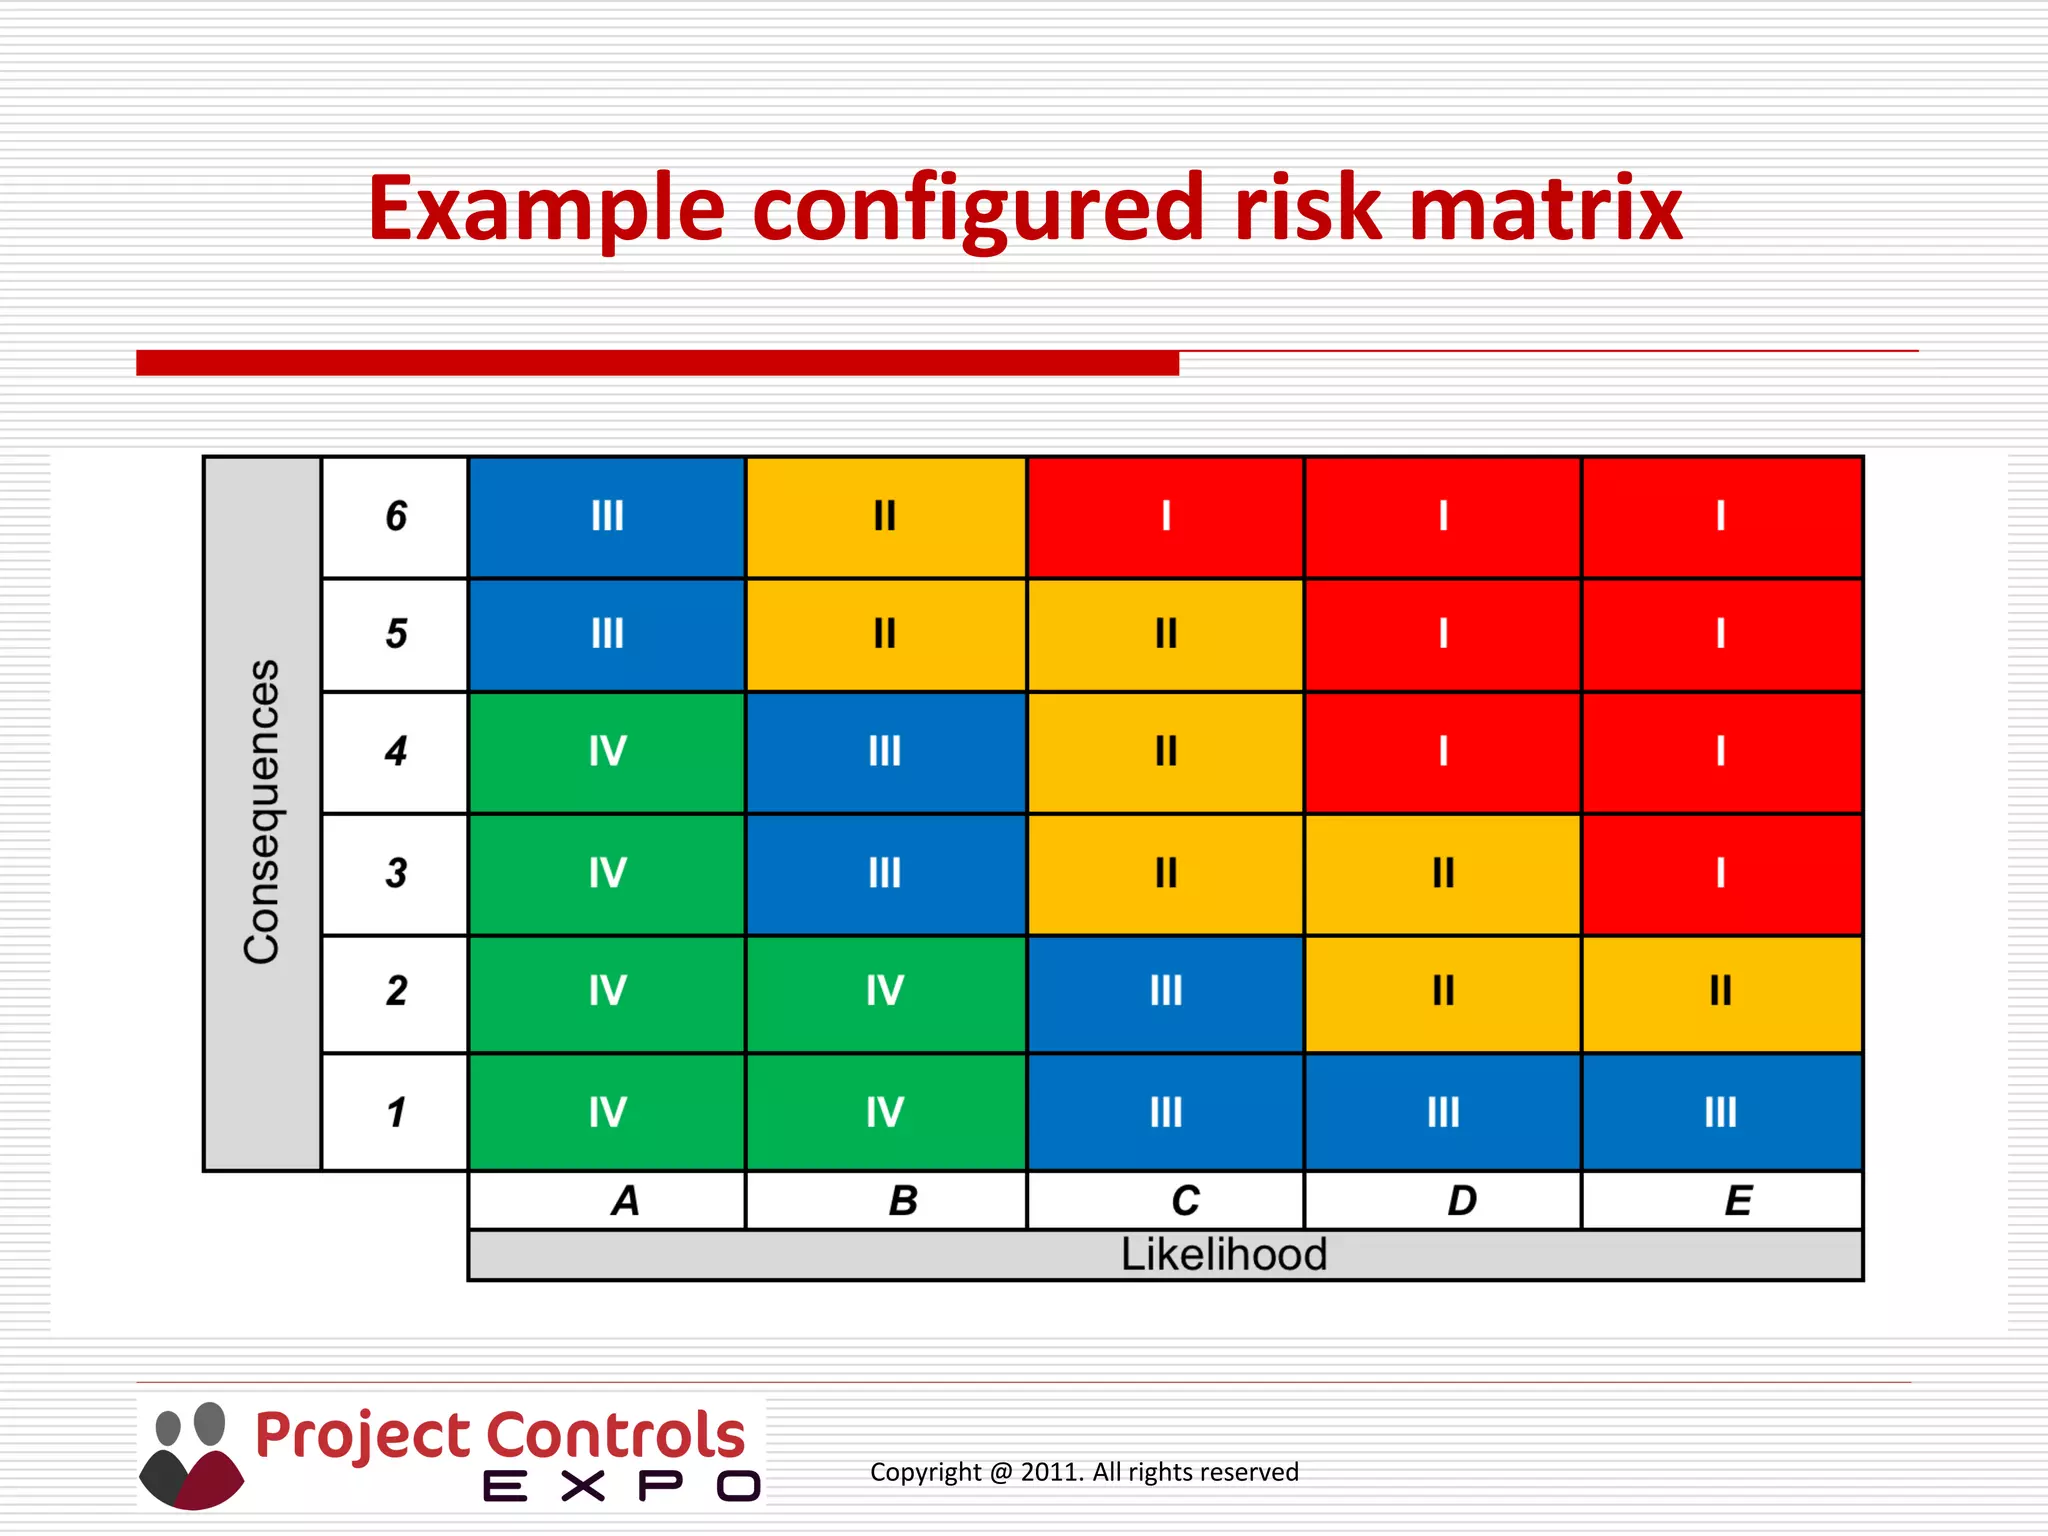
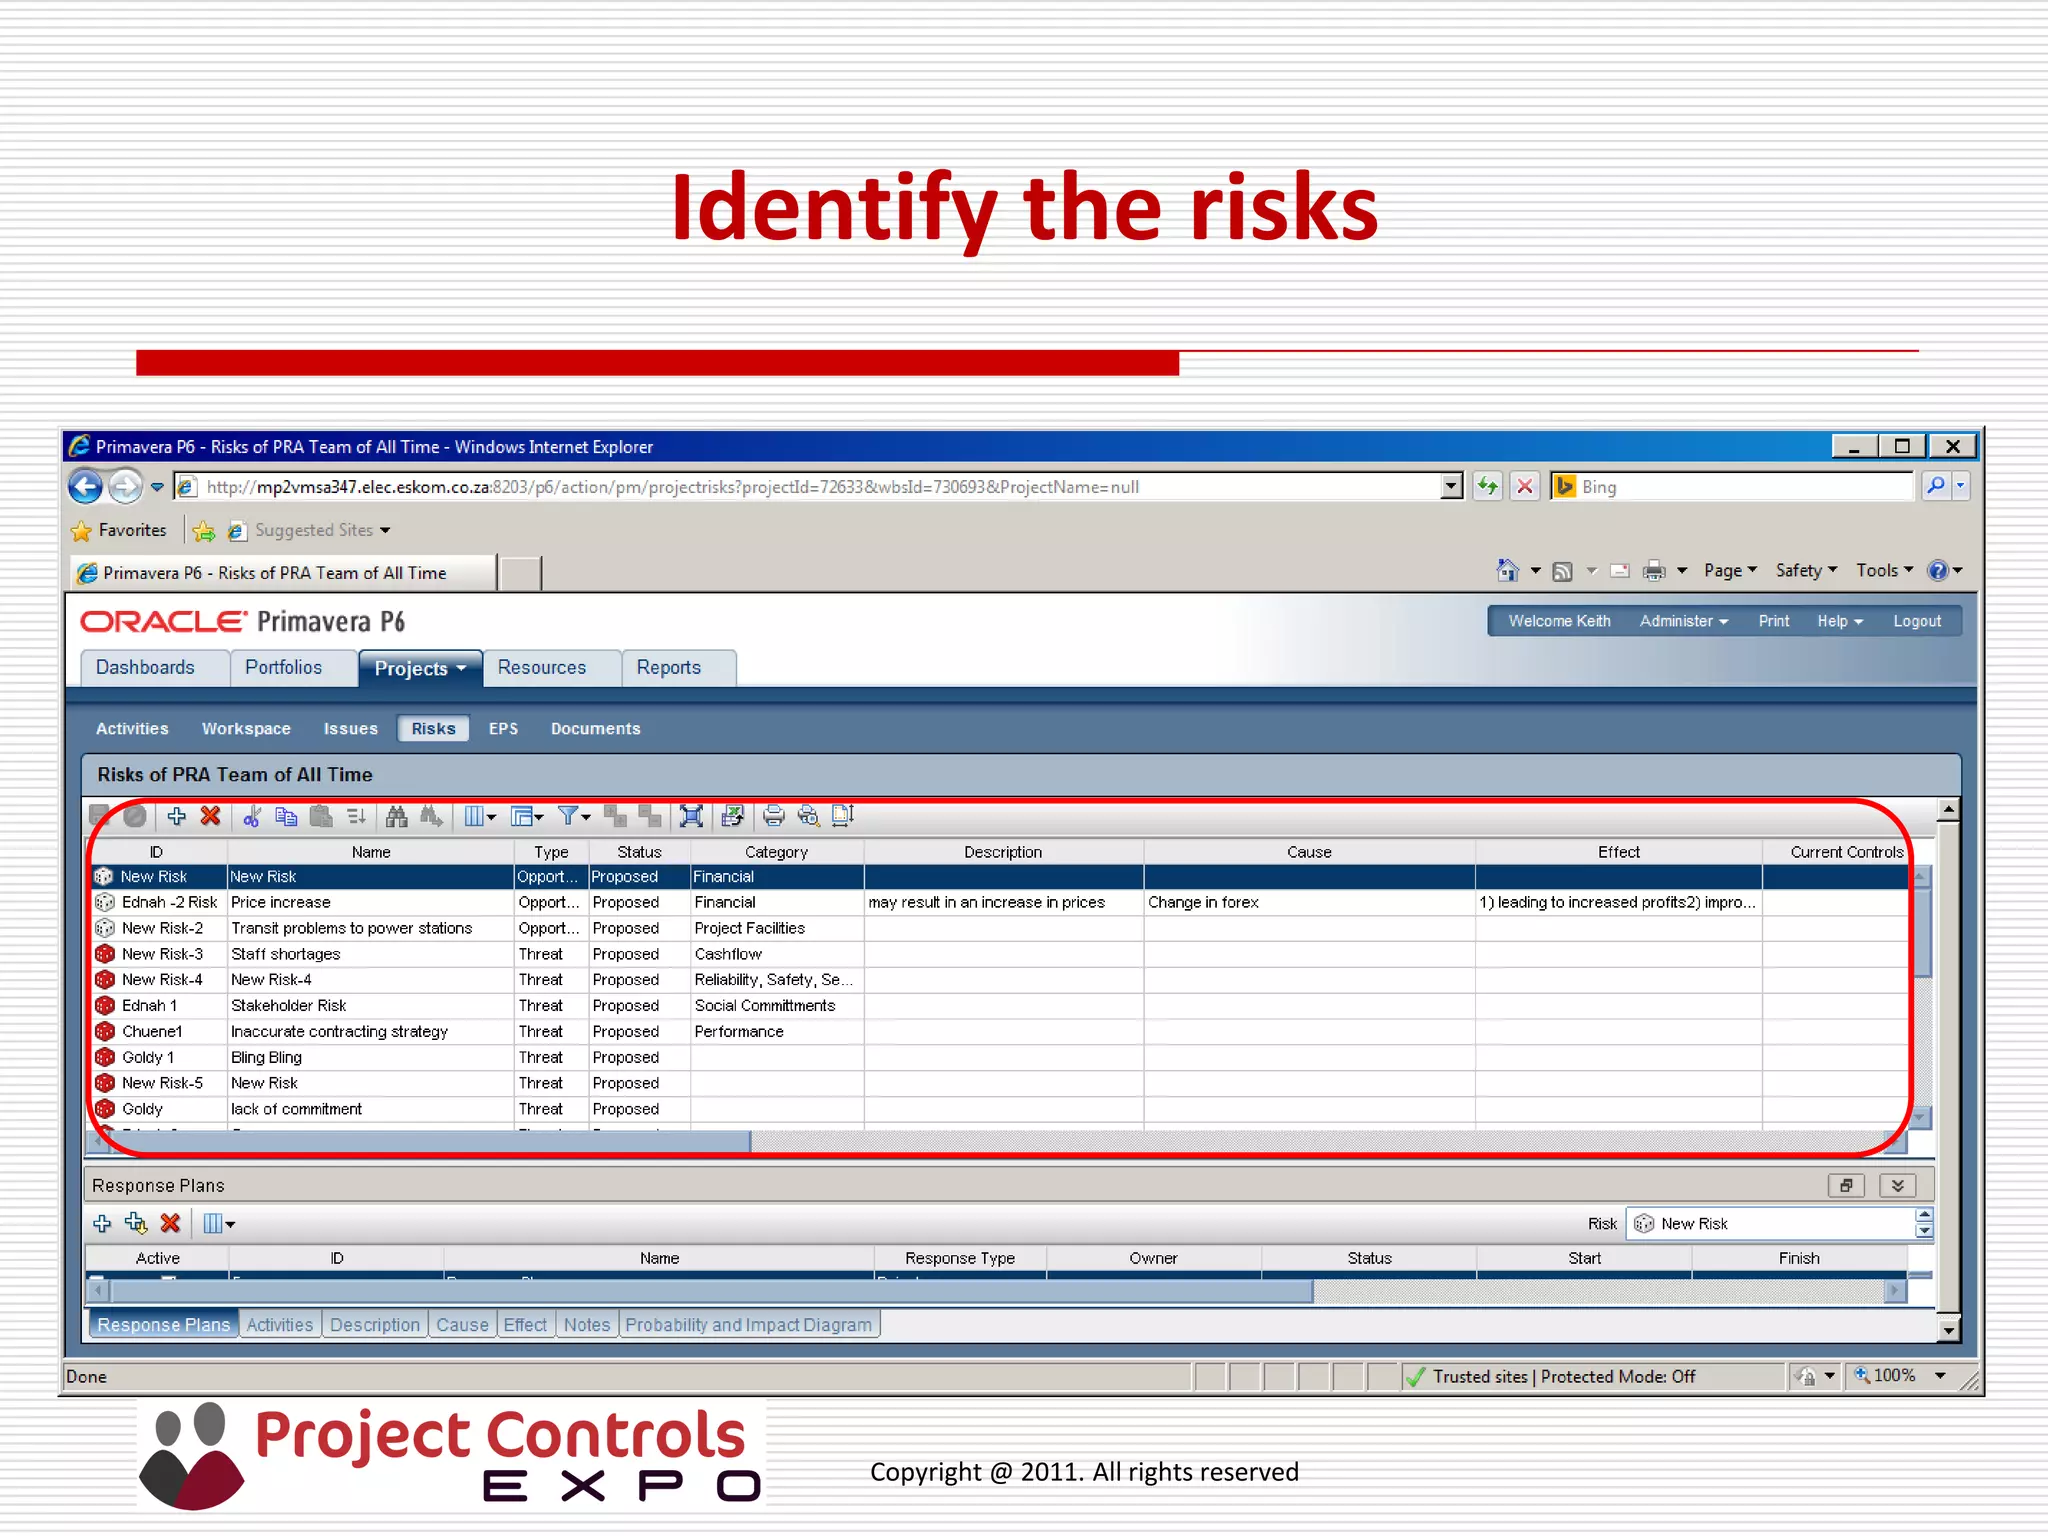
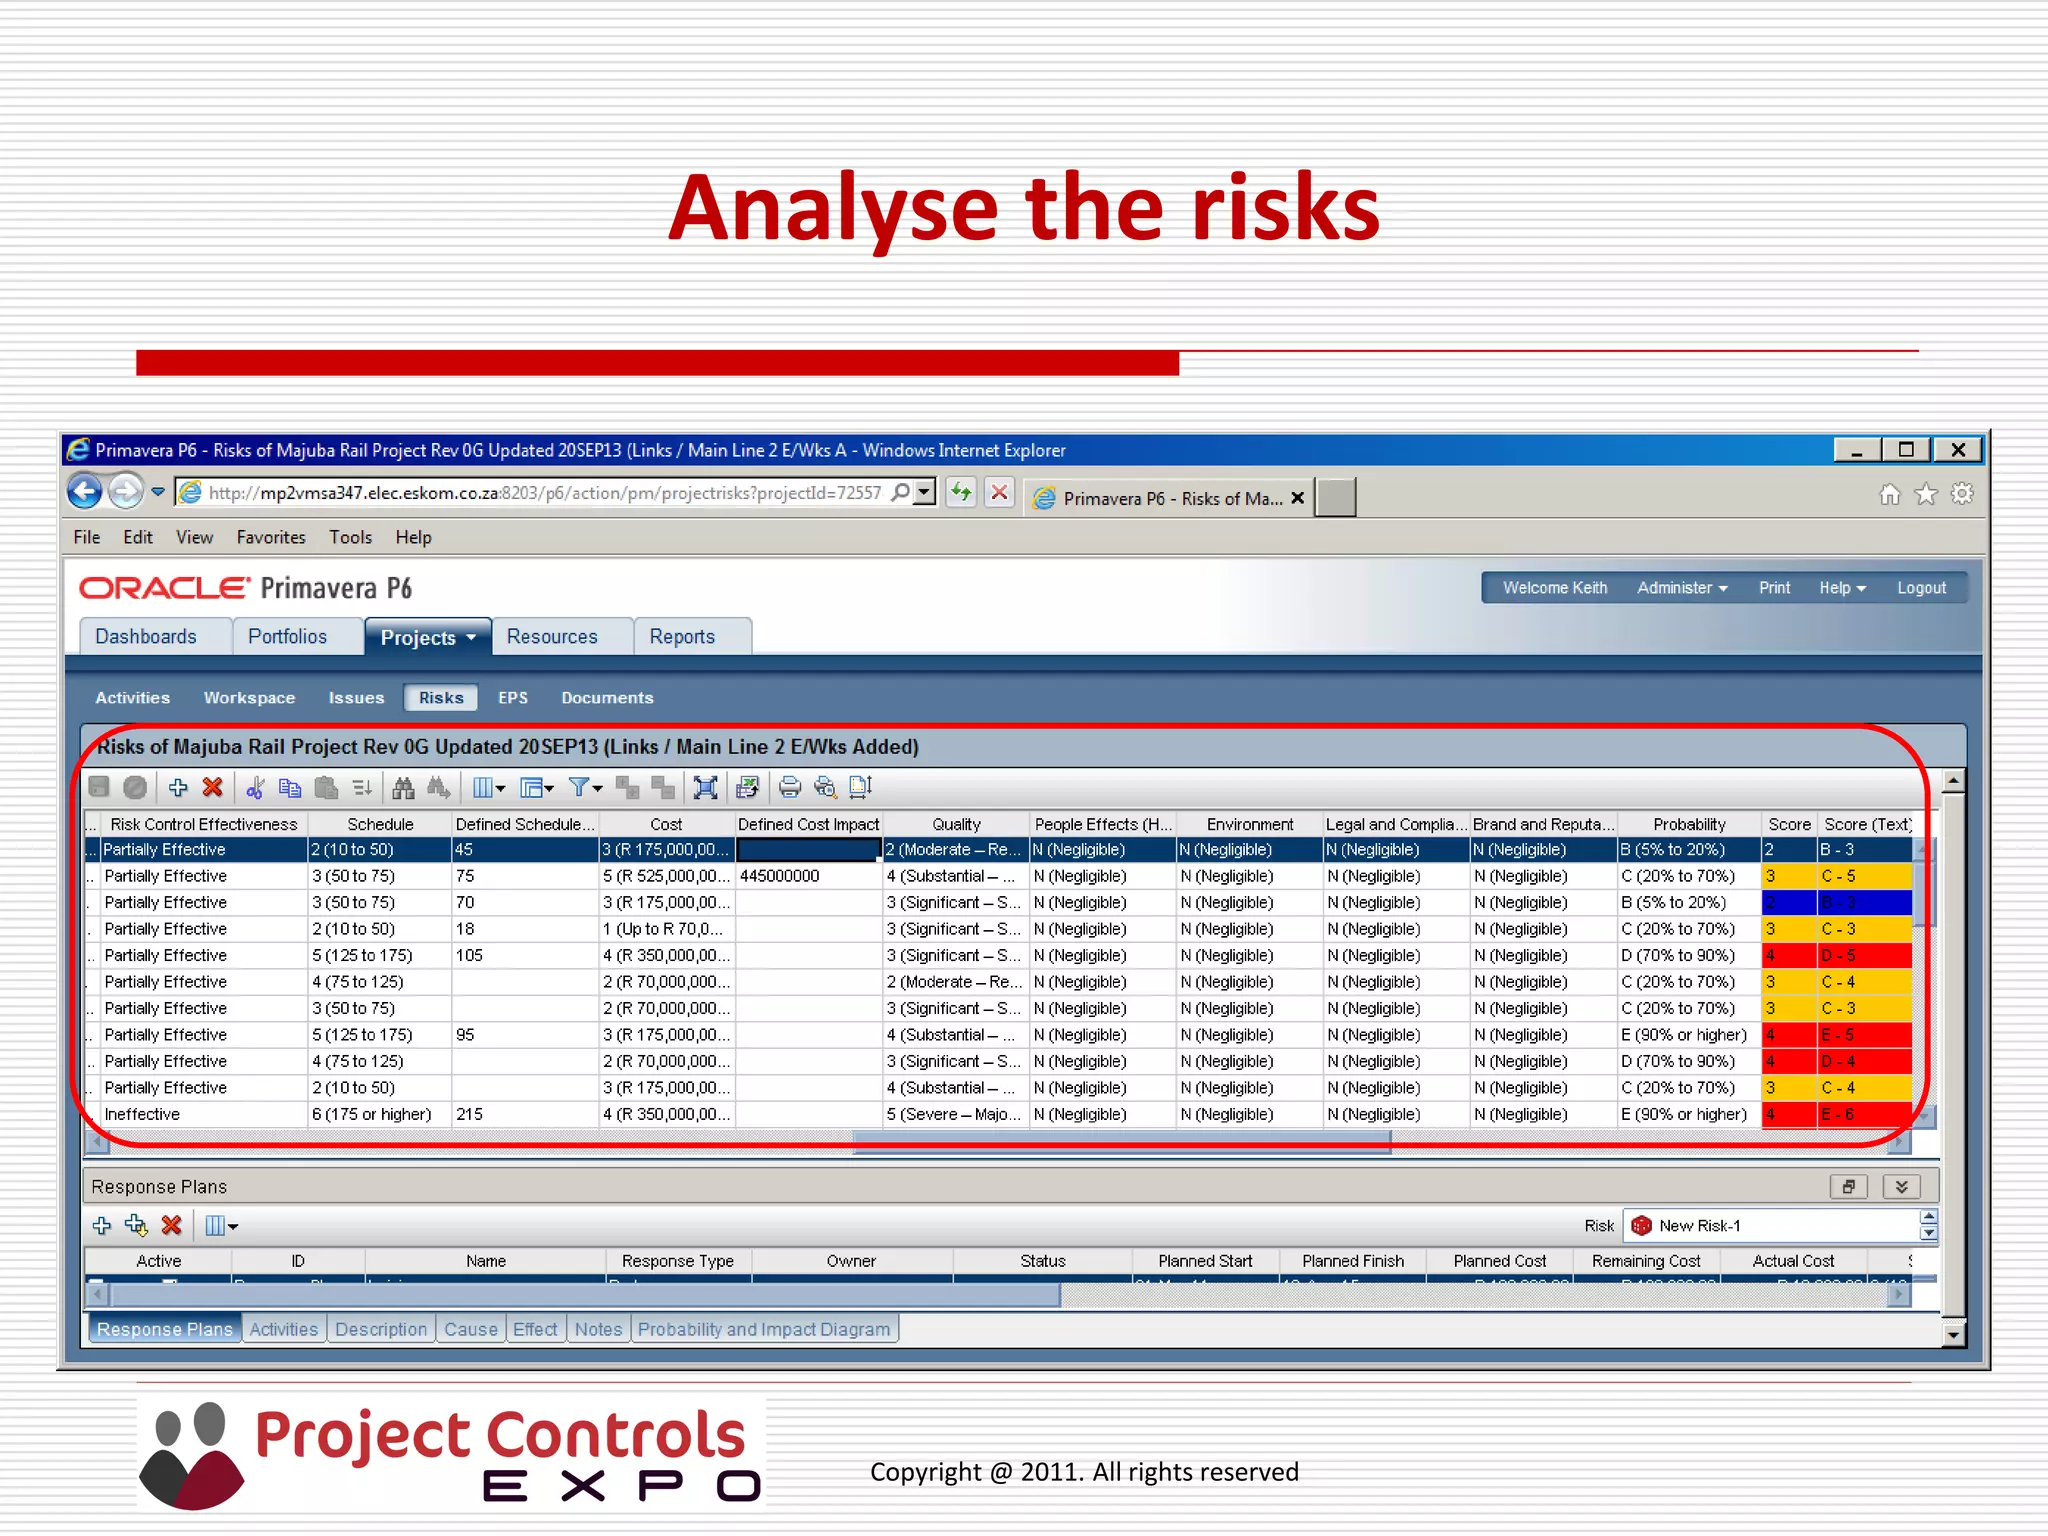
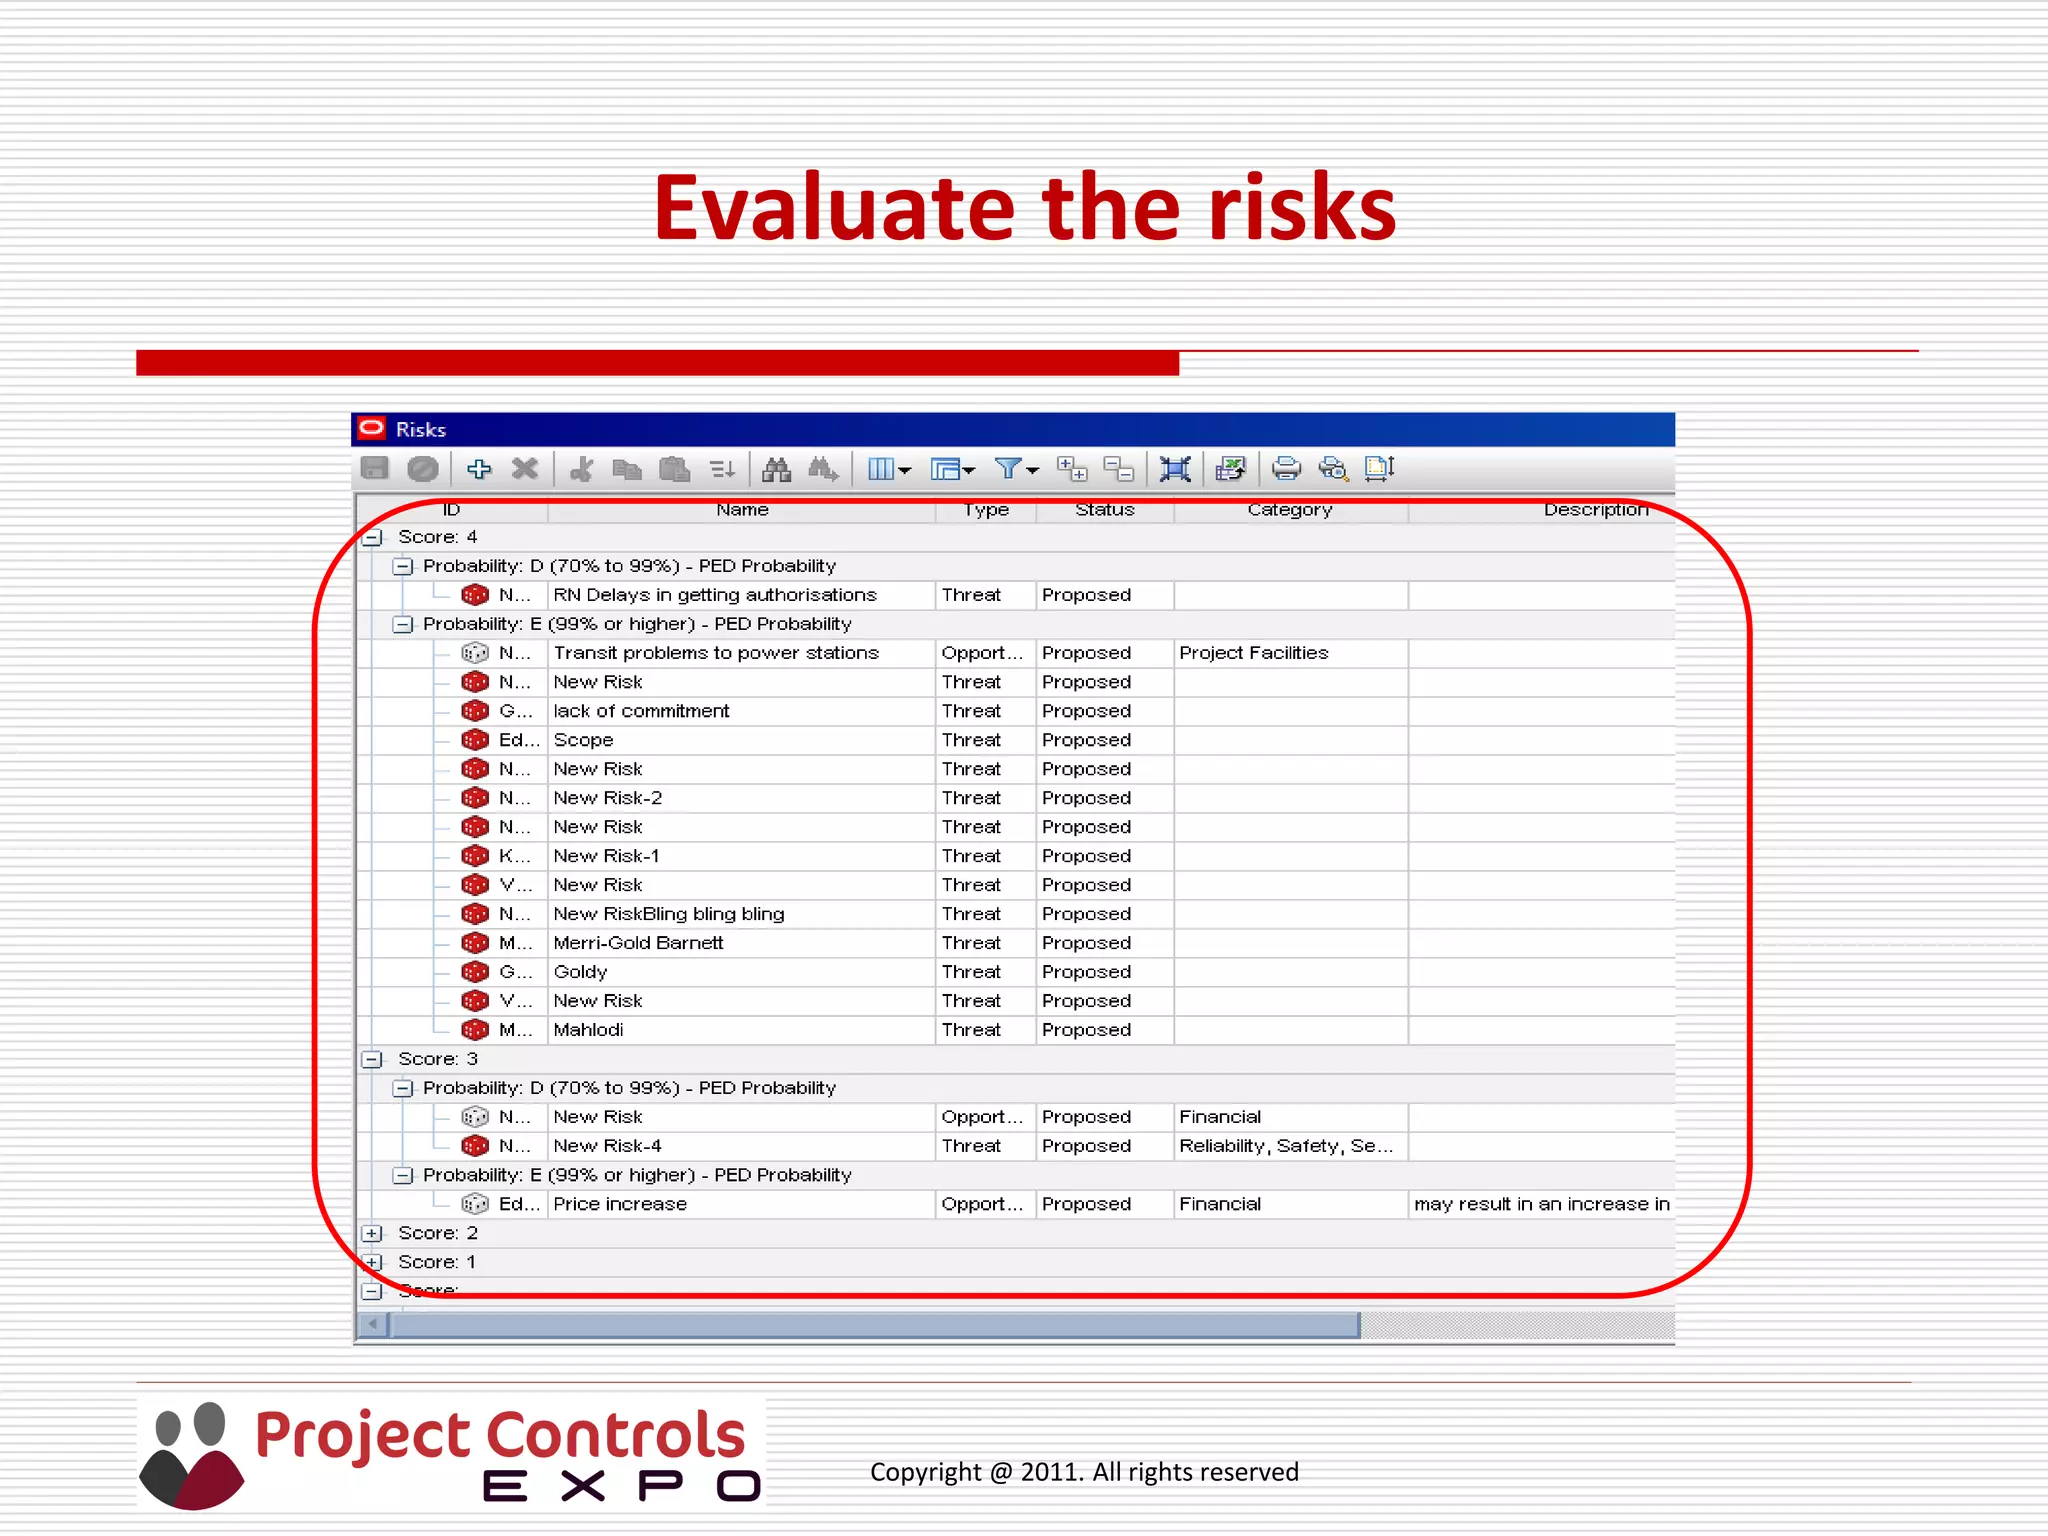
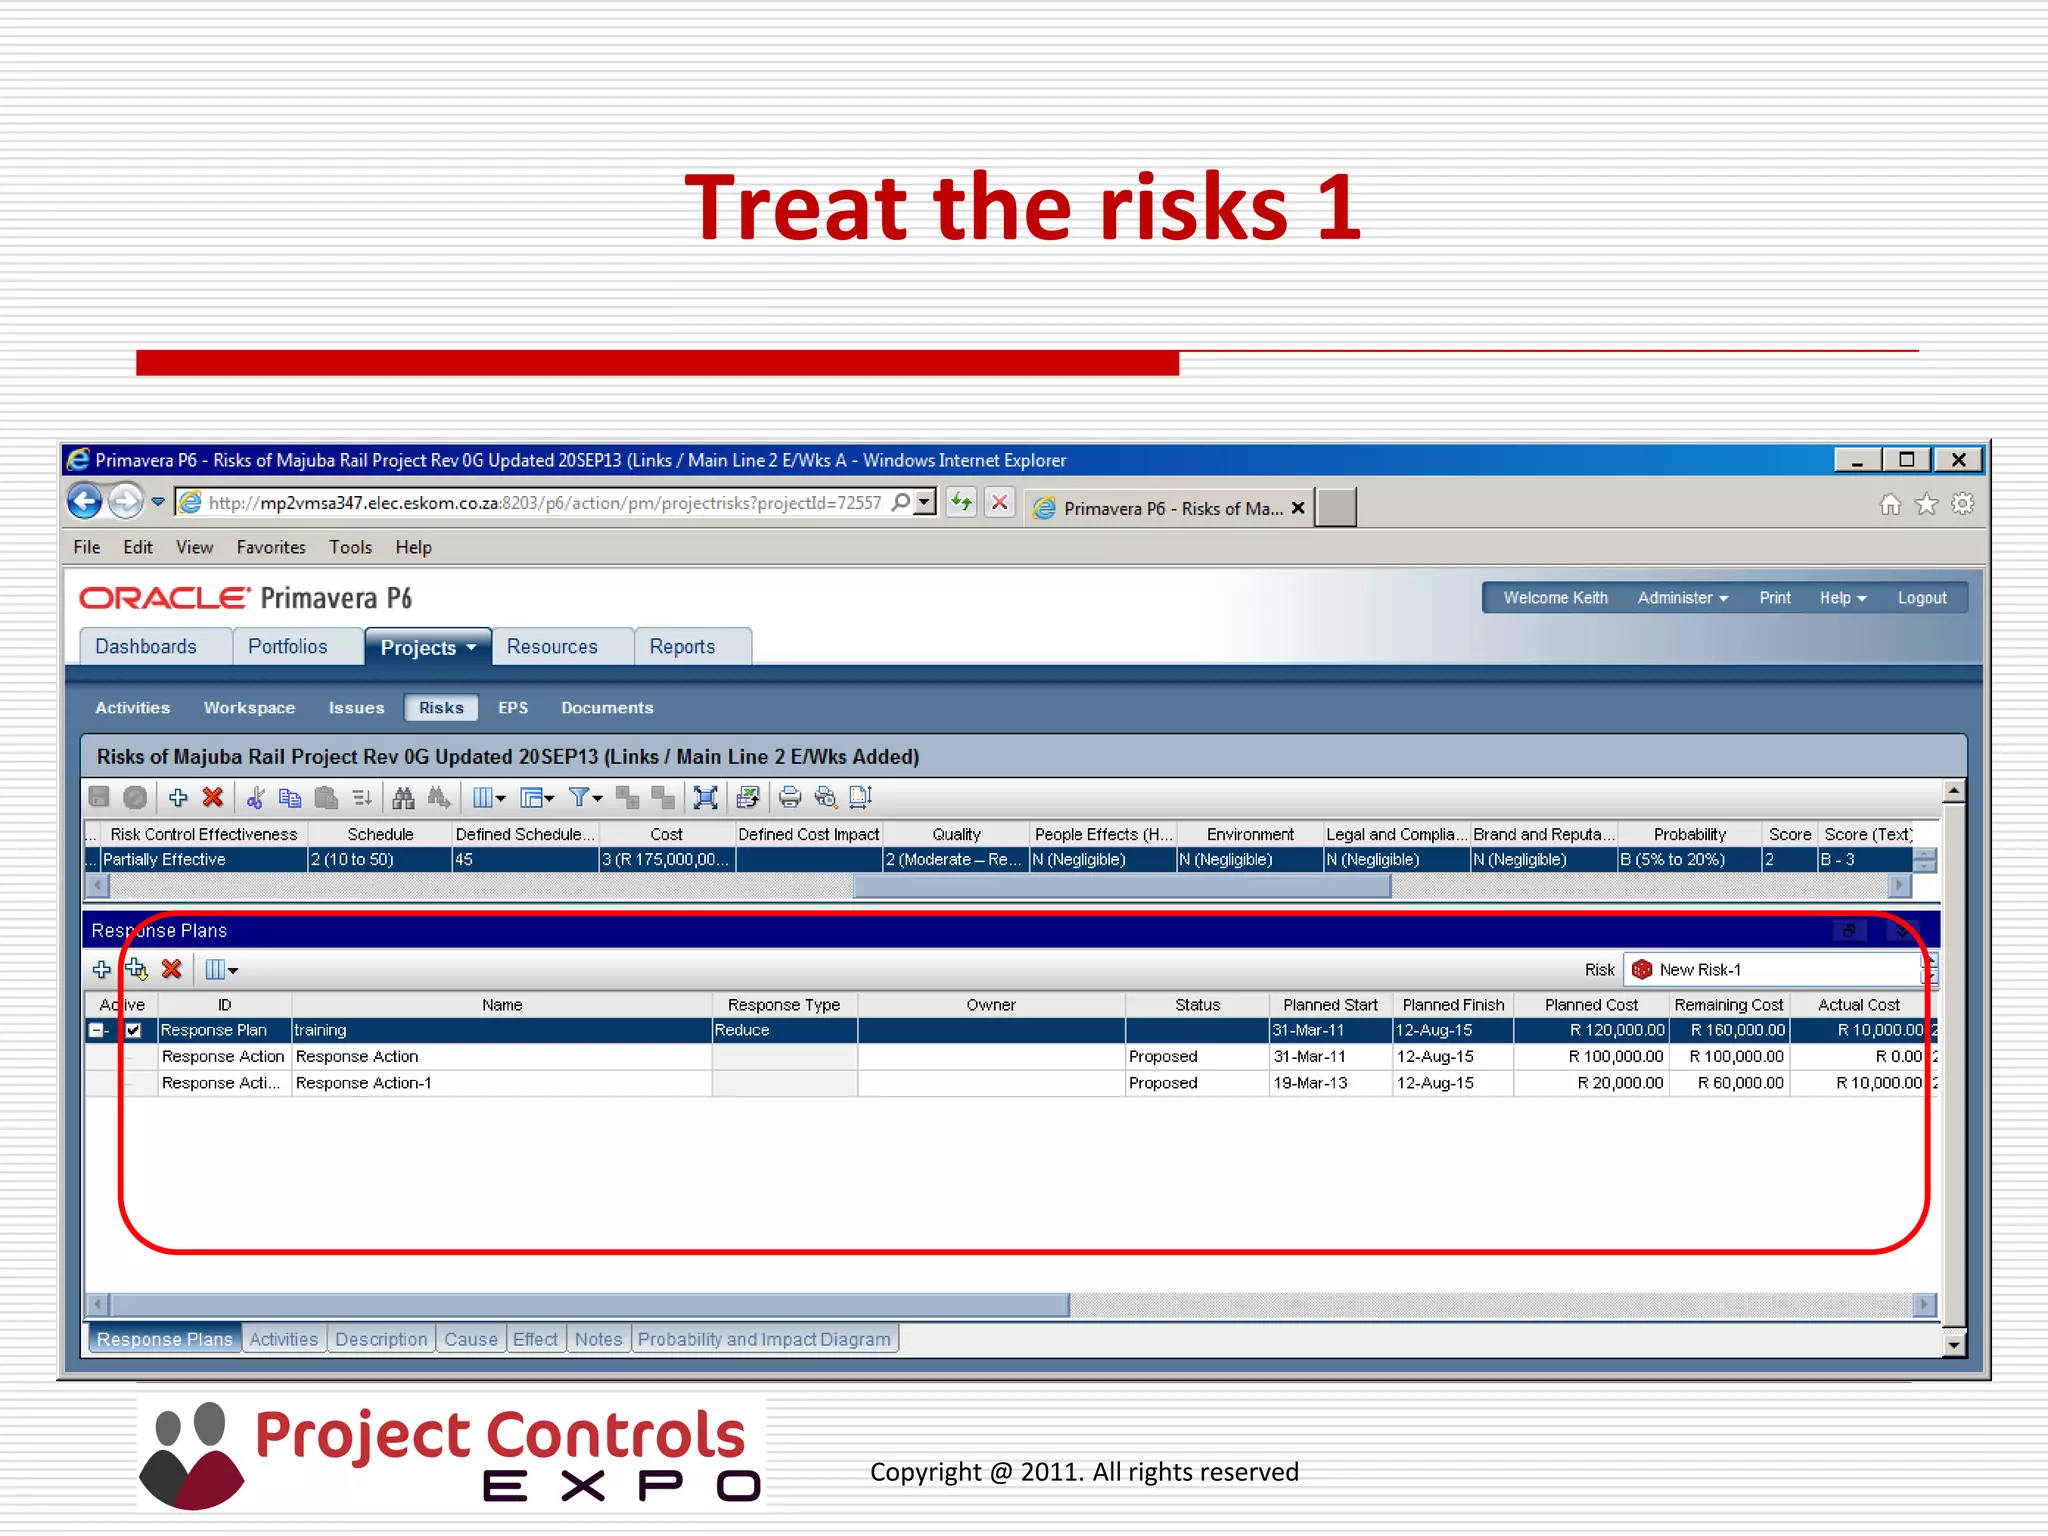
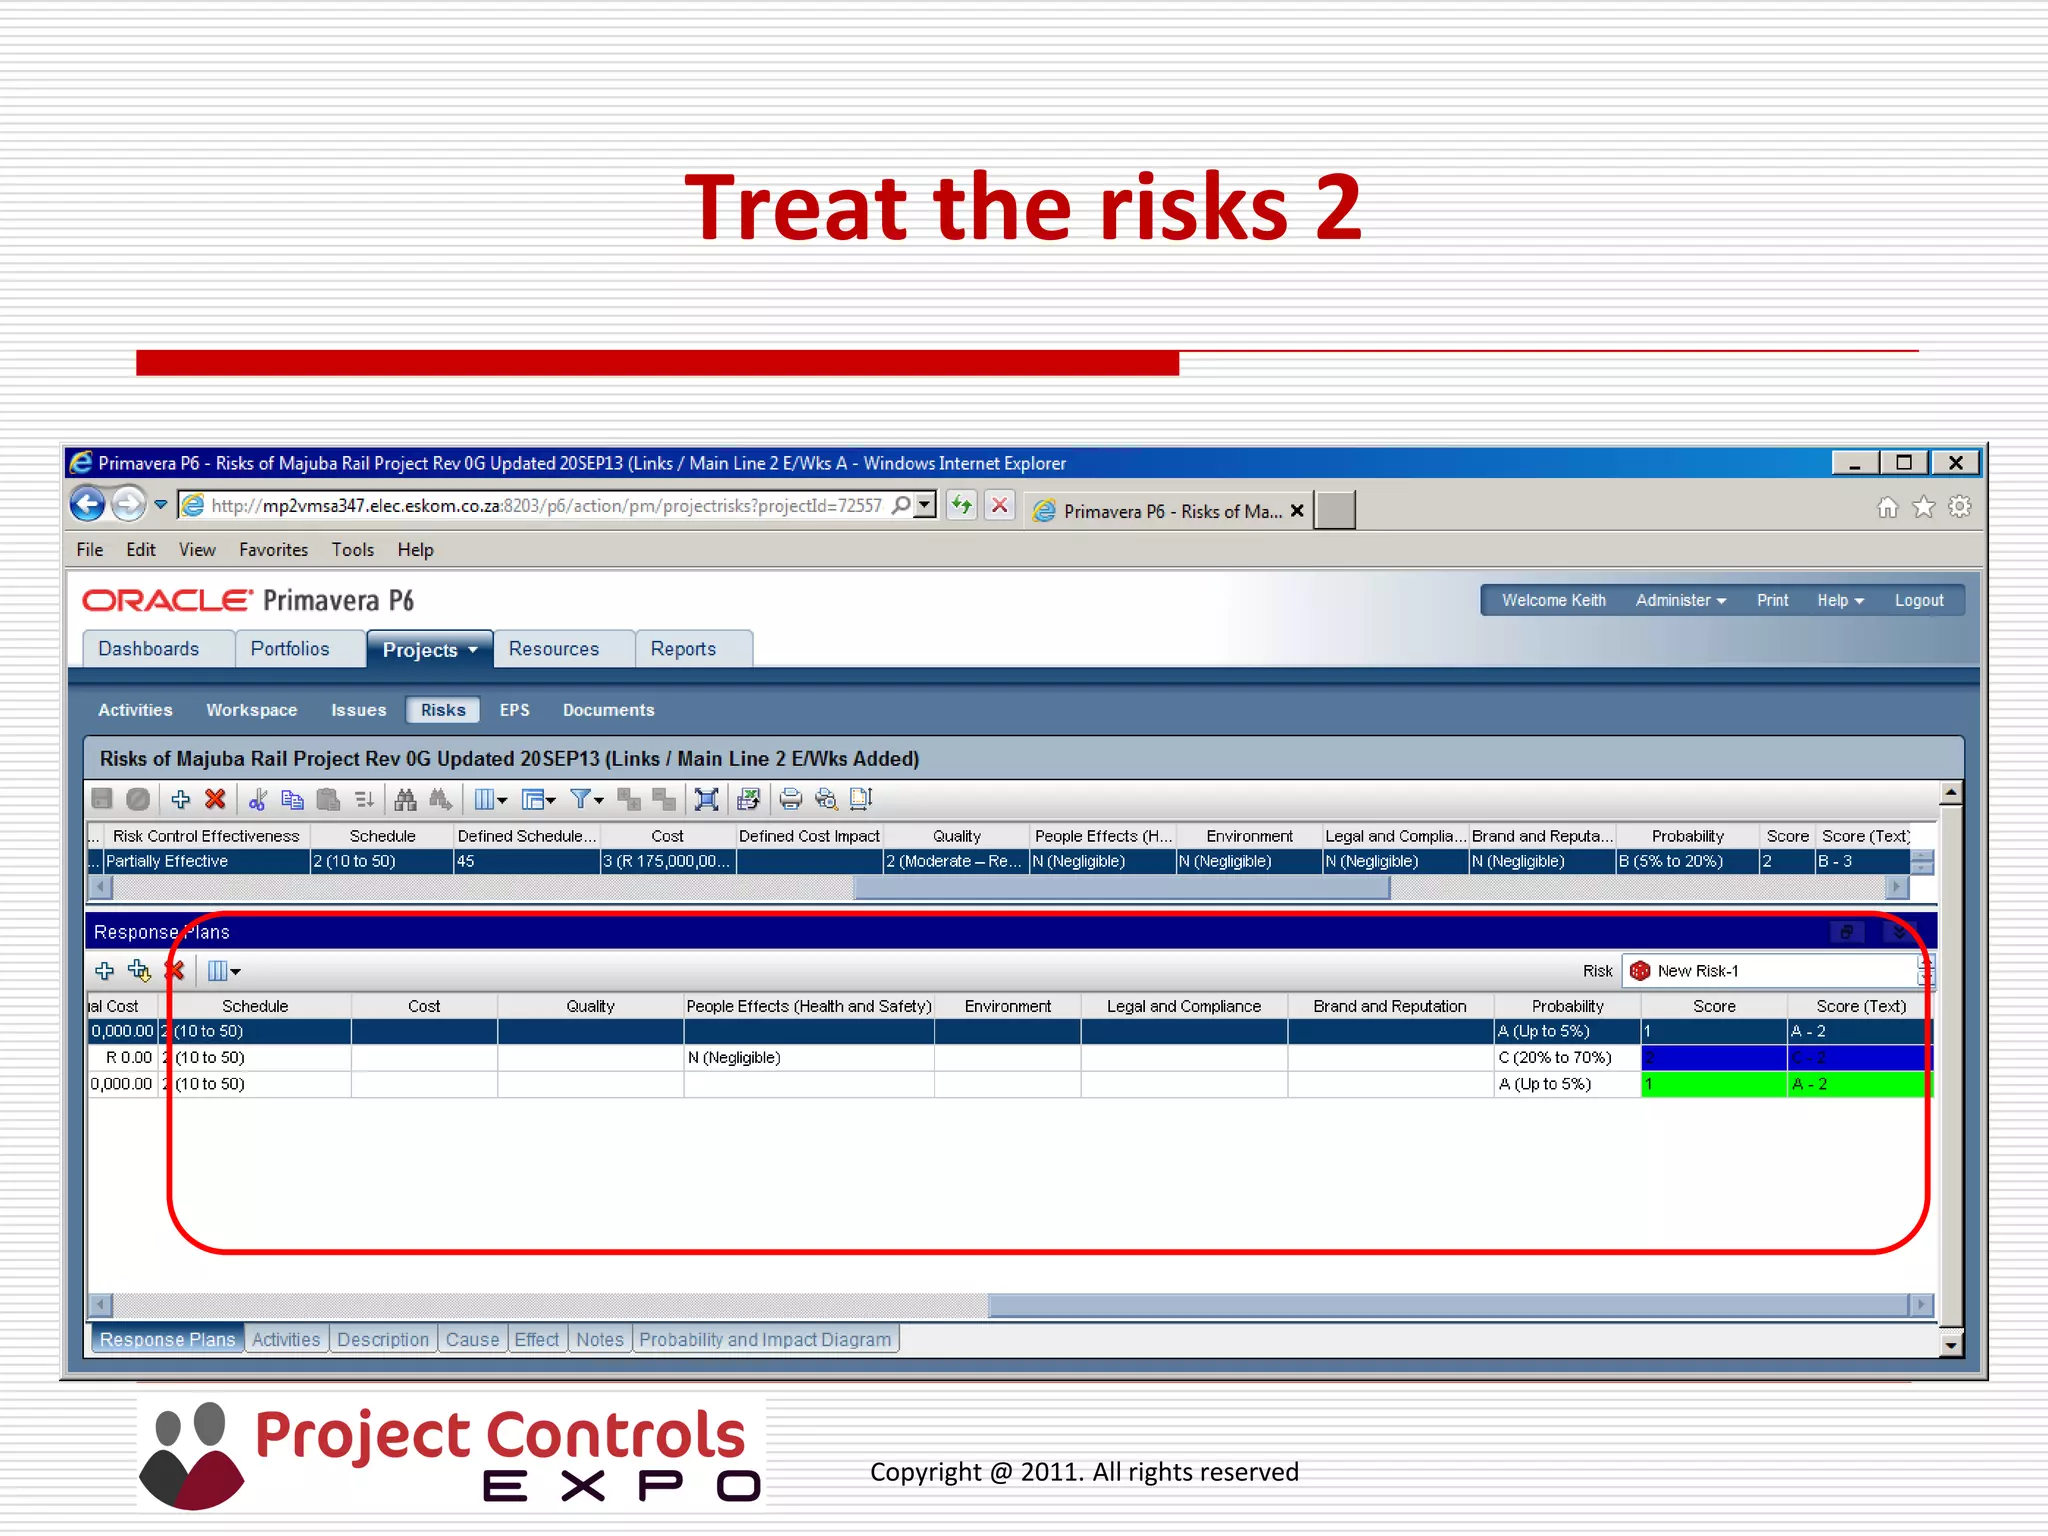
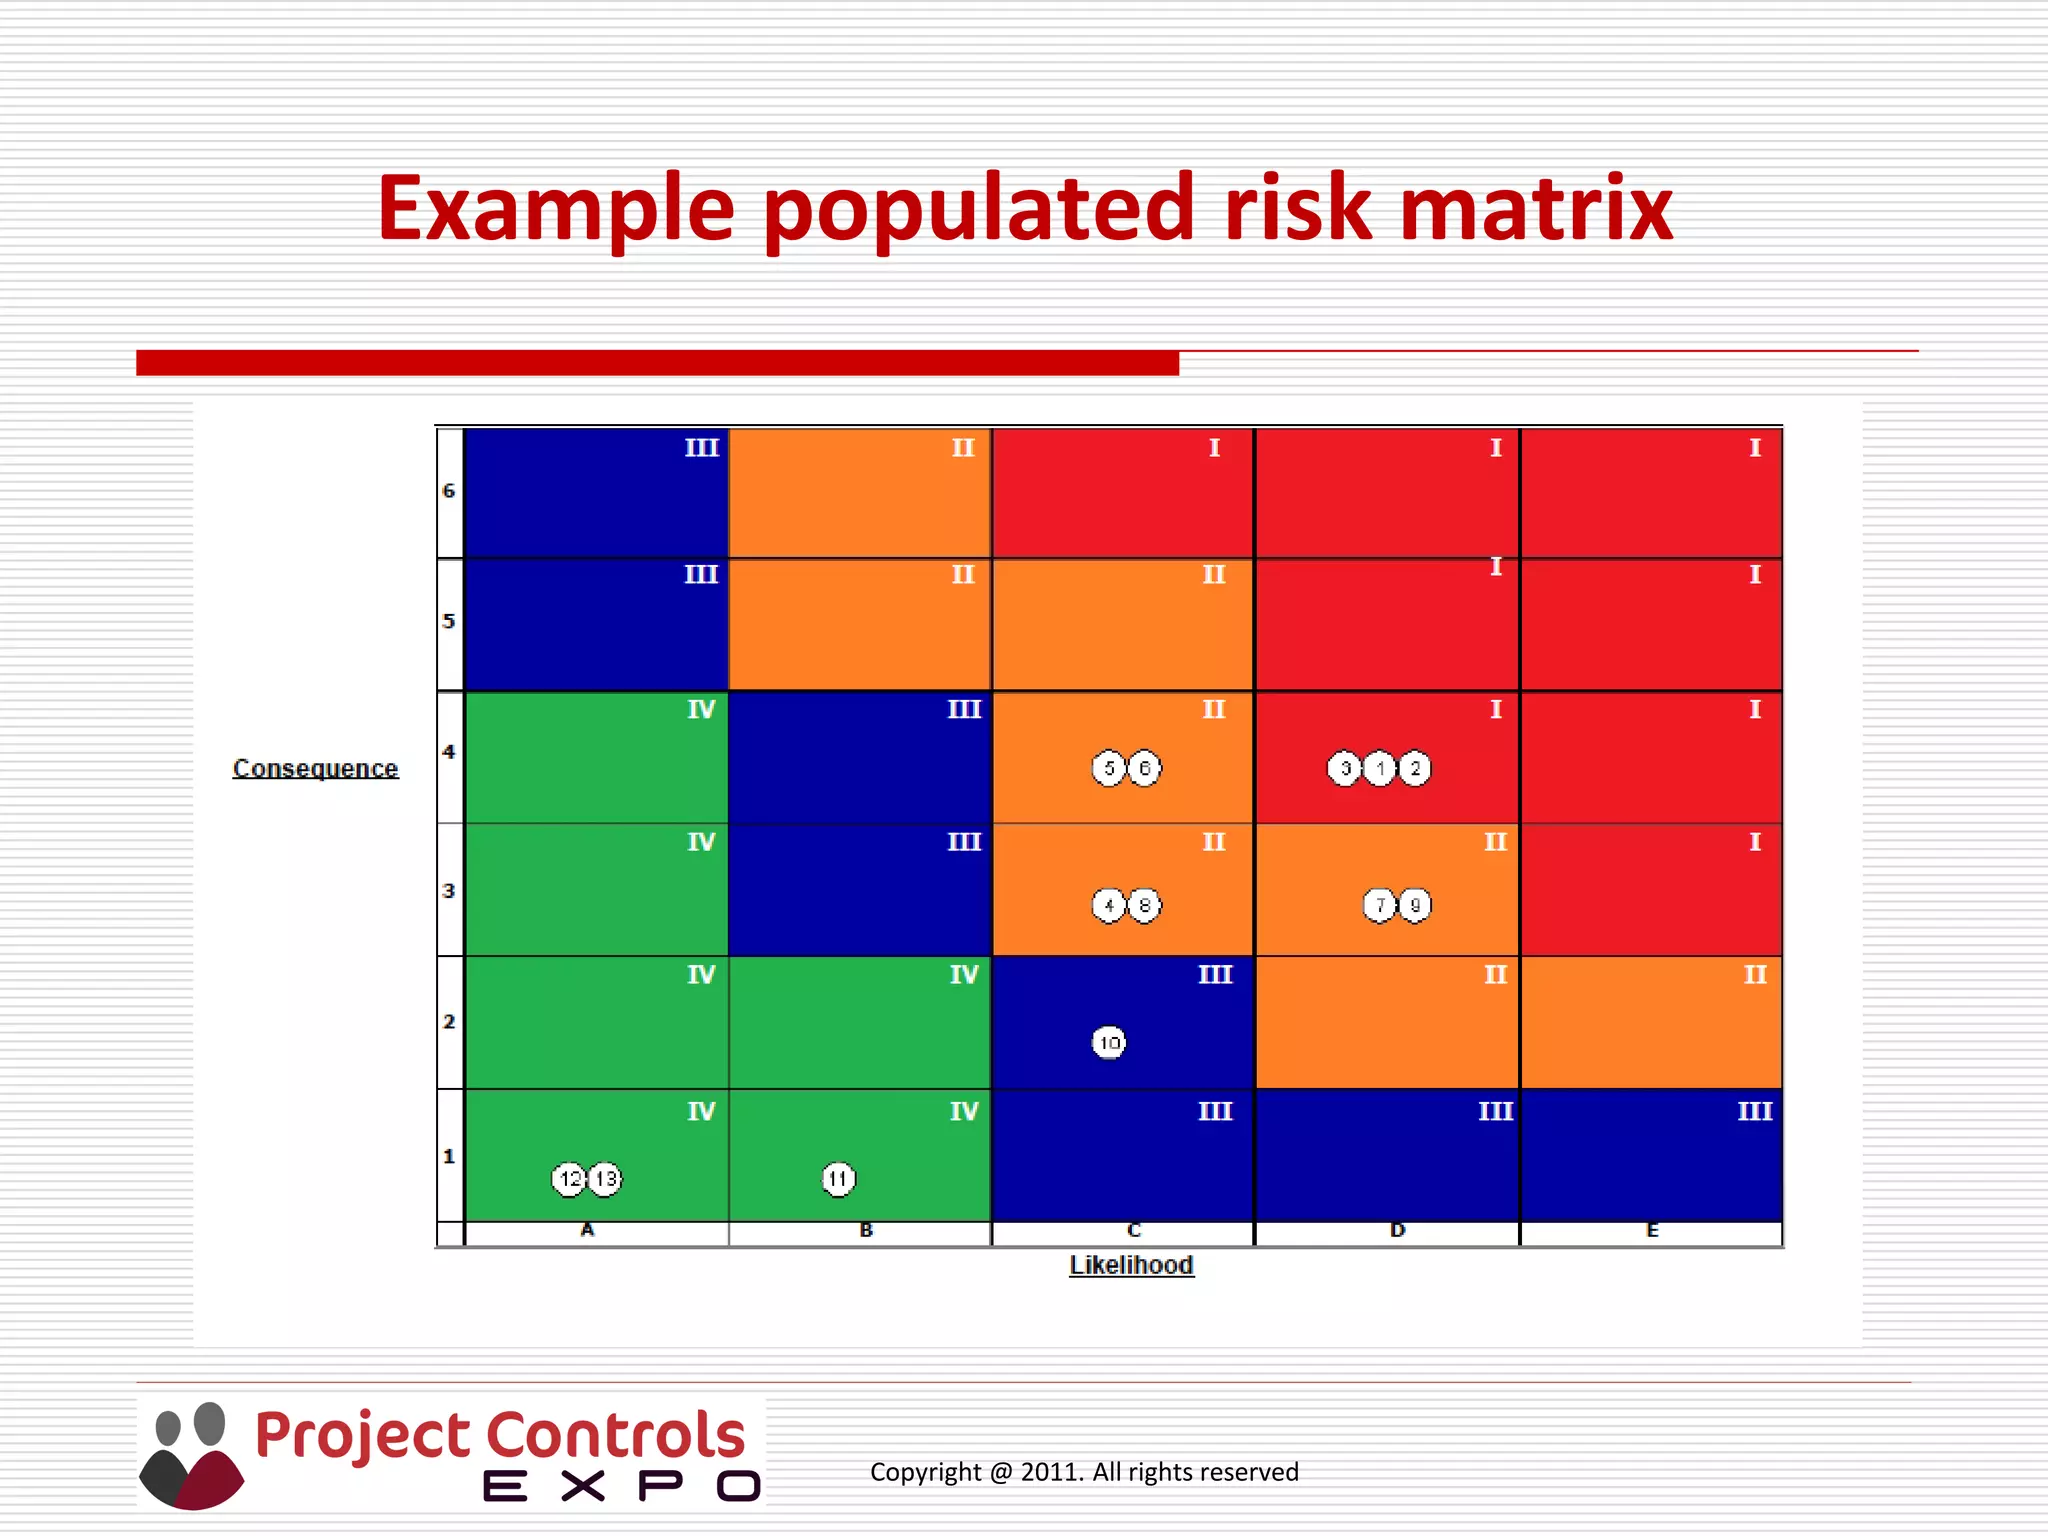
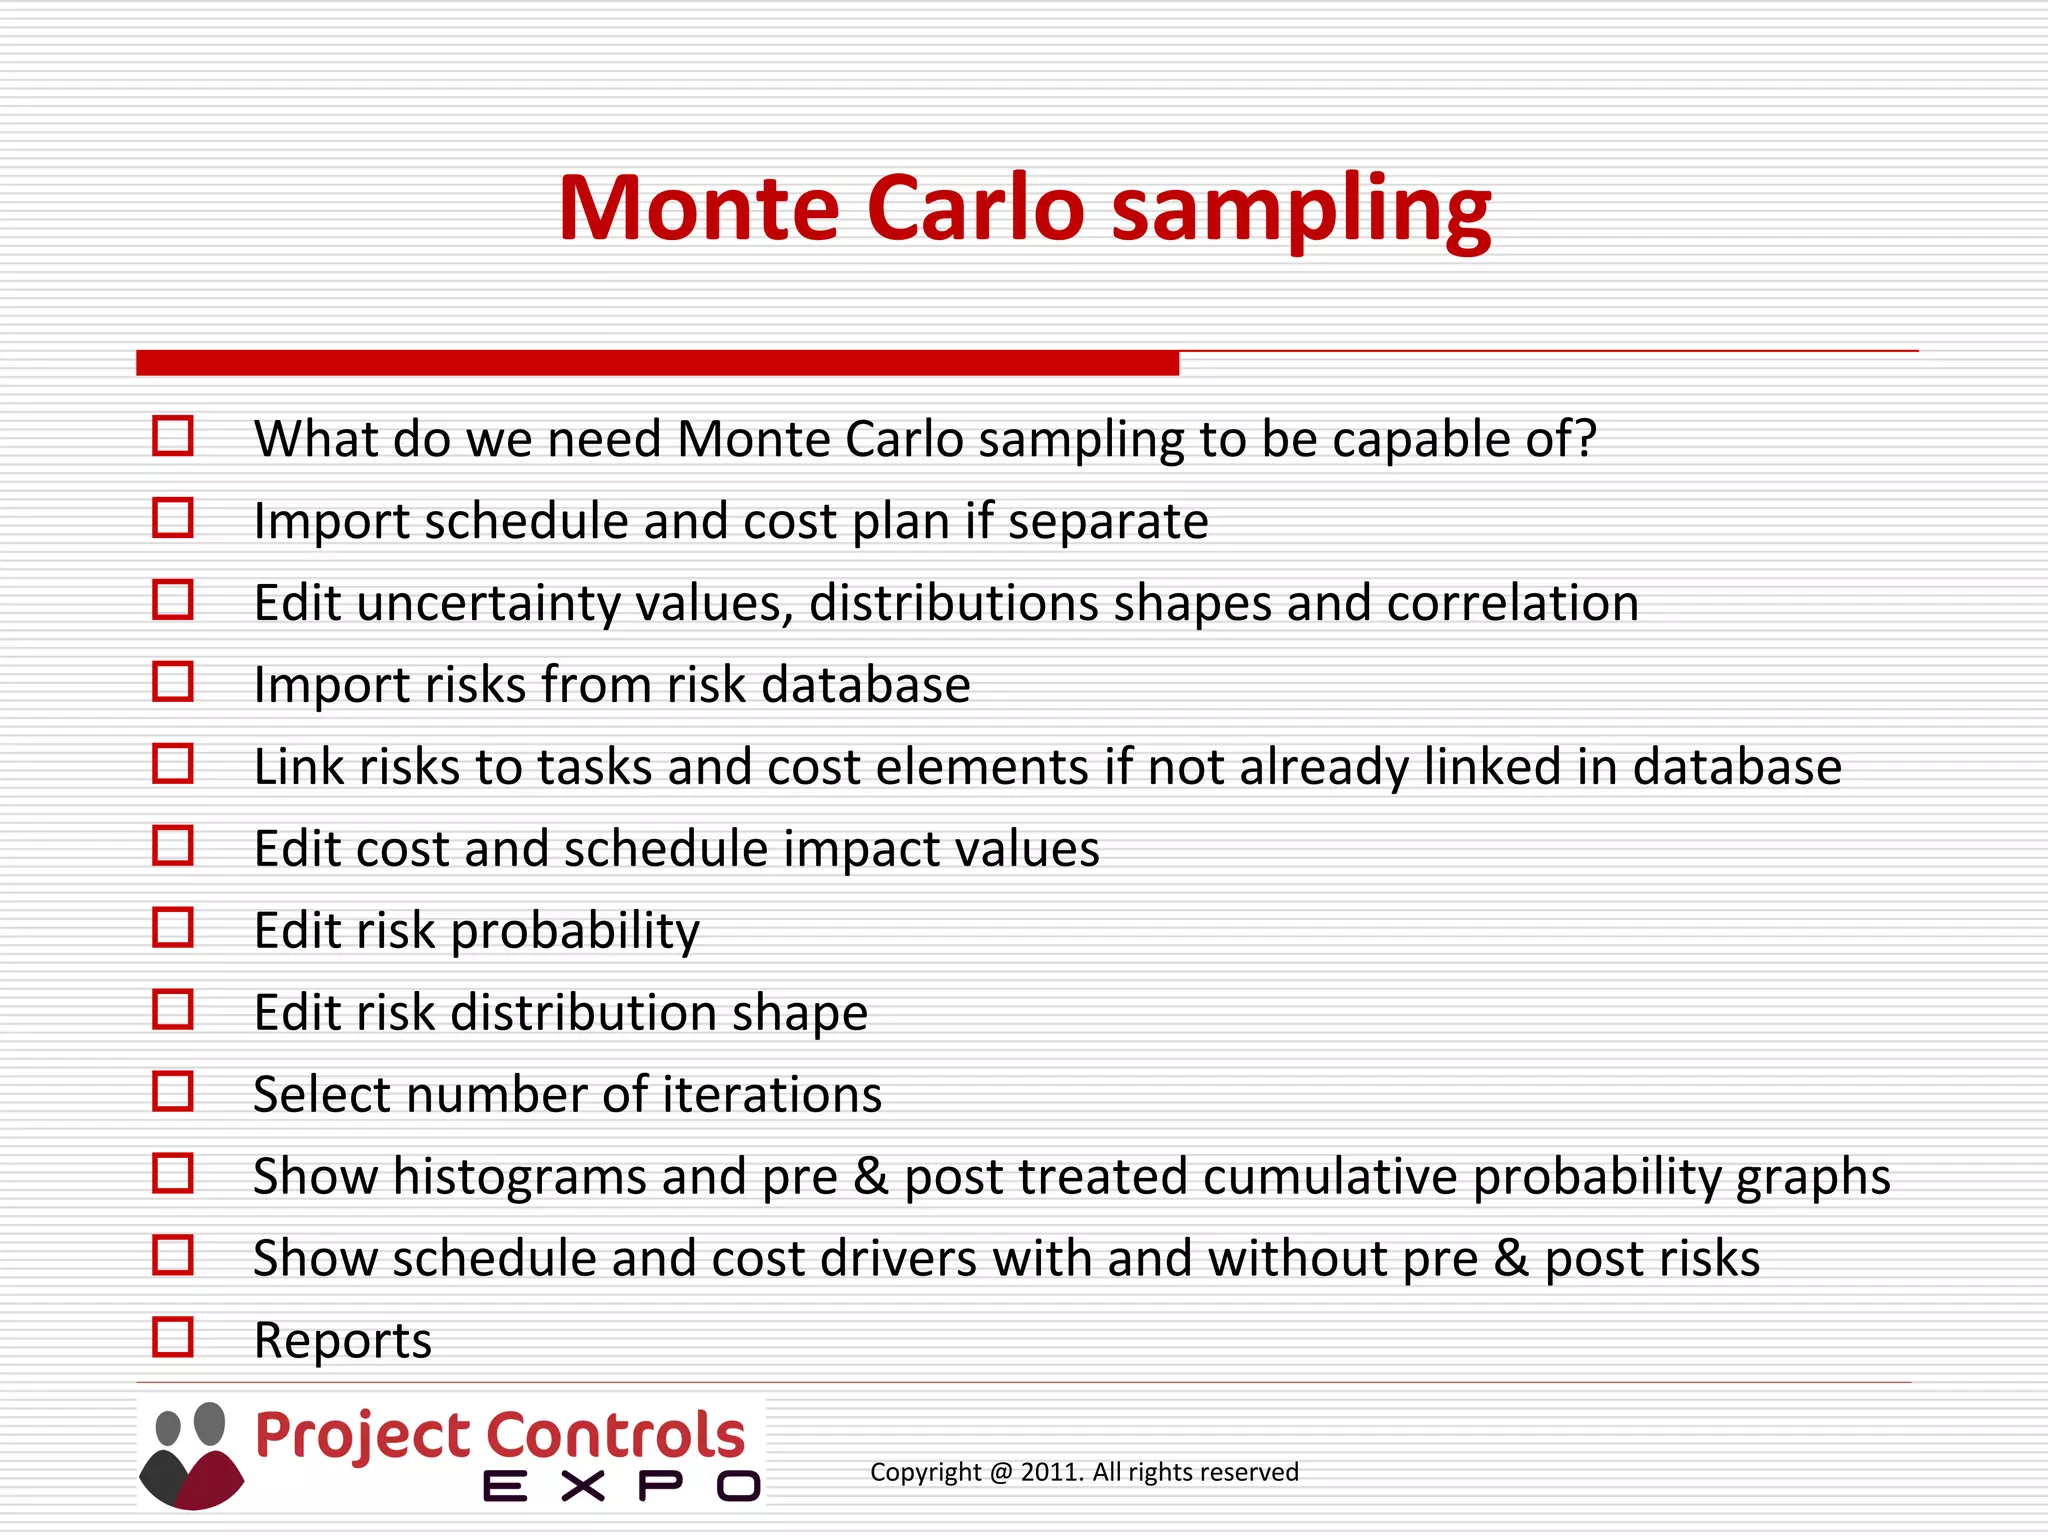
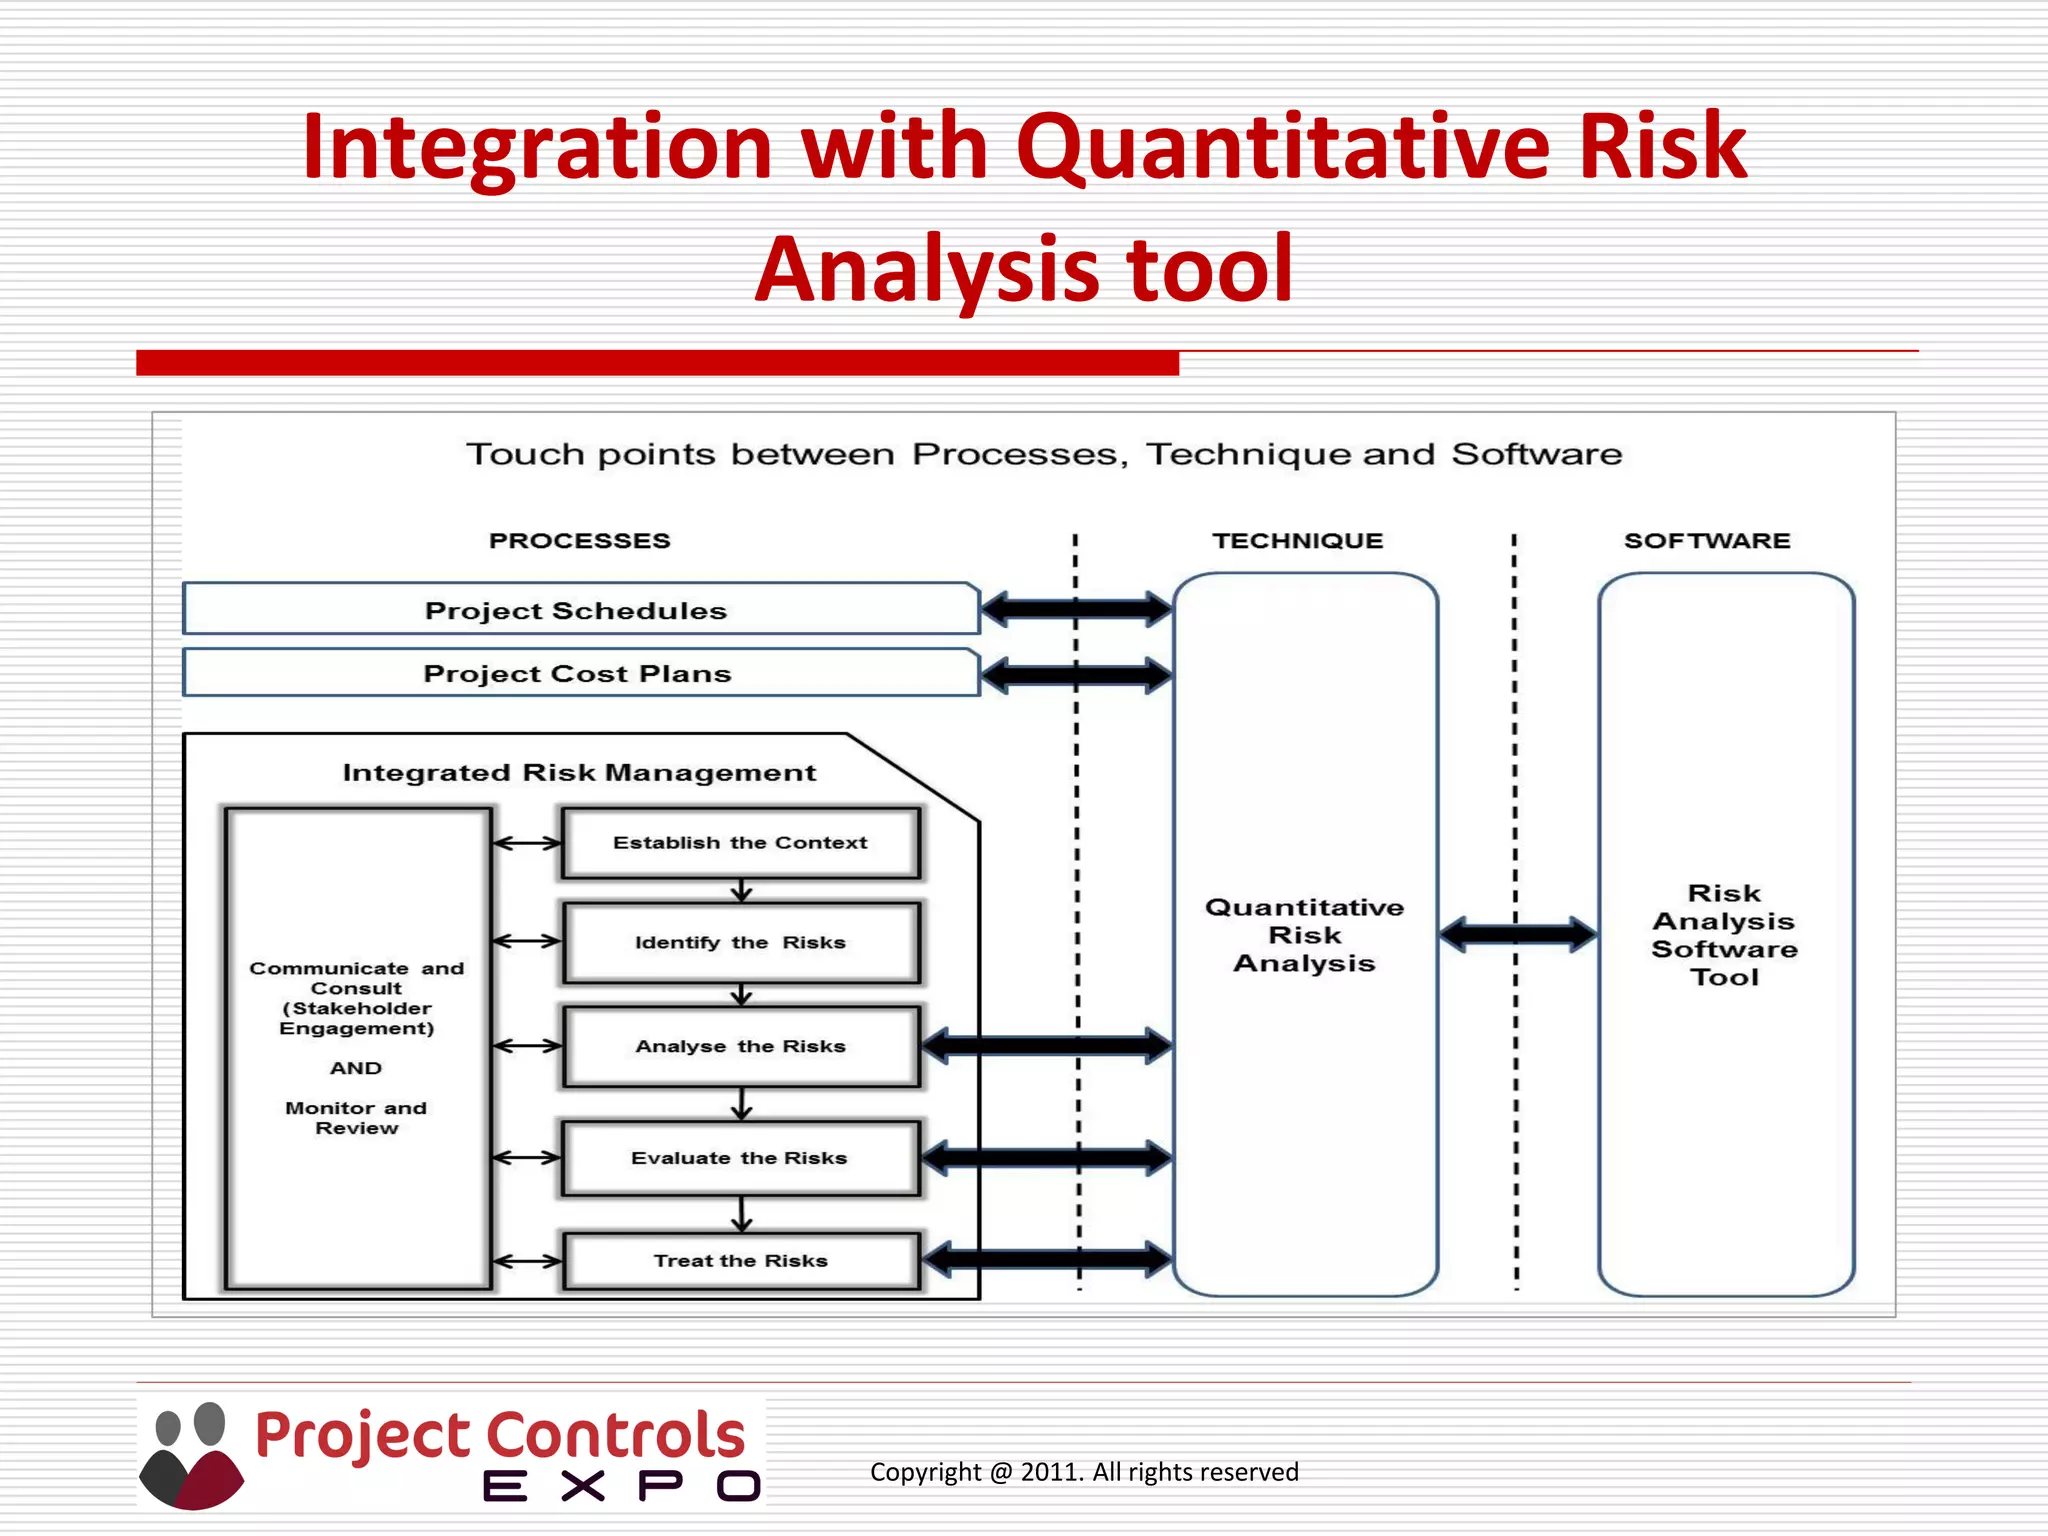

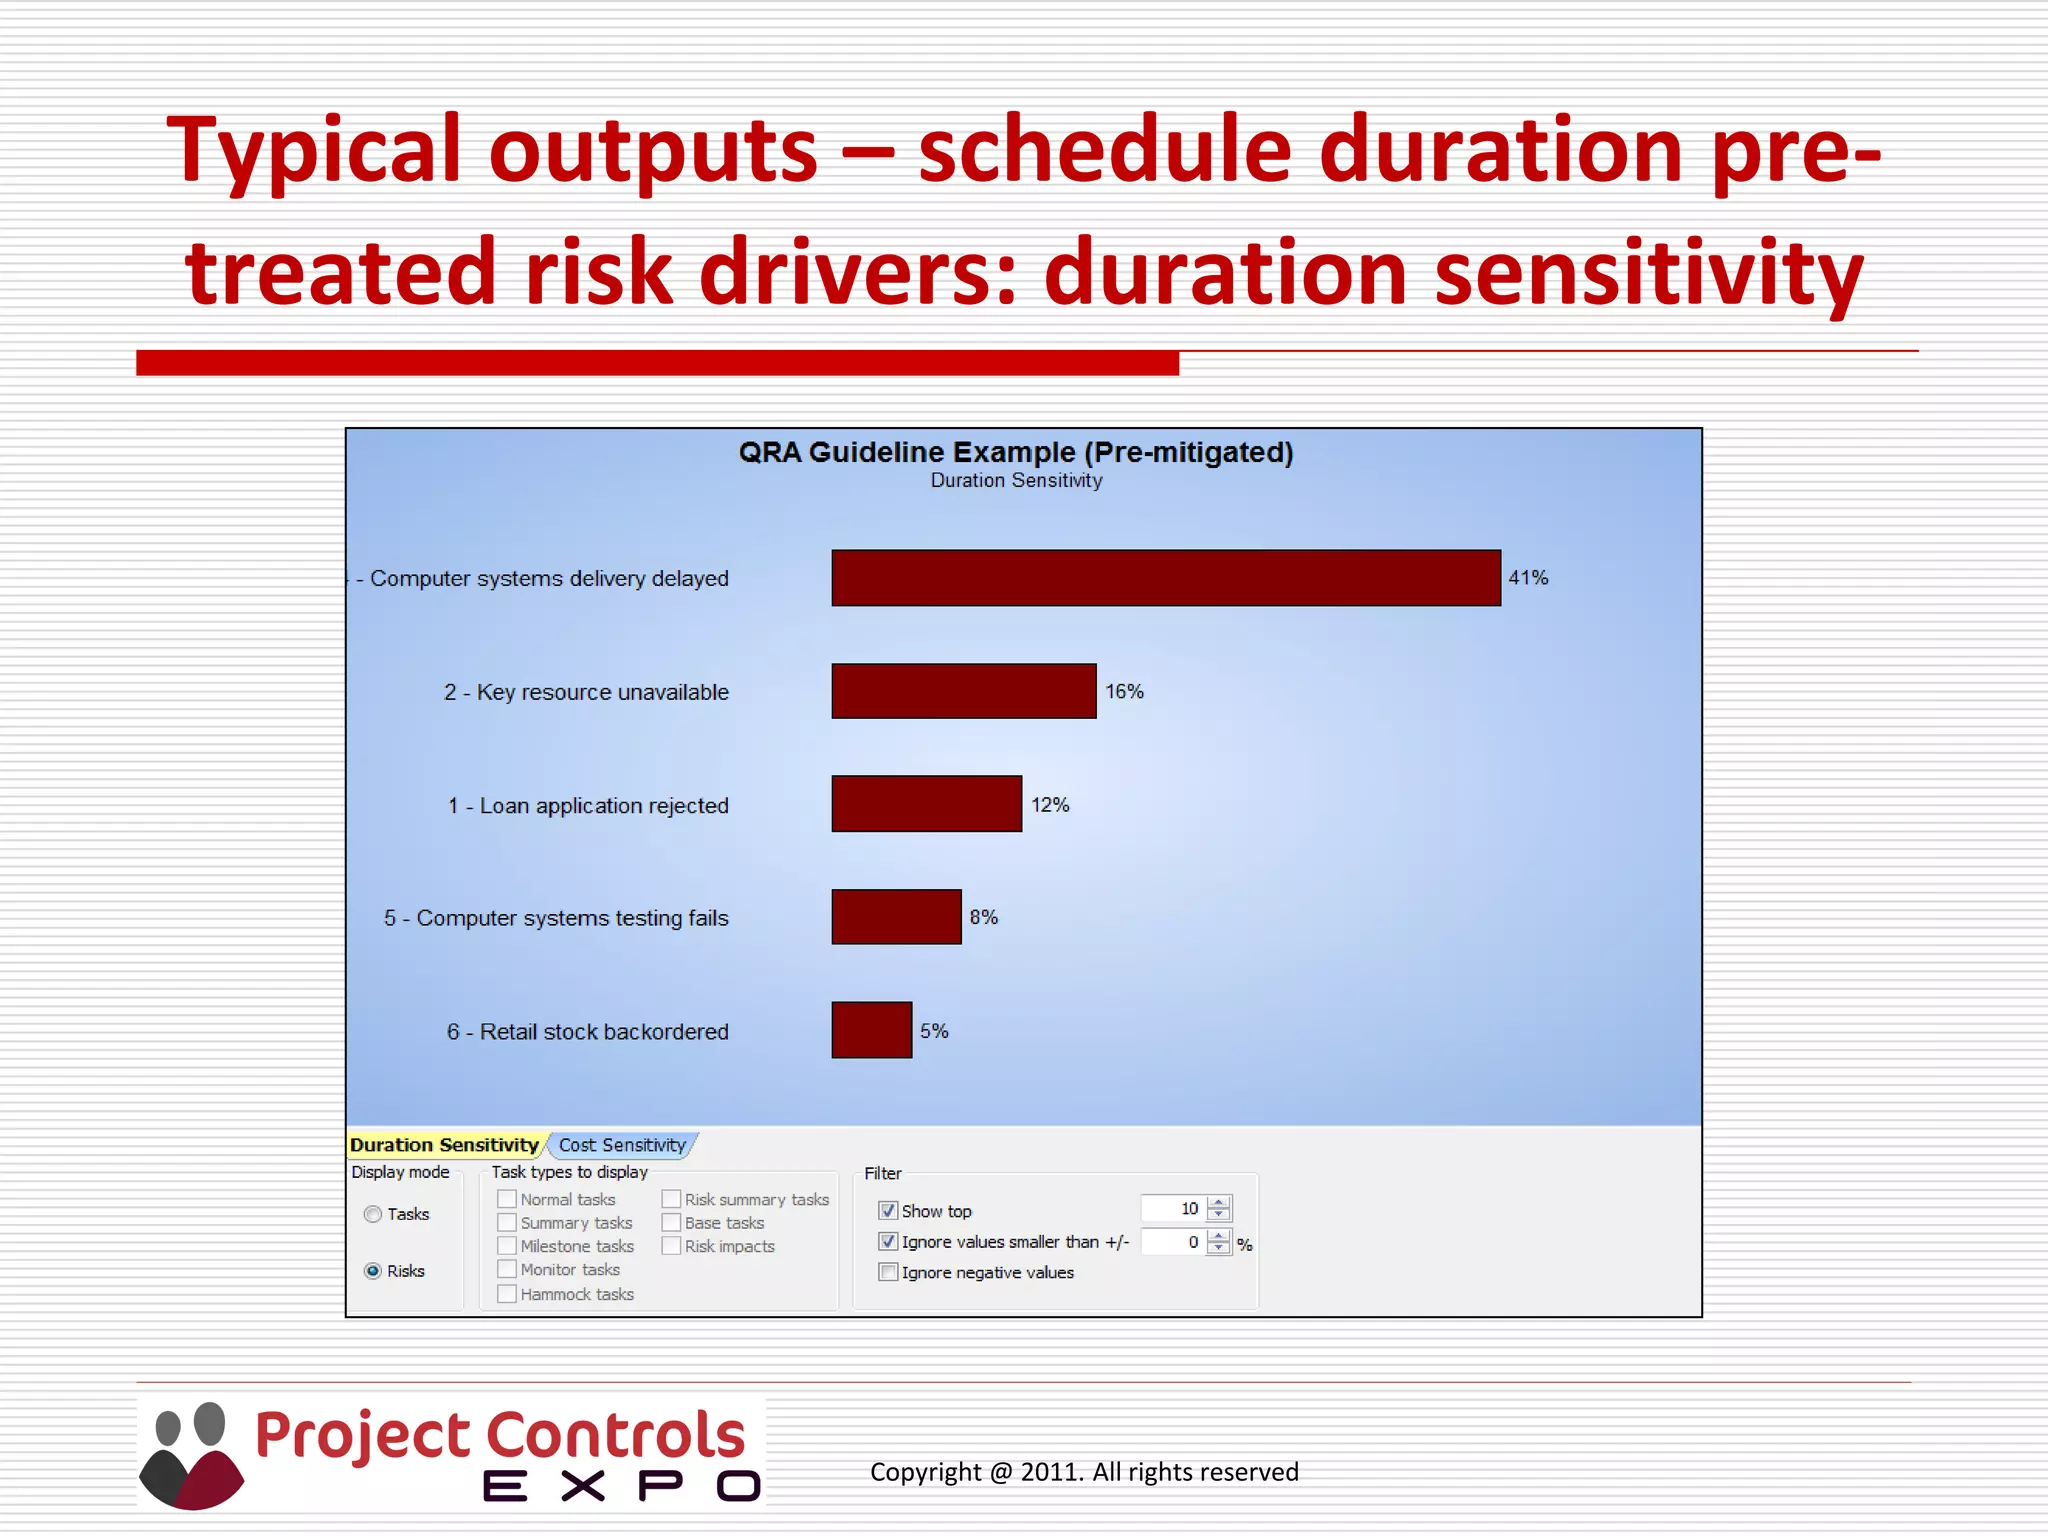
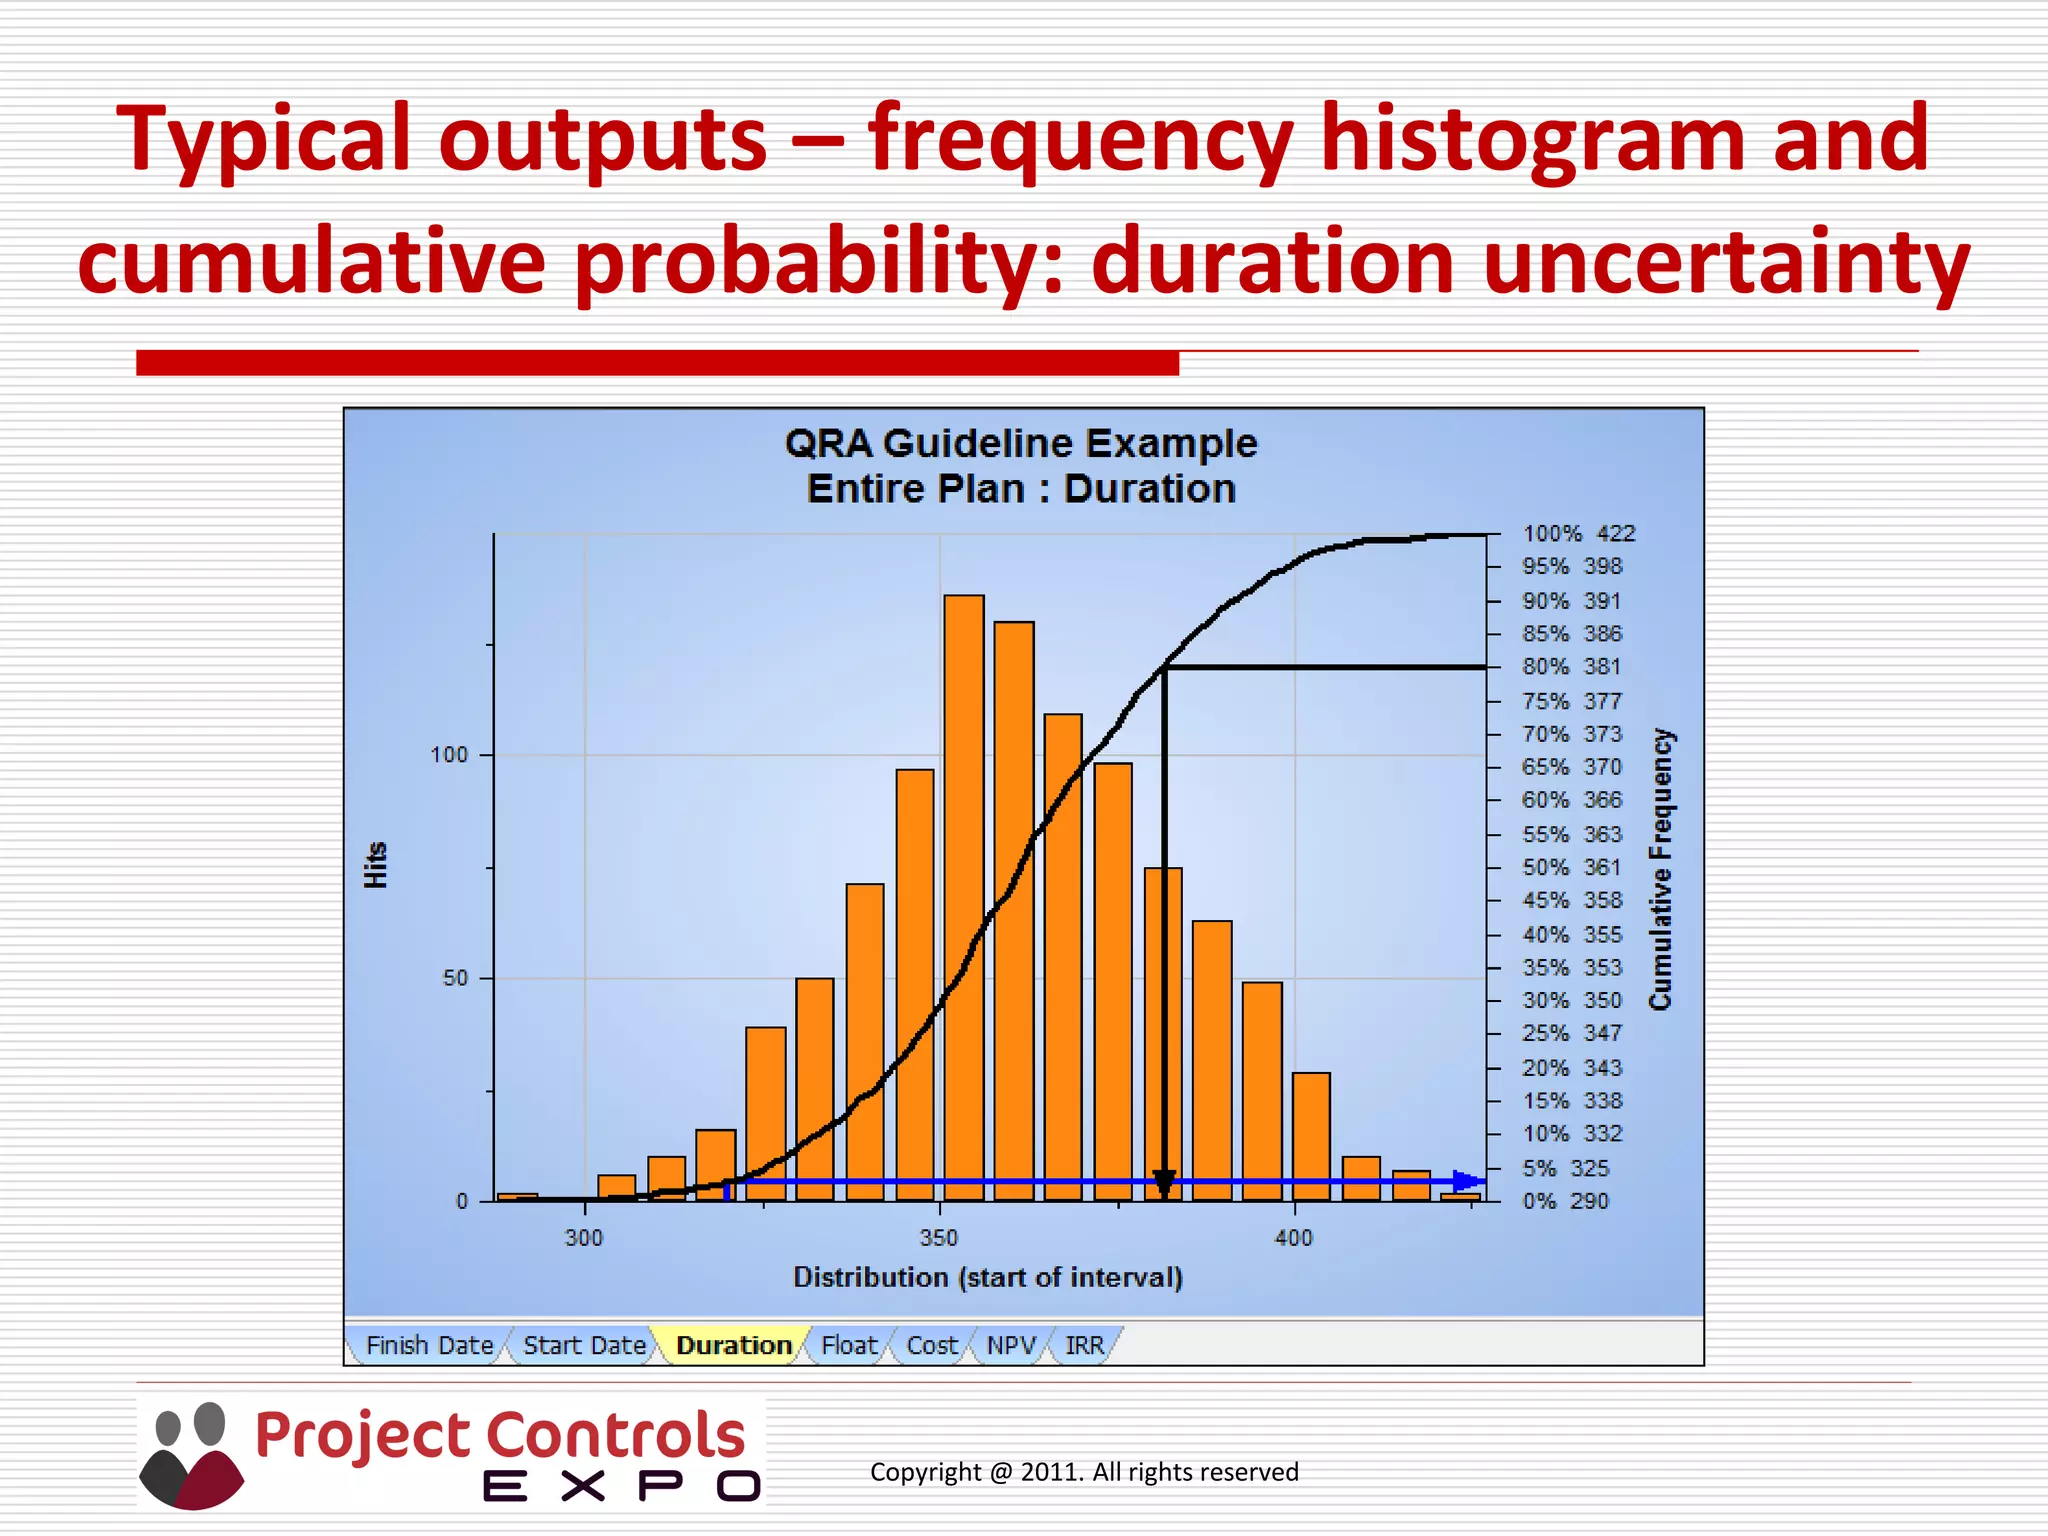

This document provides an overview of project cost and schedule risk analysis. It discusses key terms like risk, uncertainty, and probability. It outlines the ISO 31000 risk management process, including steps like risk identification, analysis, evaluation, and treatment. Monte Carlo simulation is presented as a technique for modeling project schedule and cost uncertainty based on risk. The document emphasizes establishing the context, identifying risks and impacts, and using a risk matrix to evaluate and prioritize risks in order to inform project planning and management.