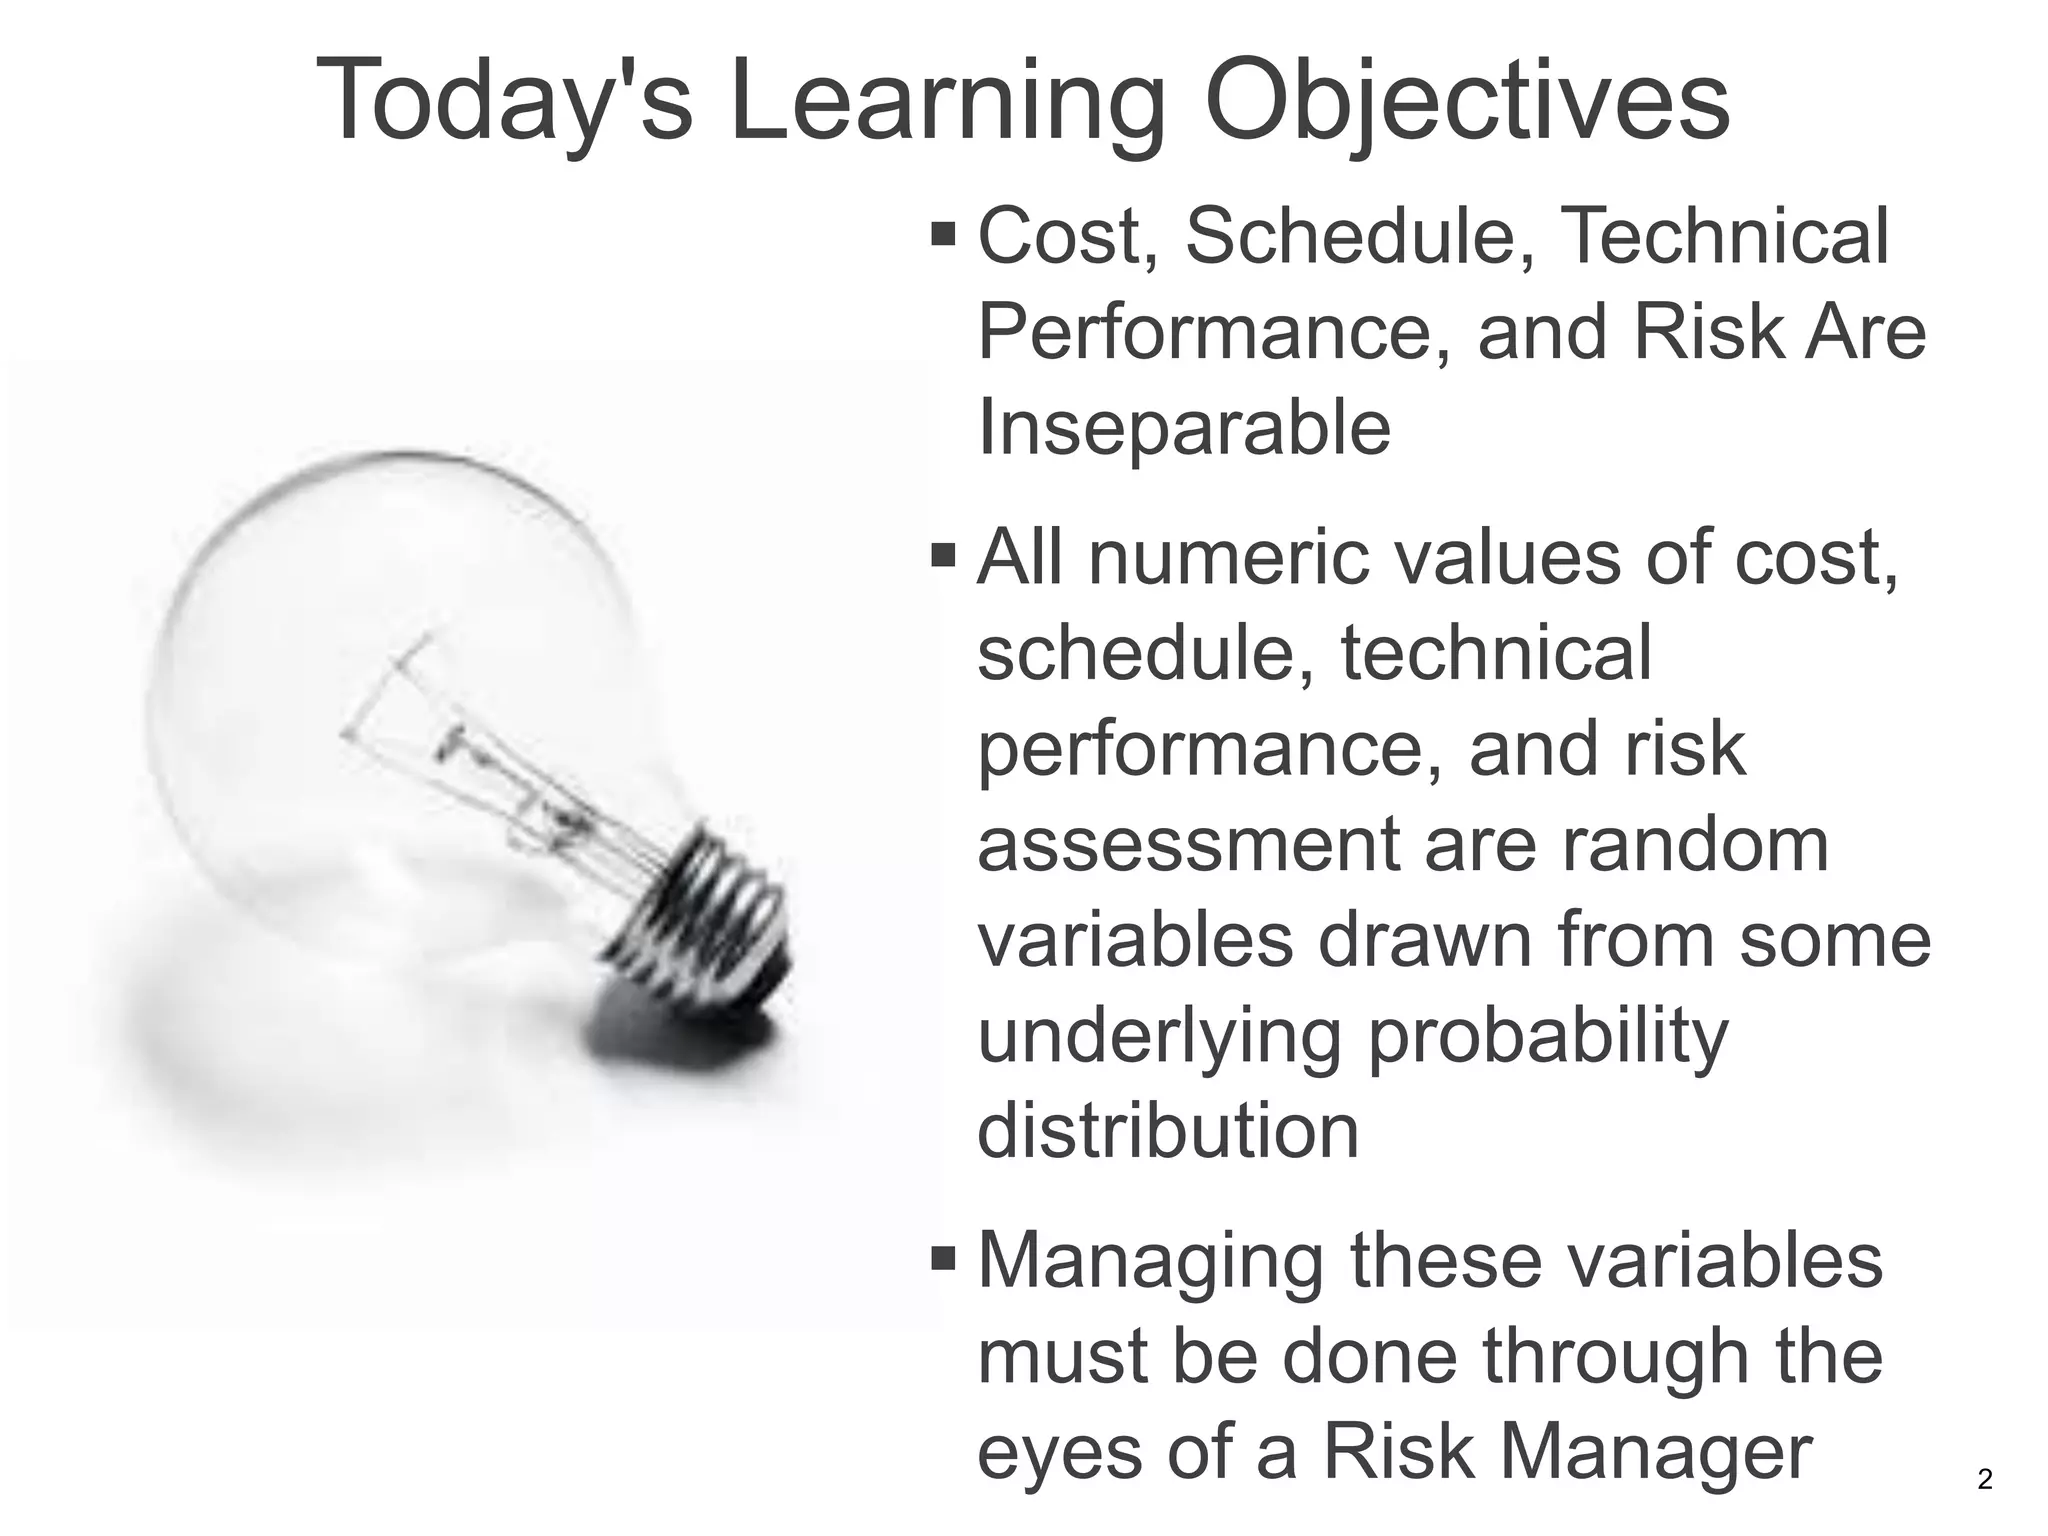
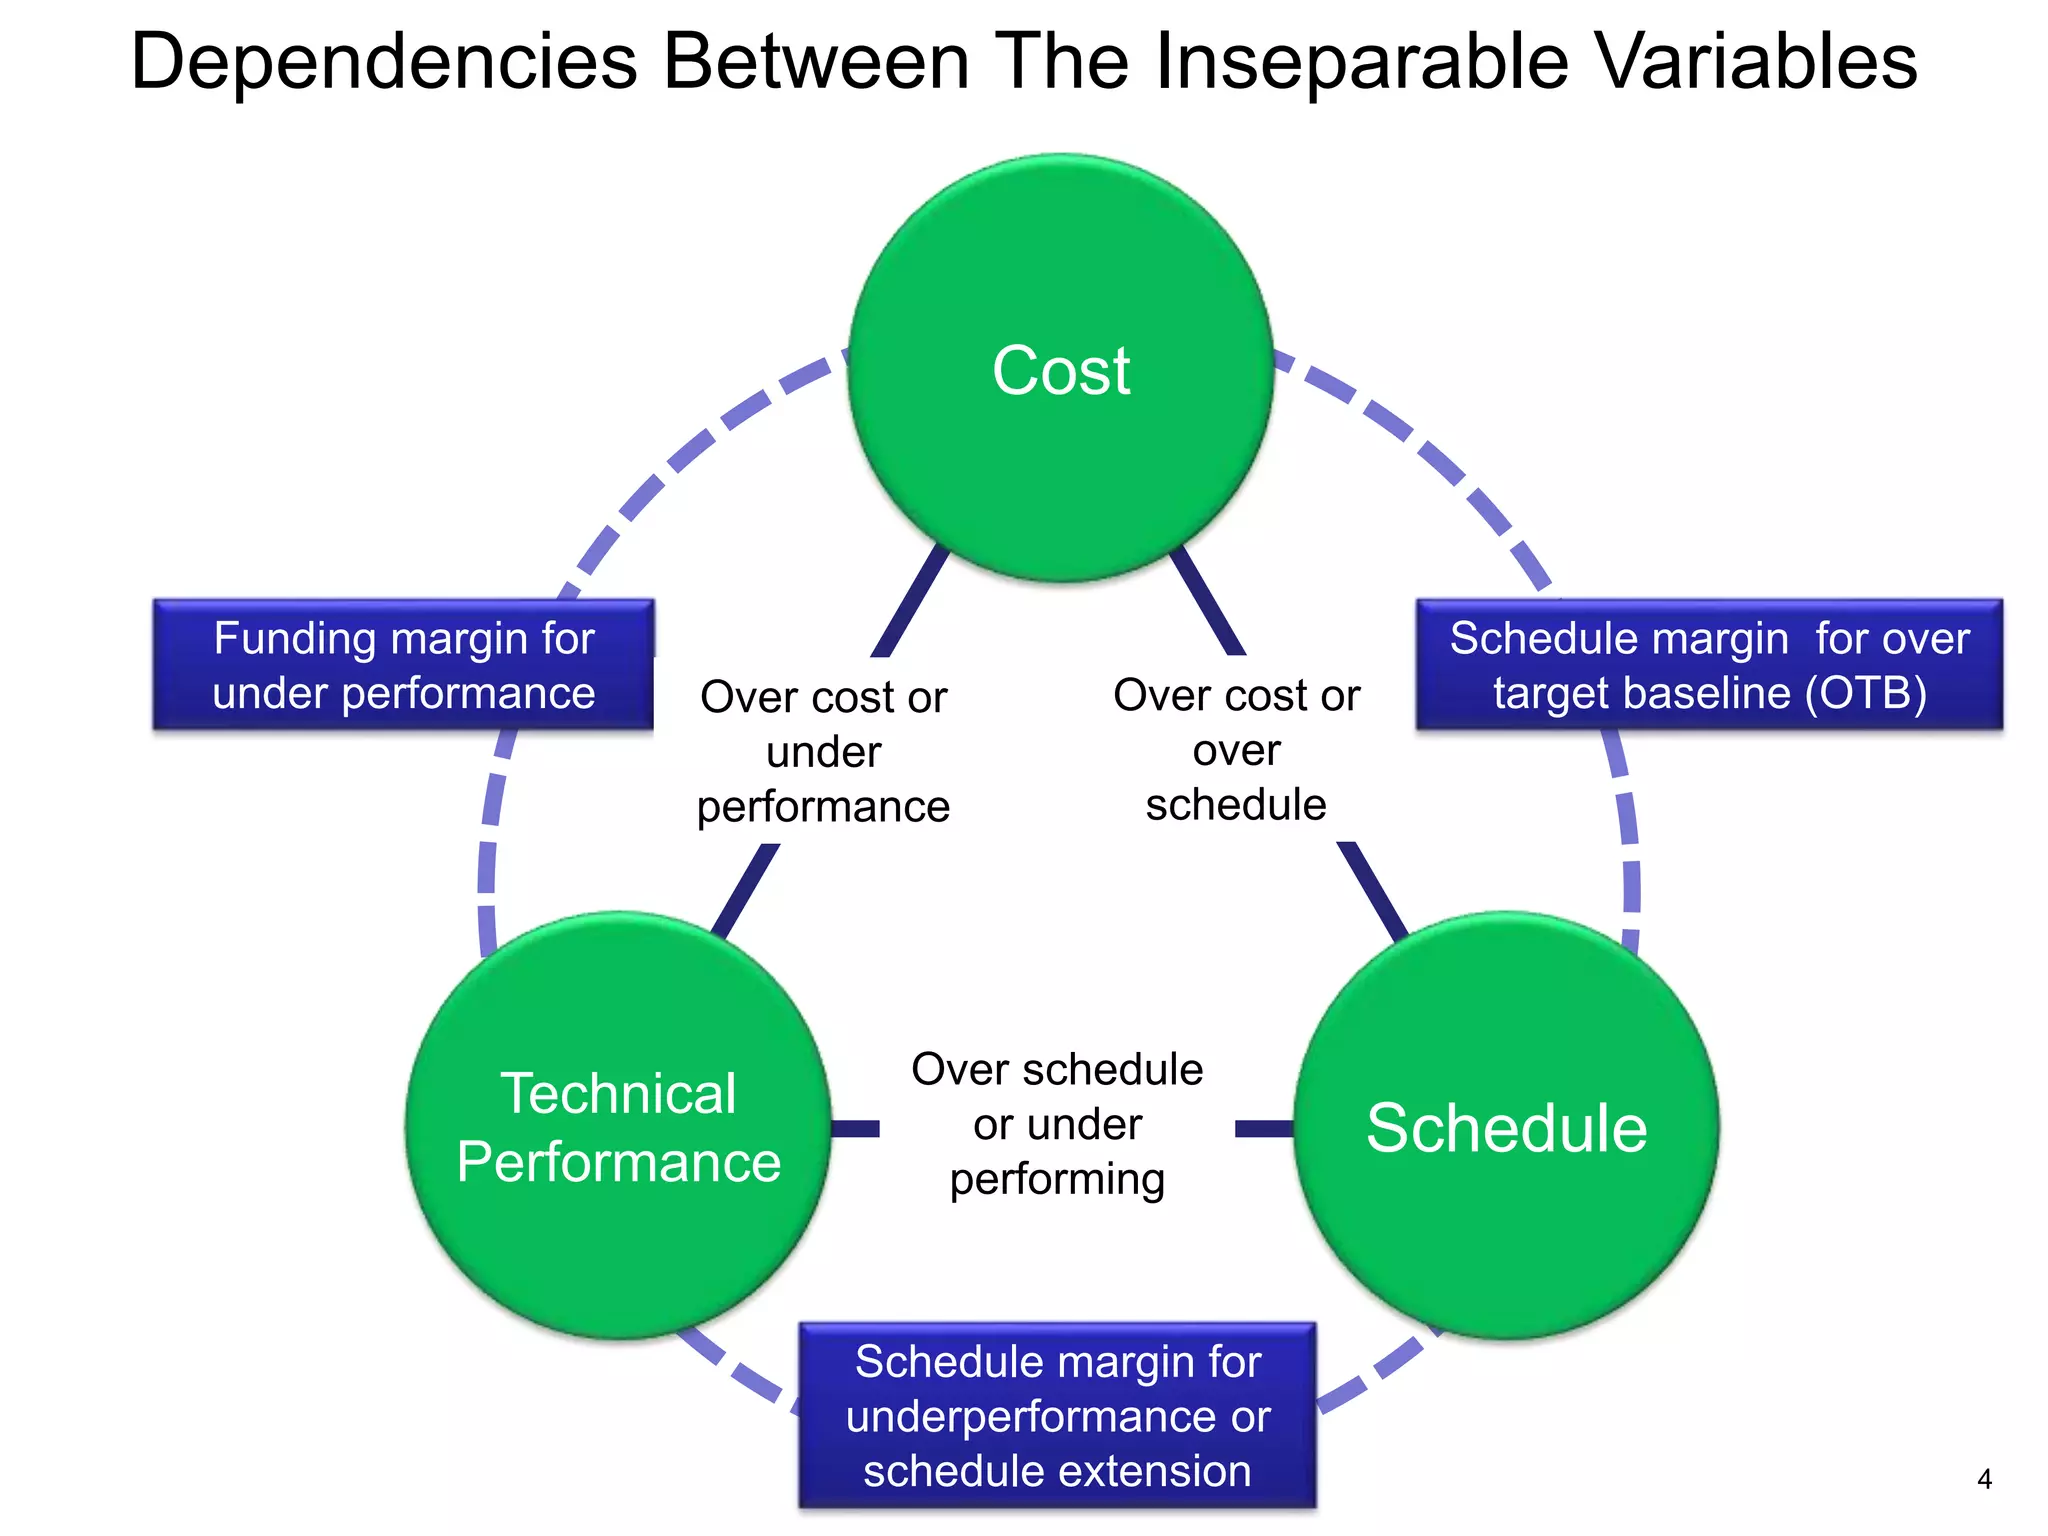
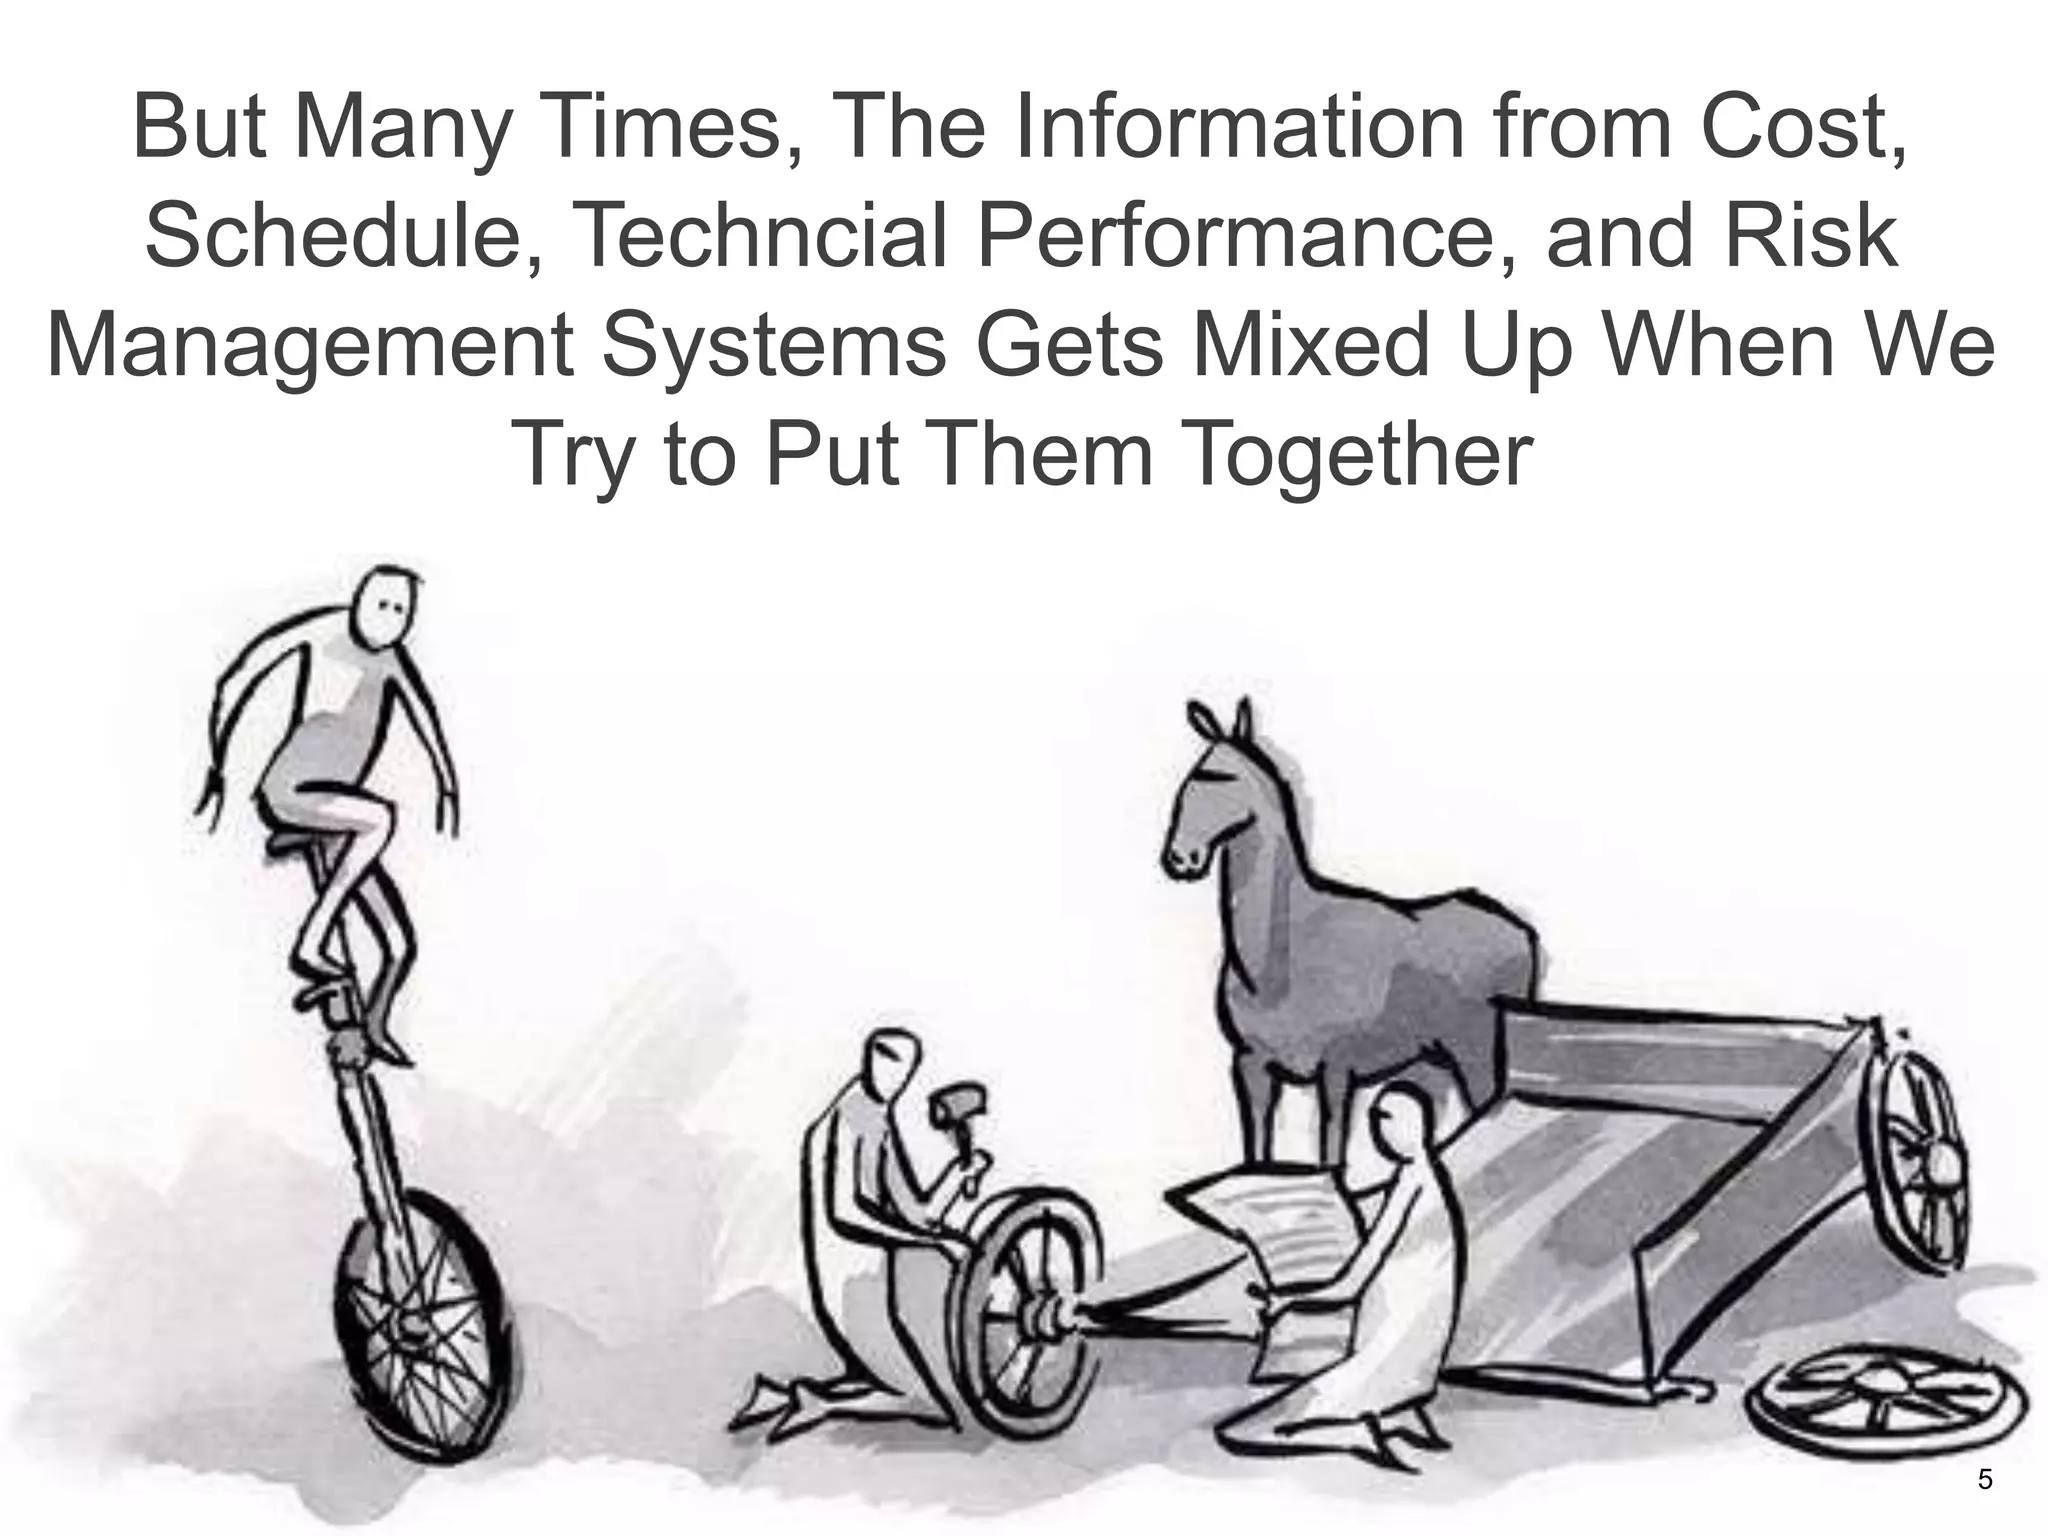
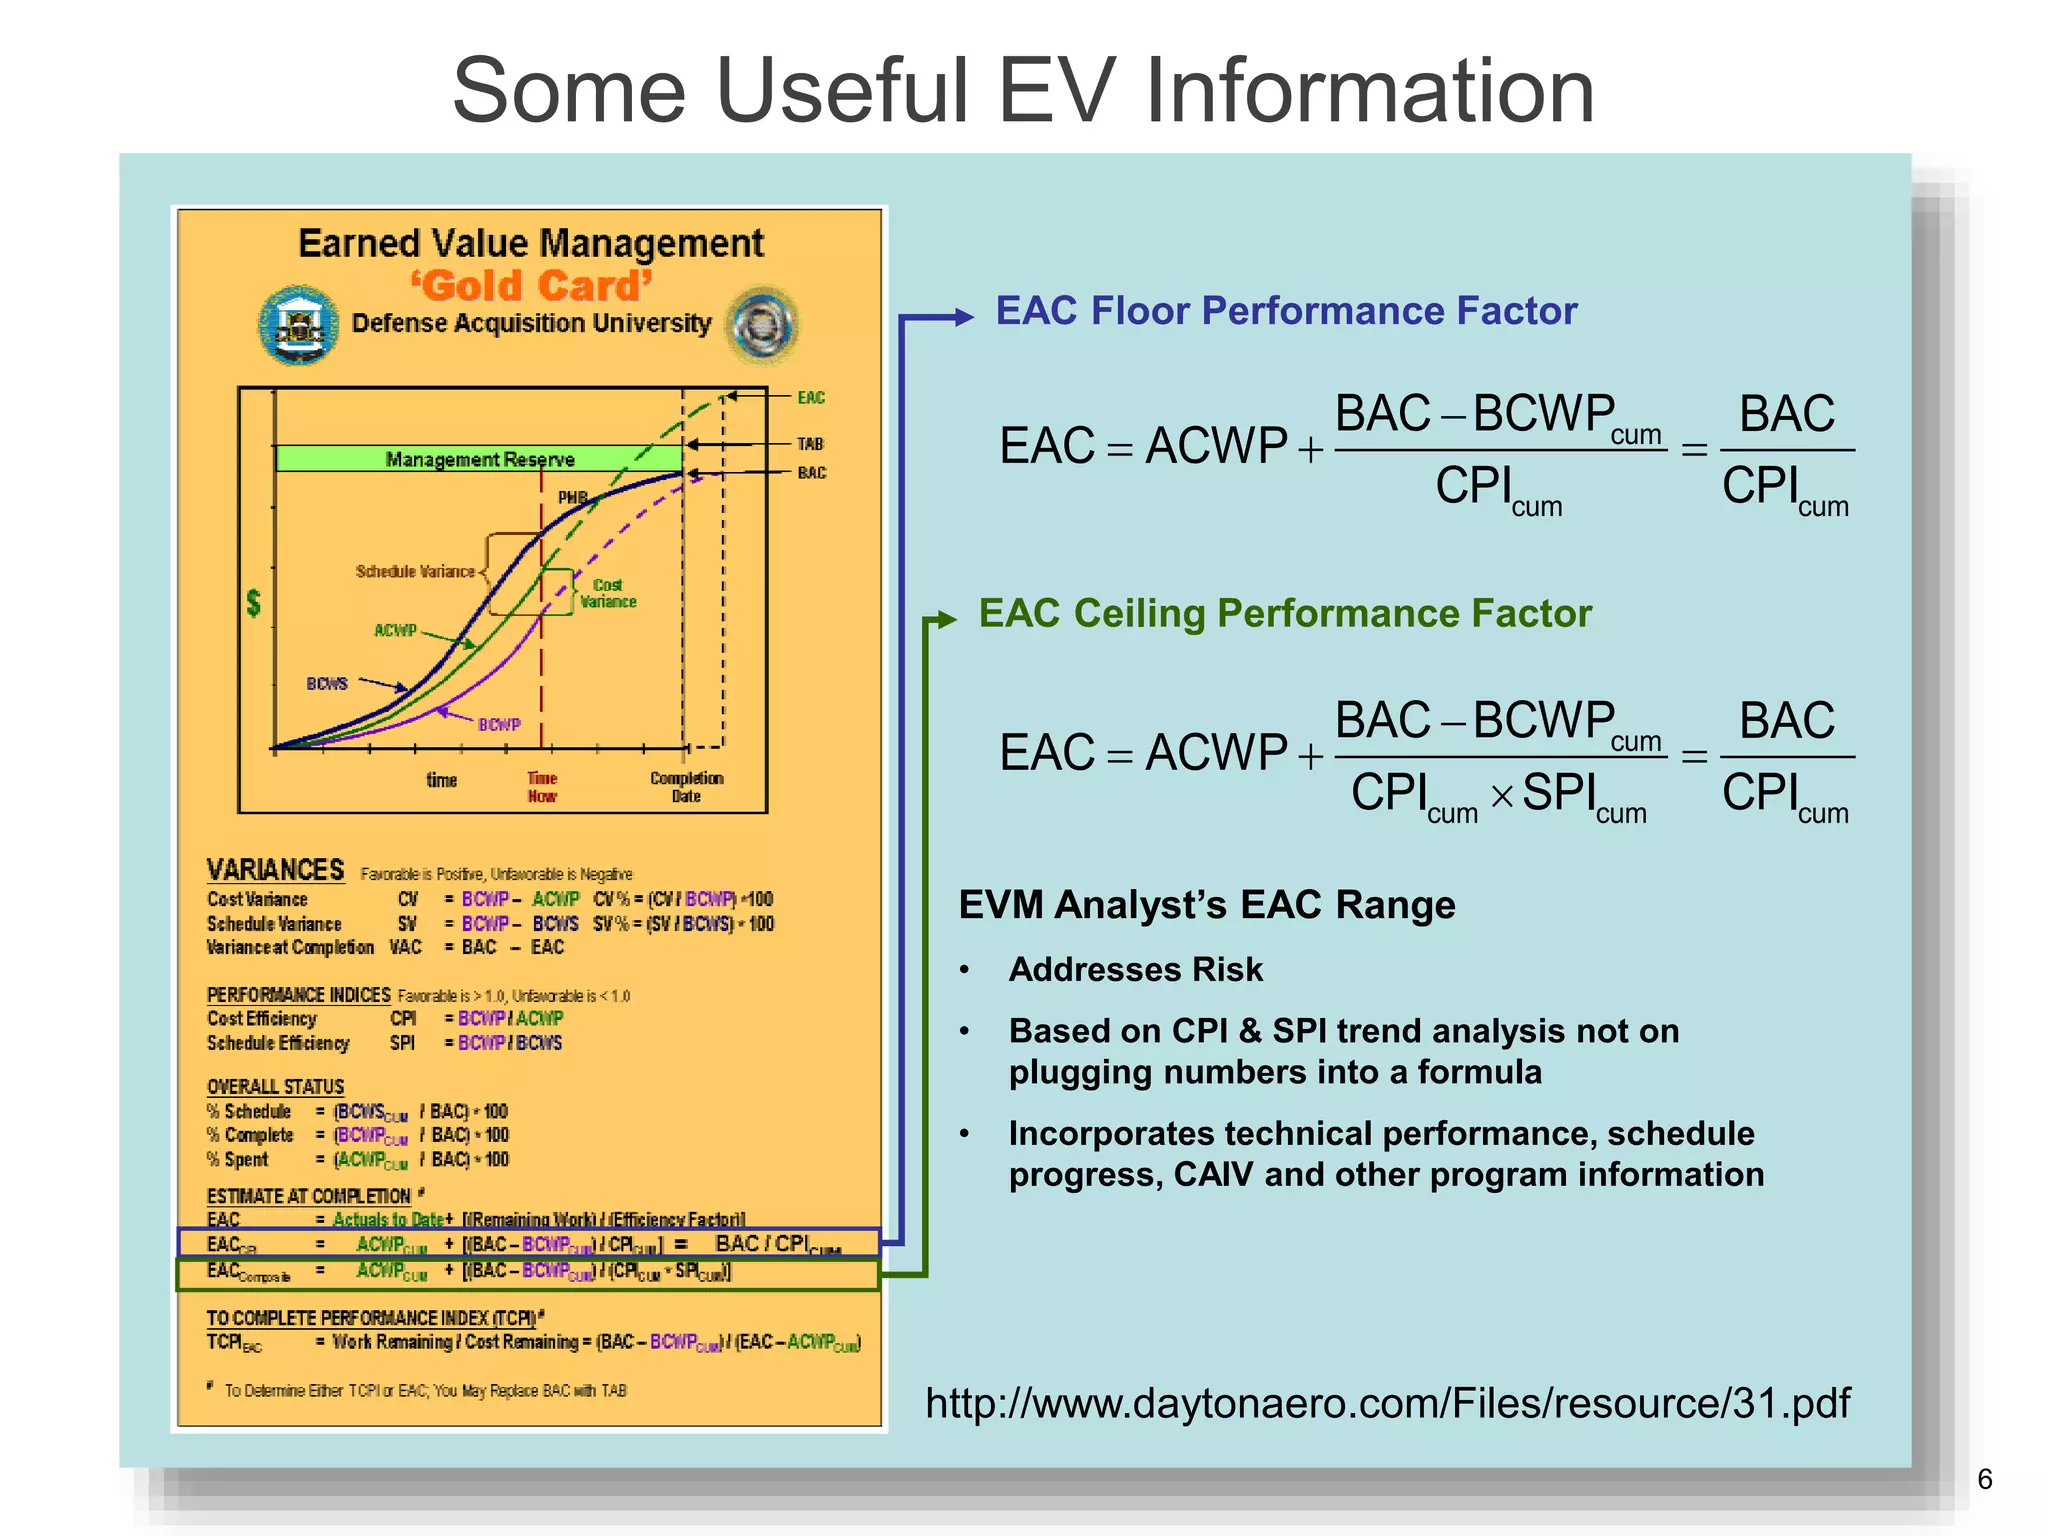
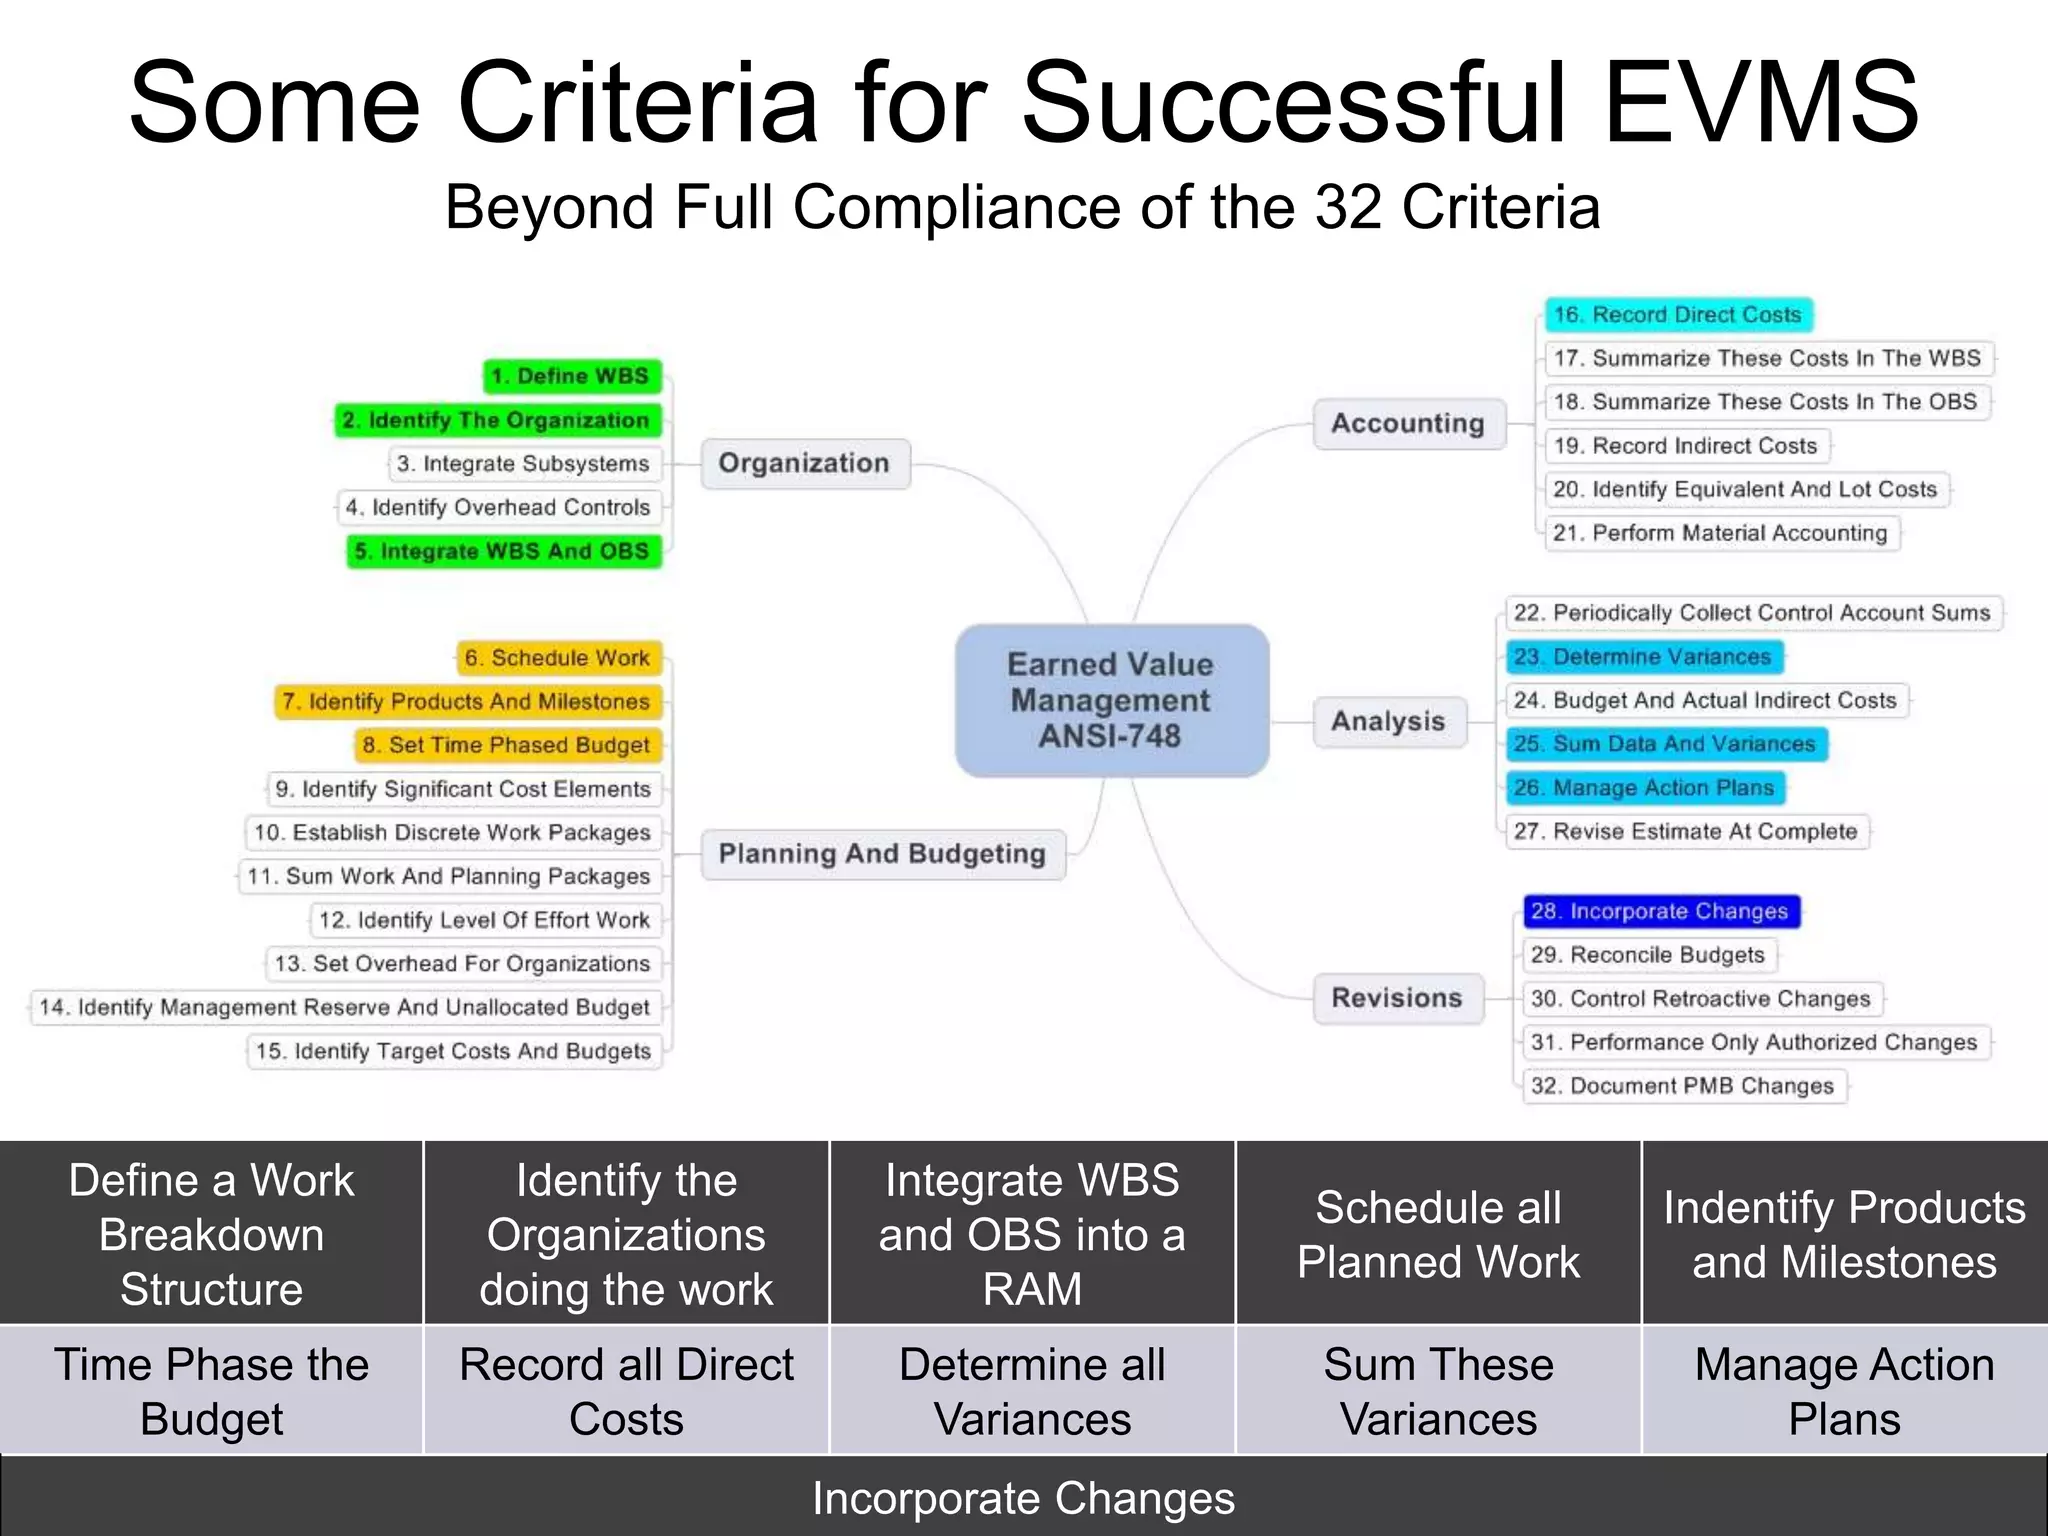
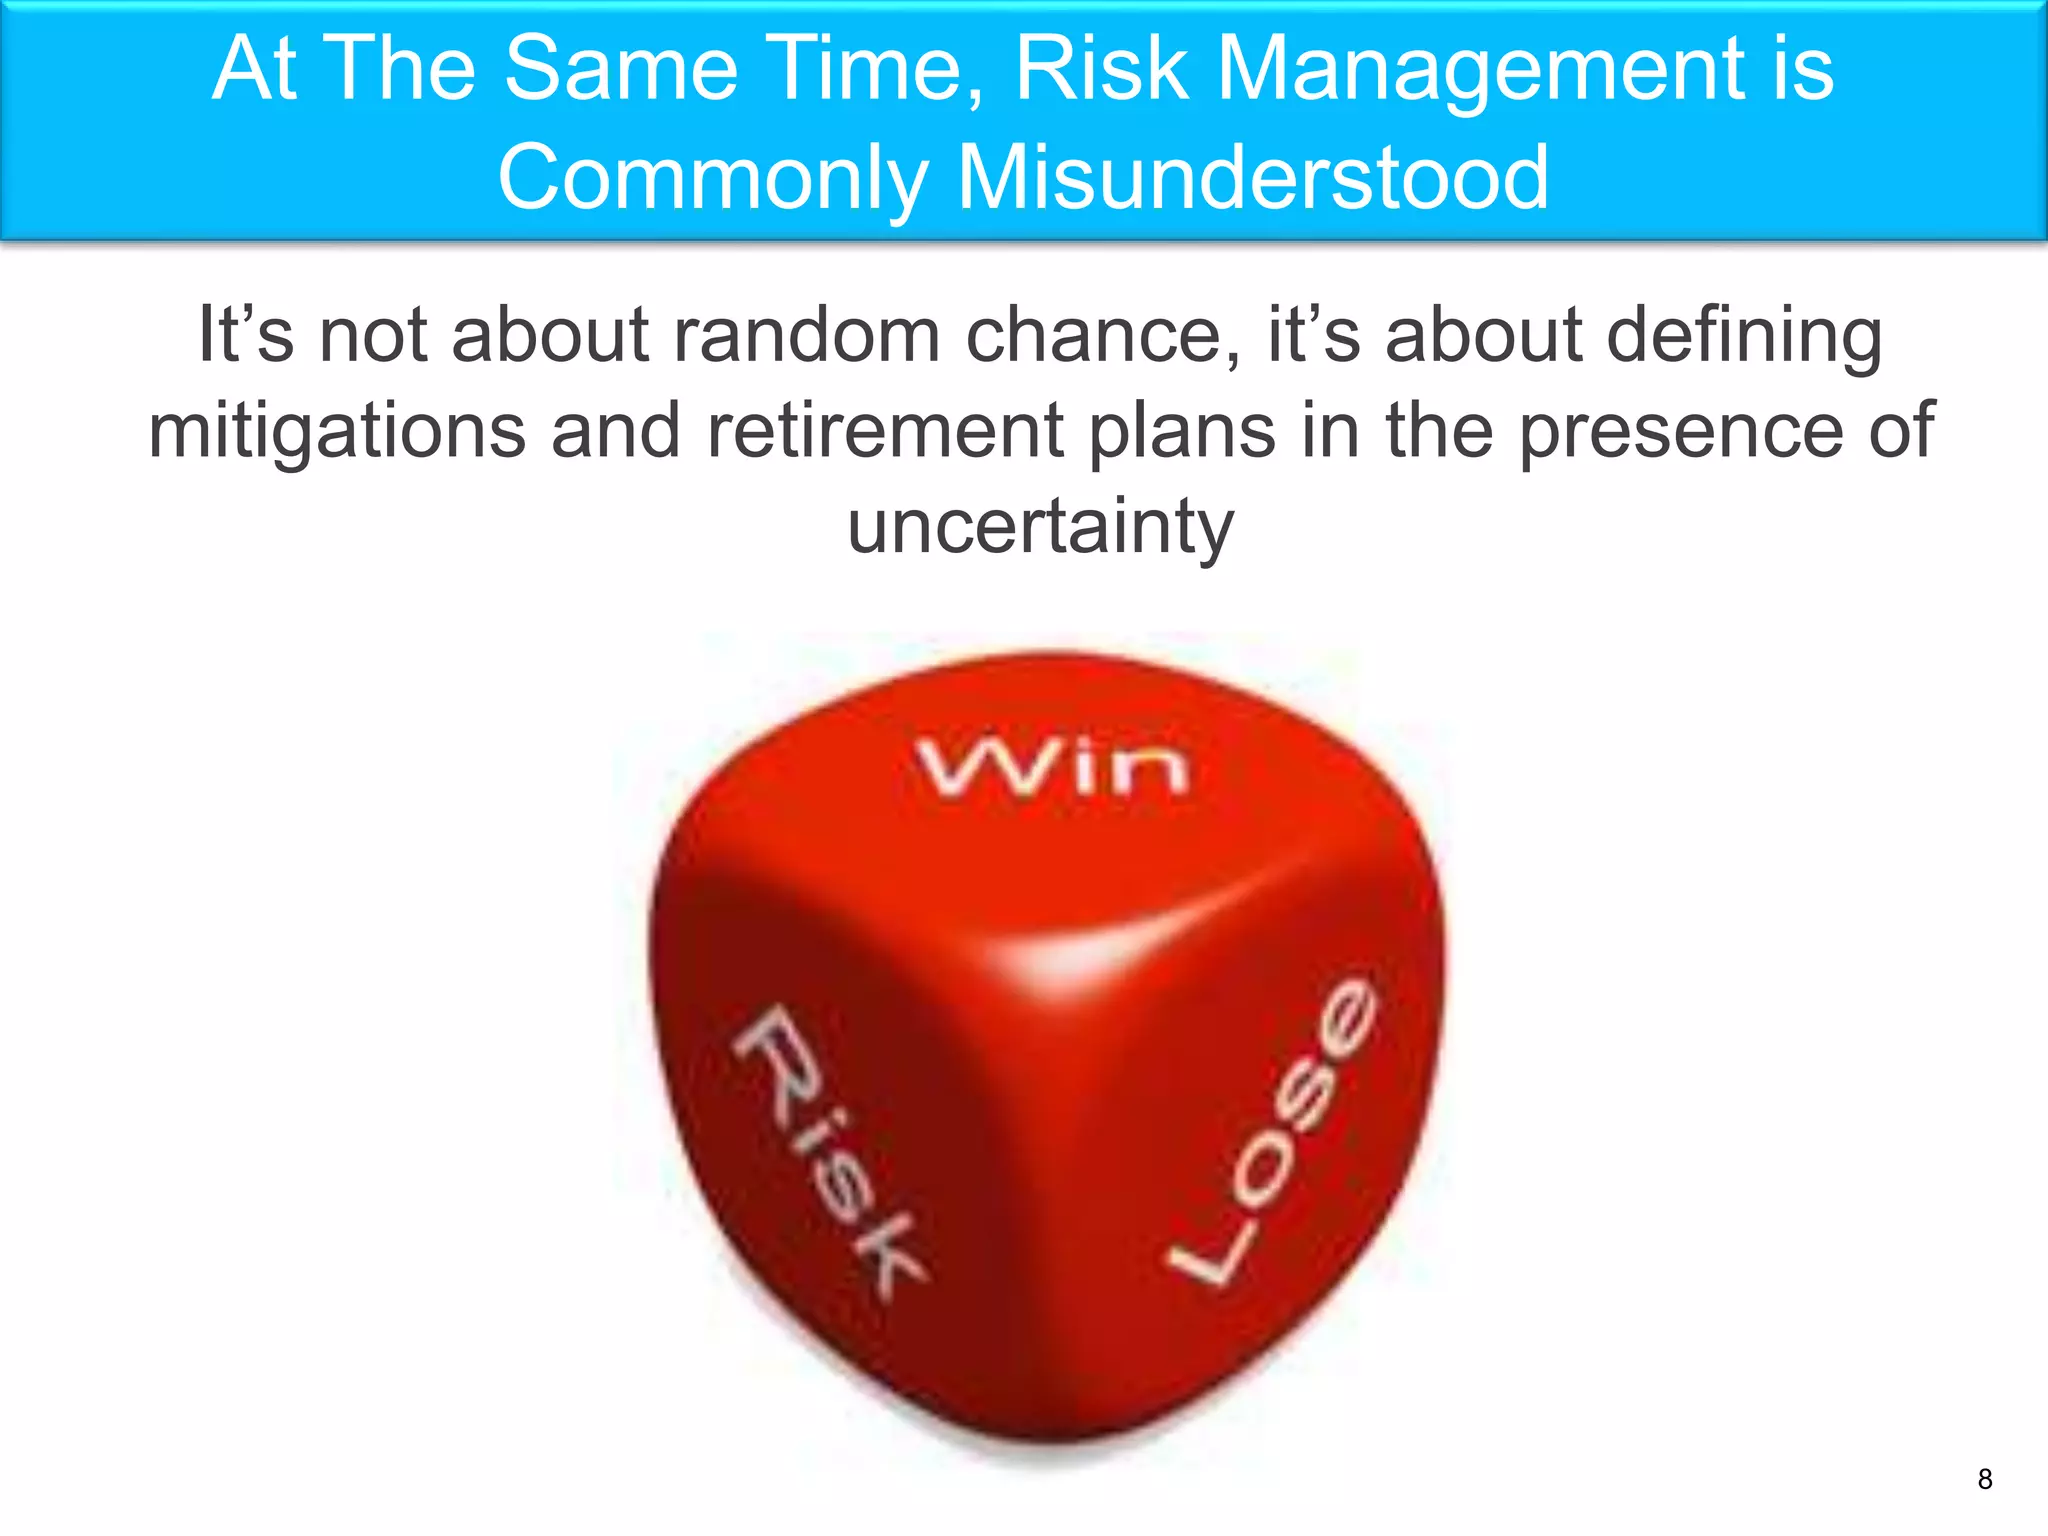
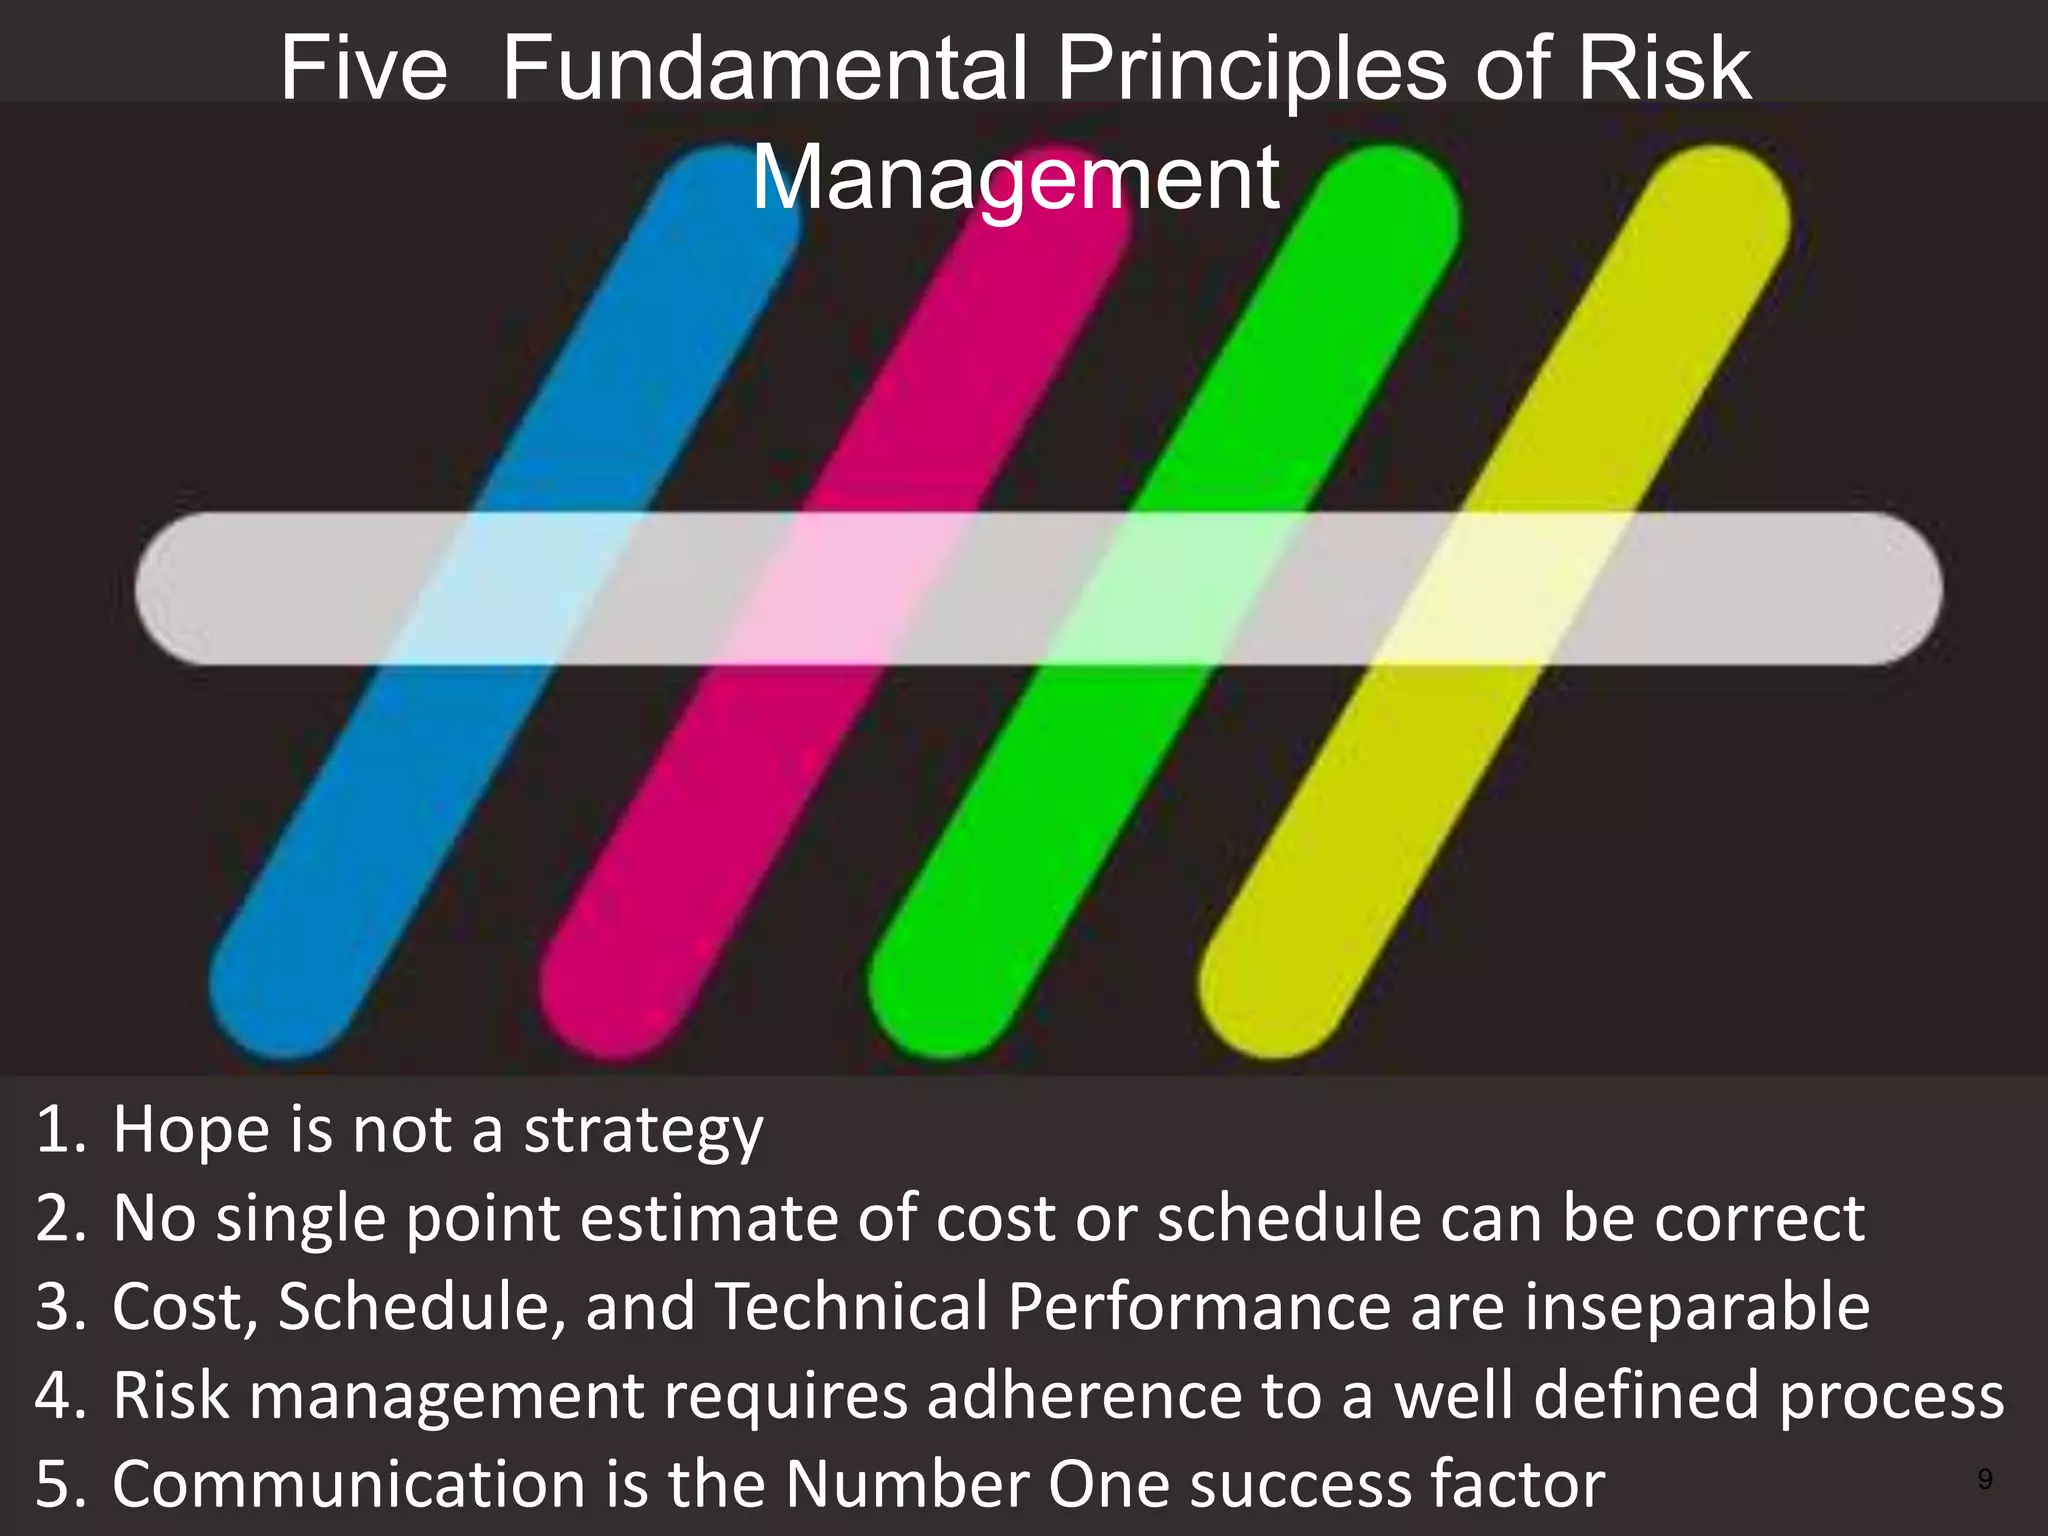
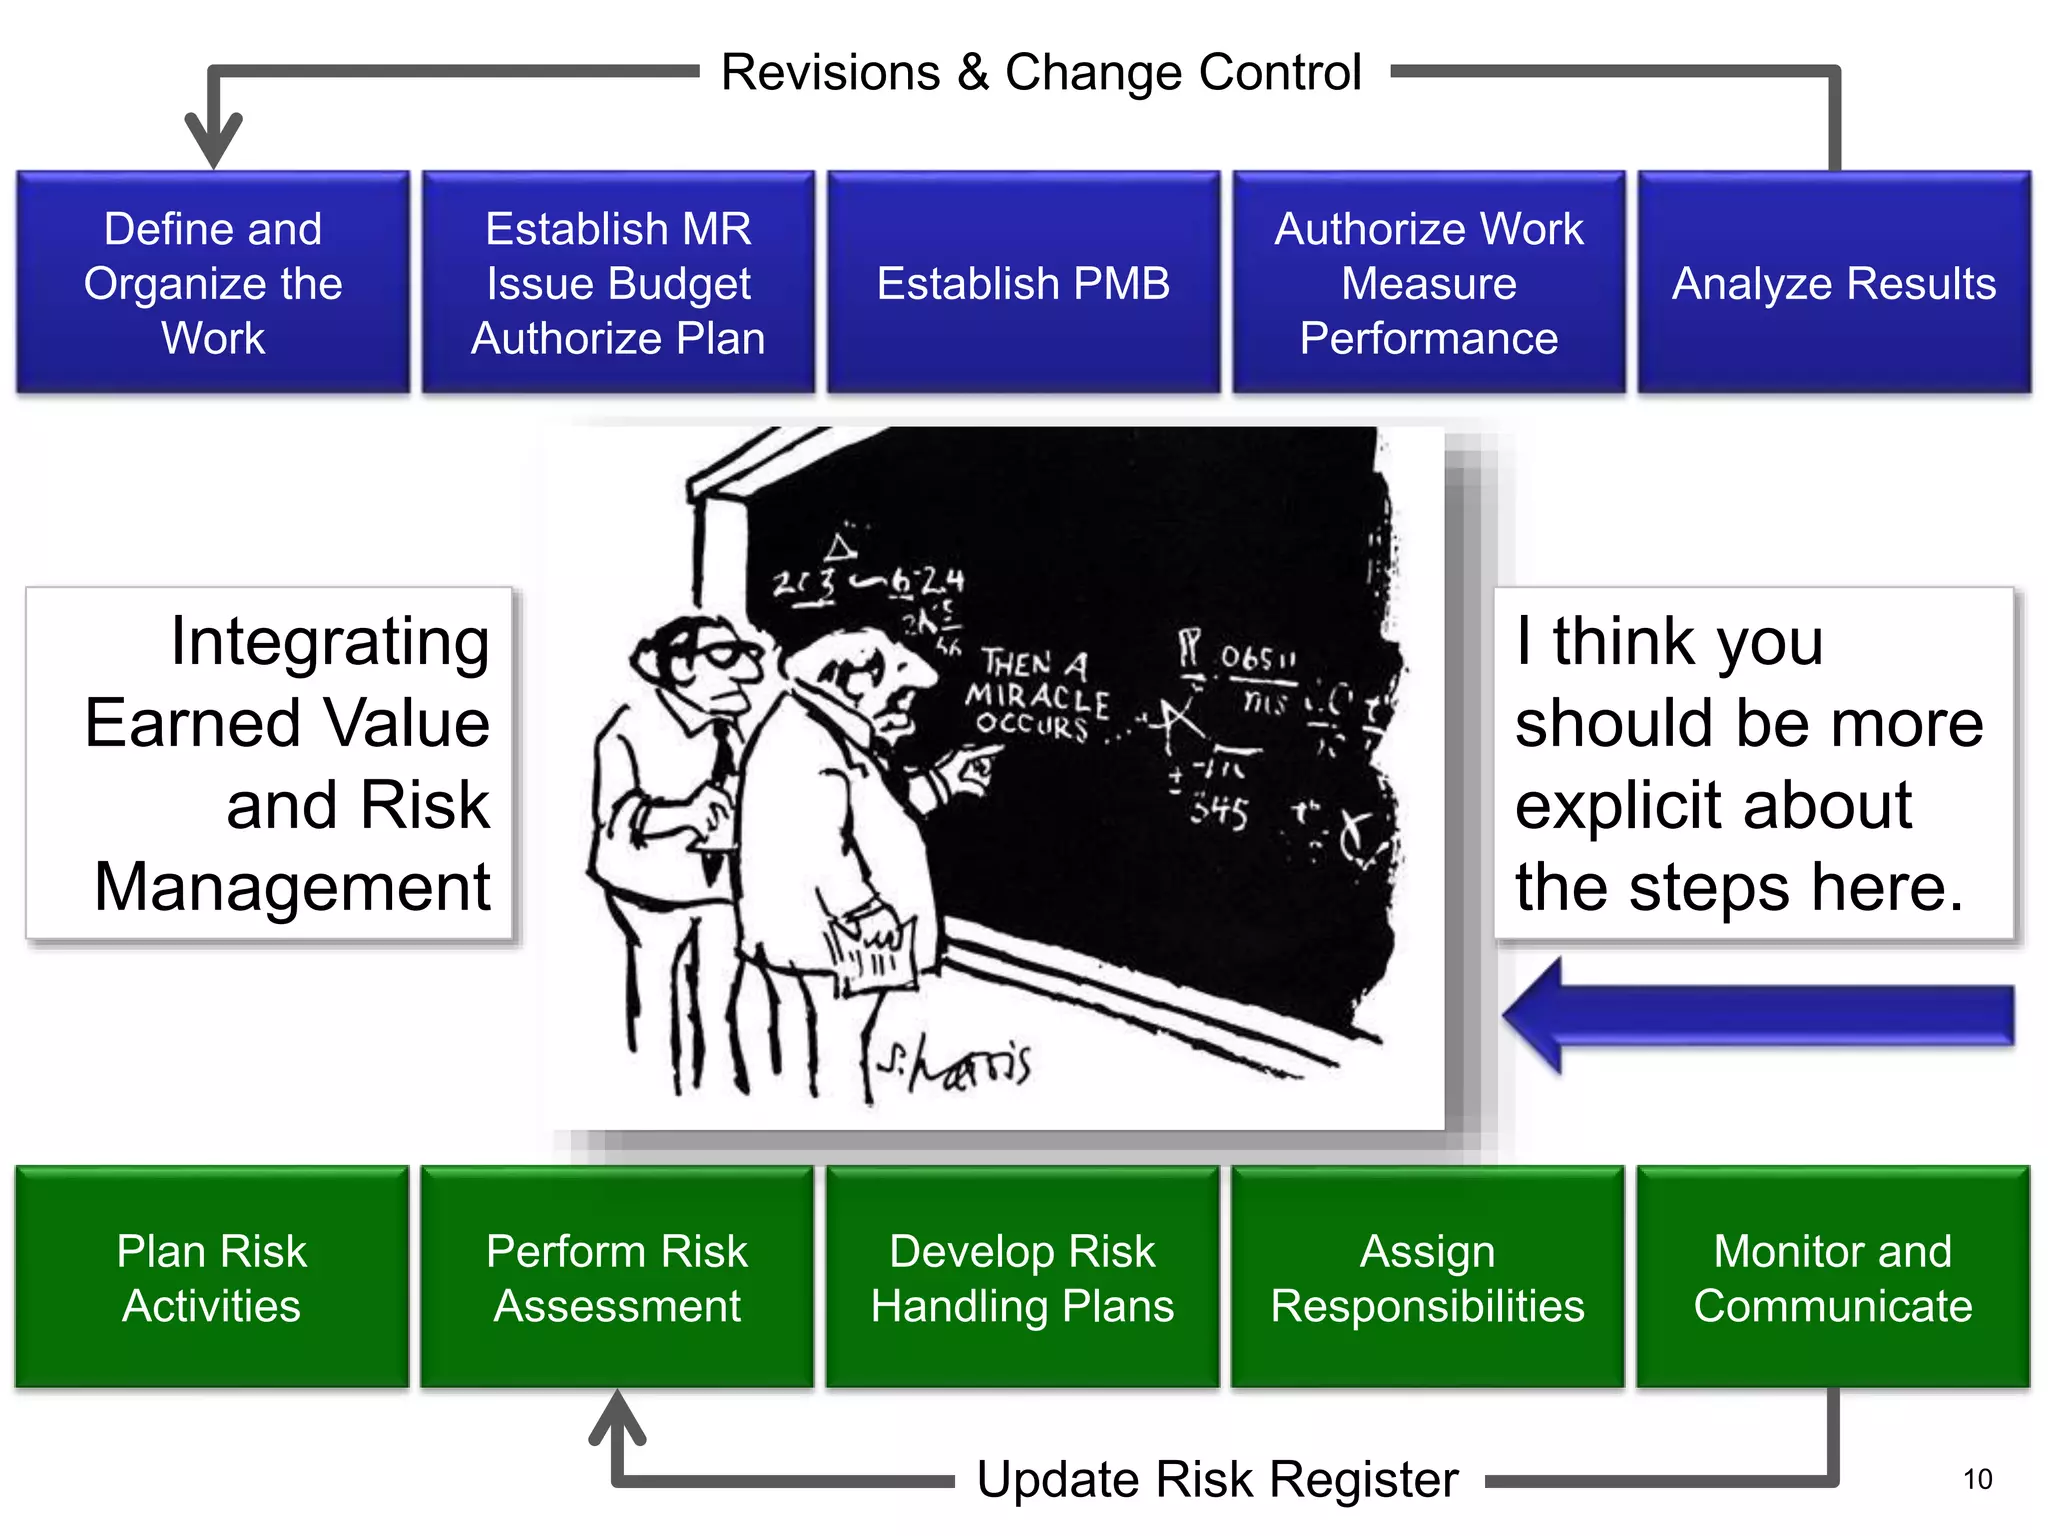
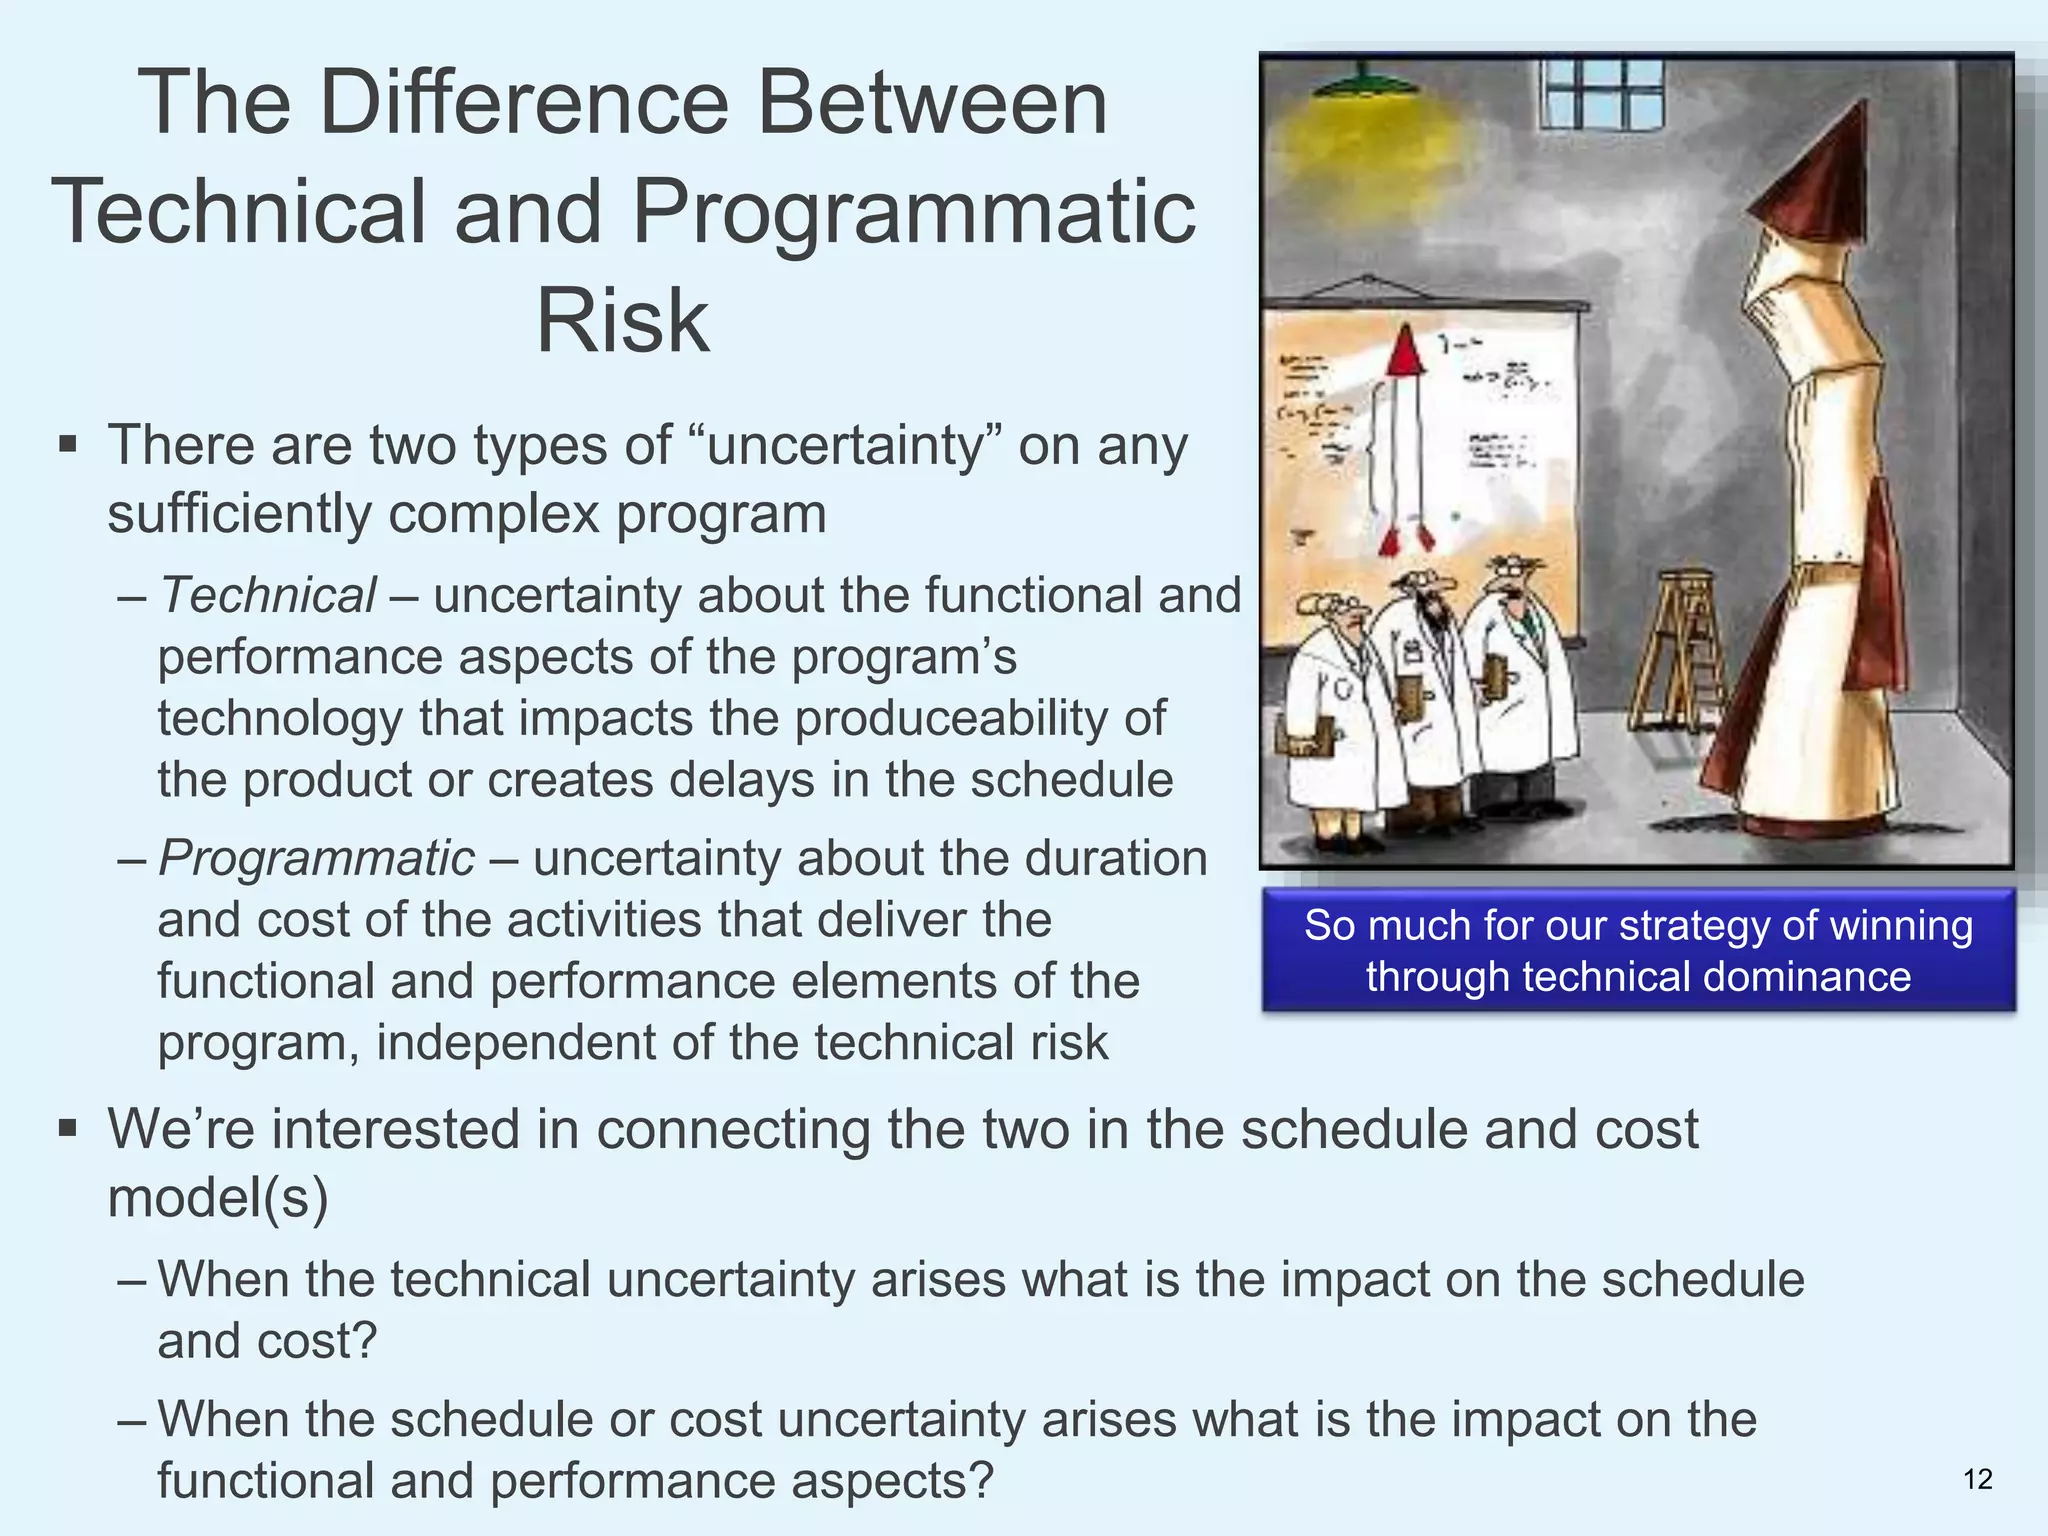
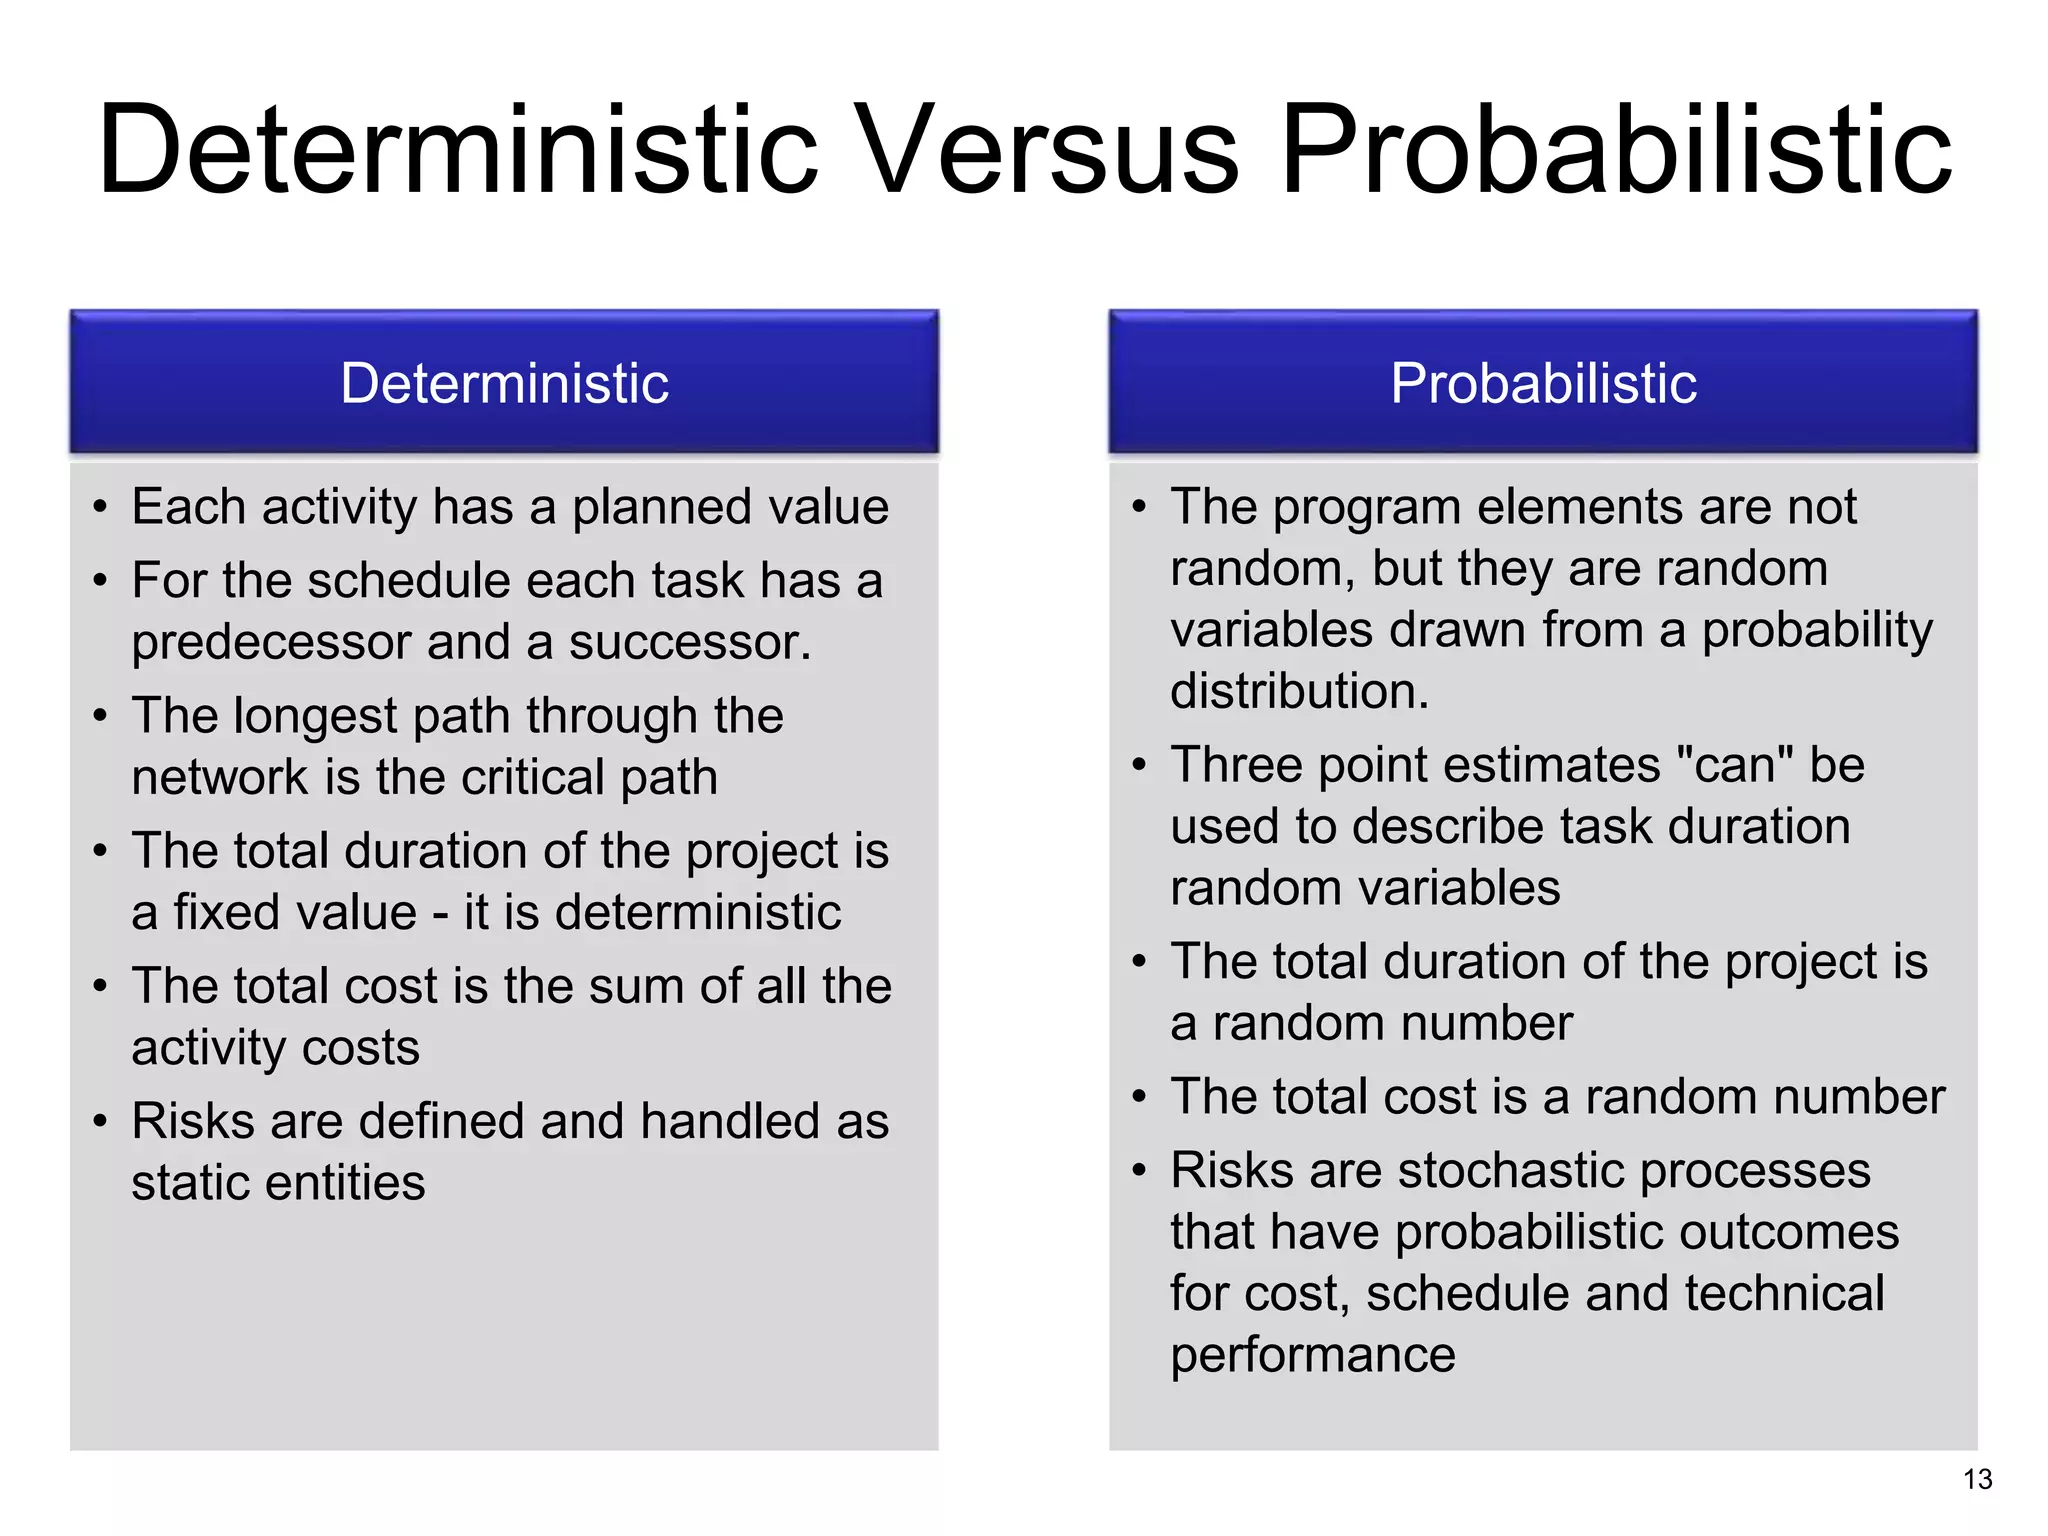
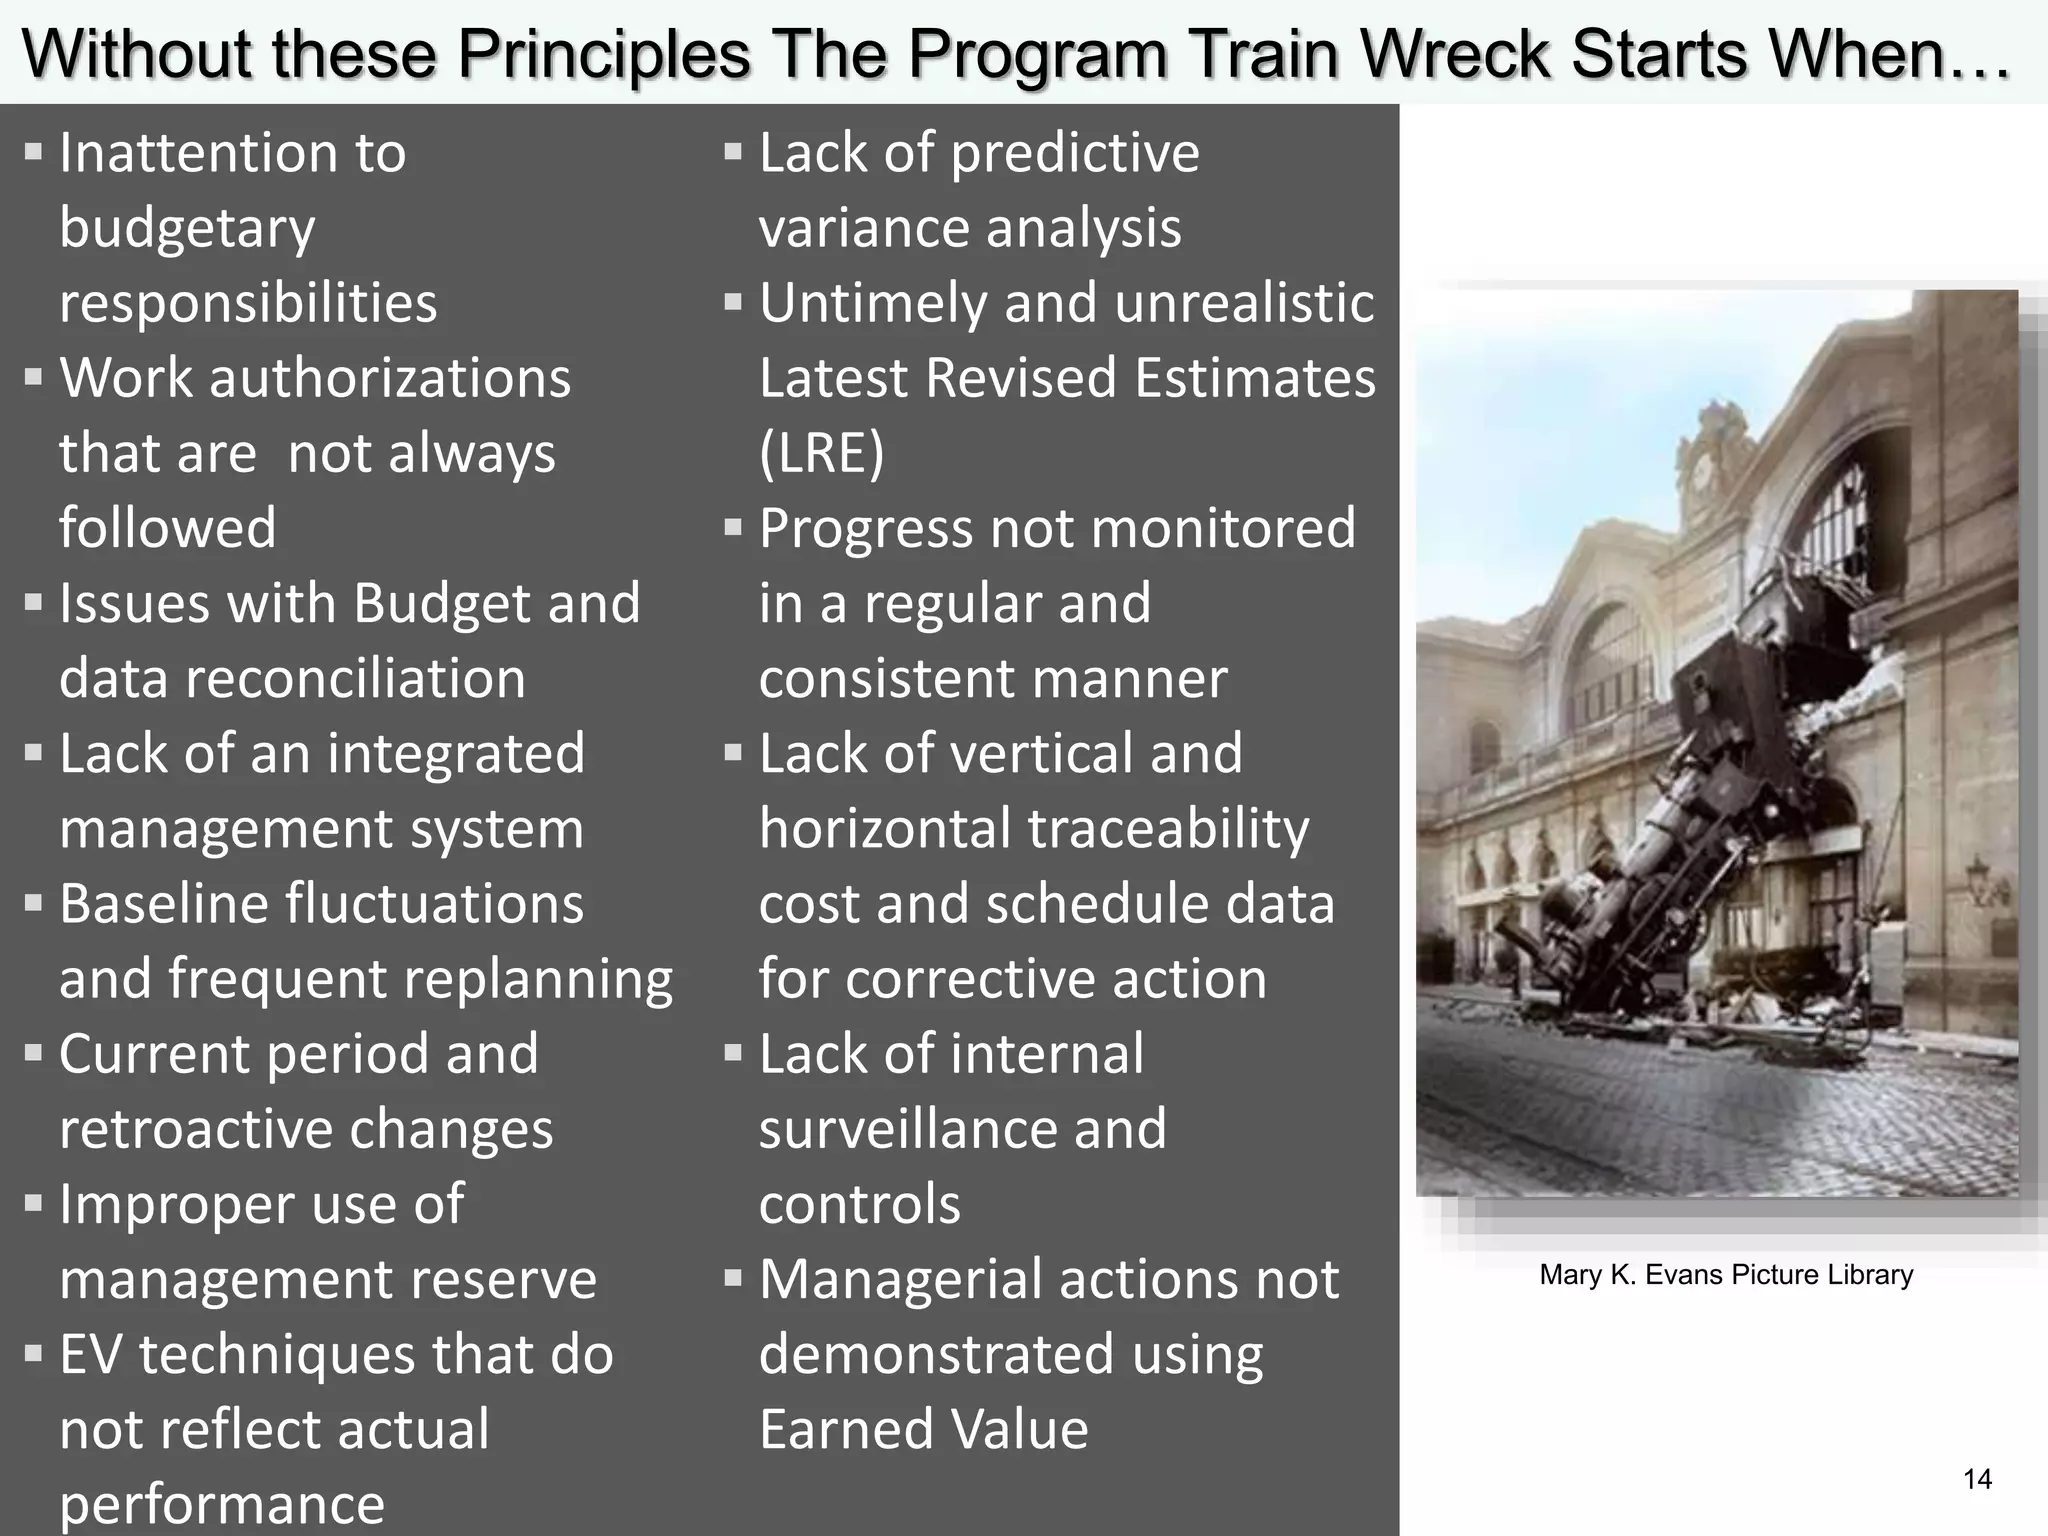
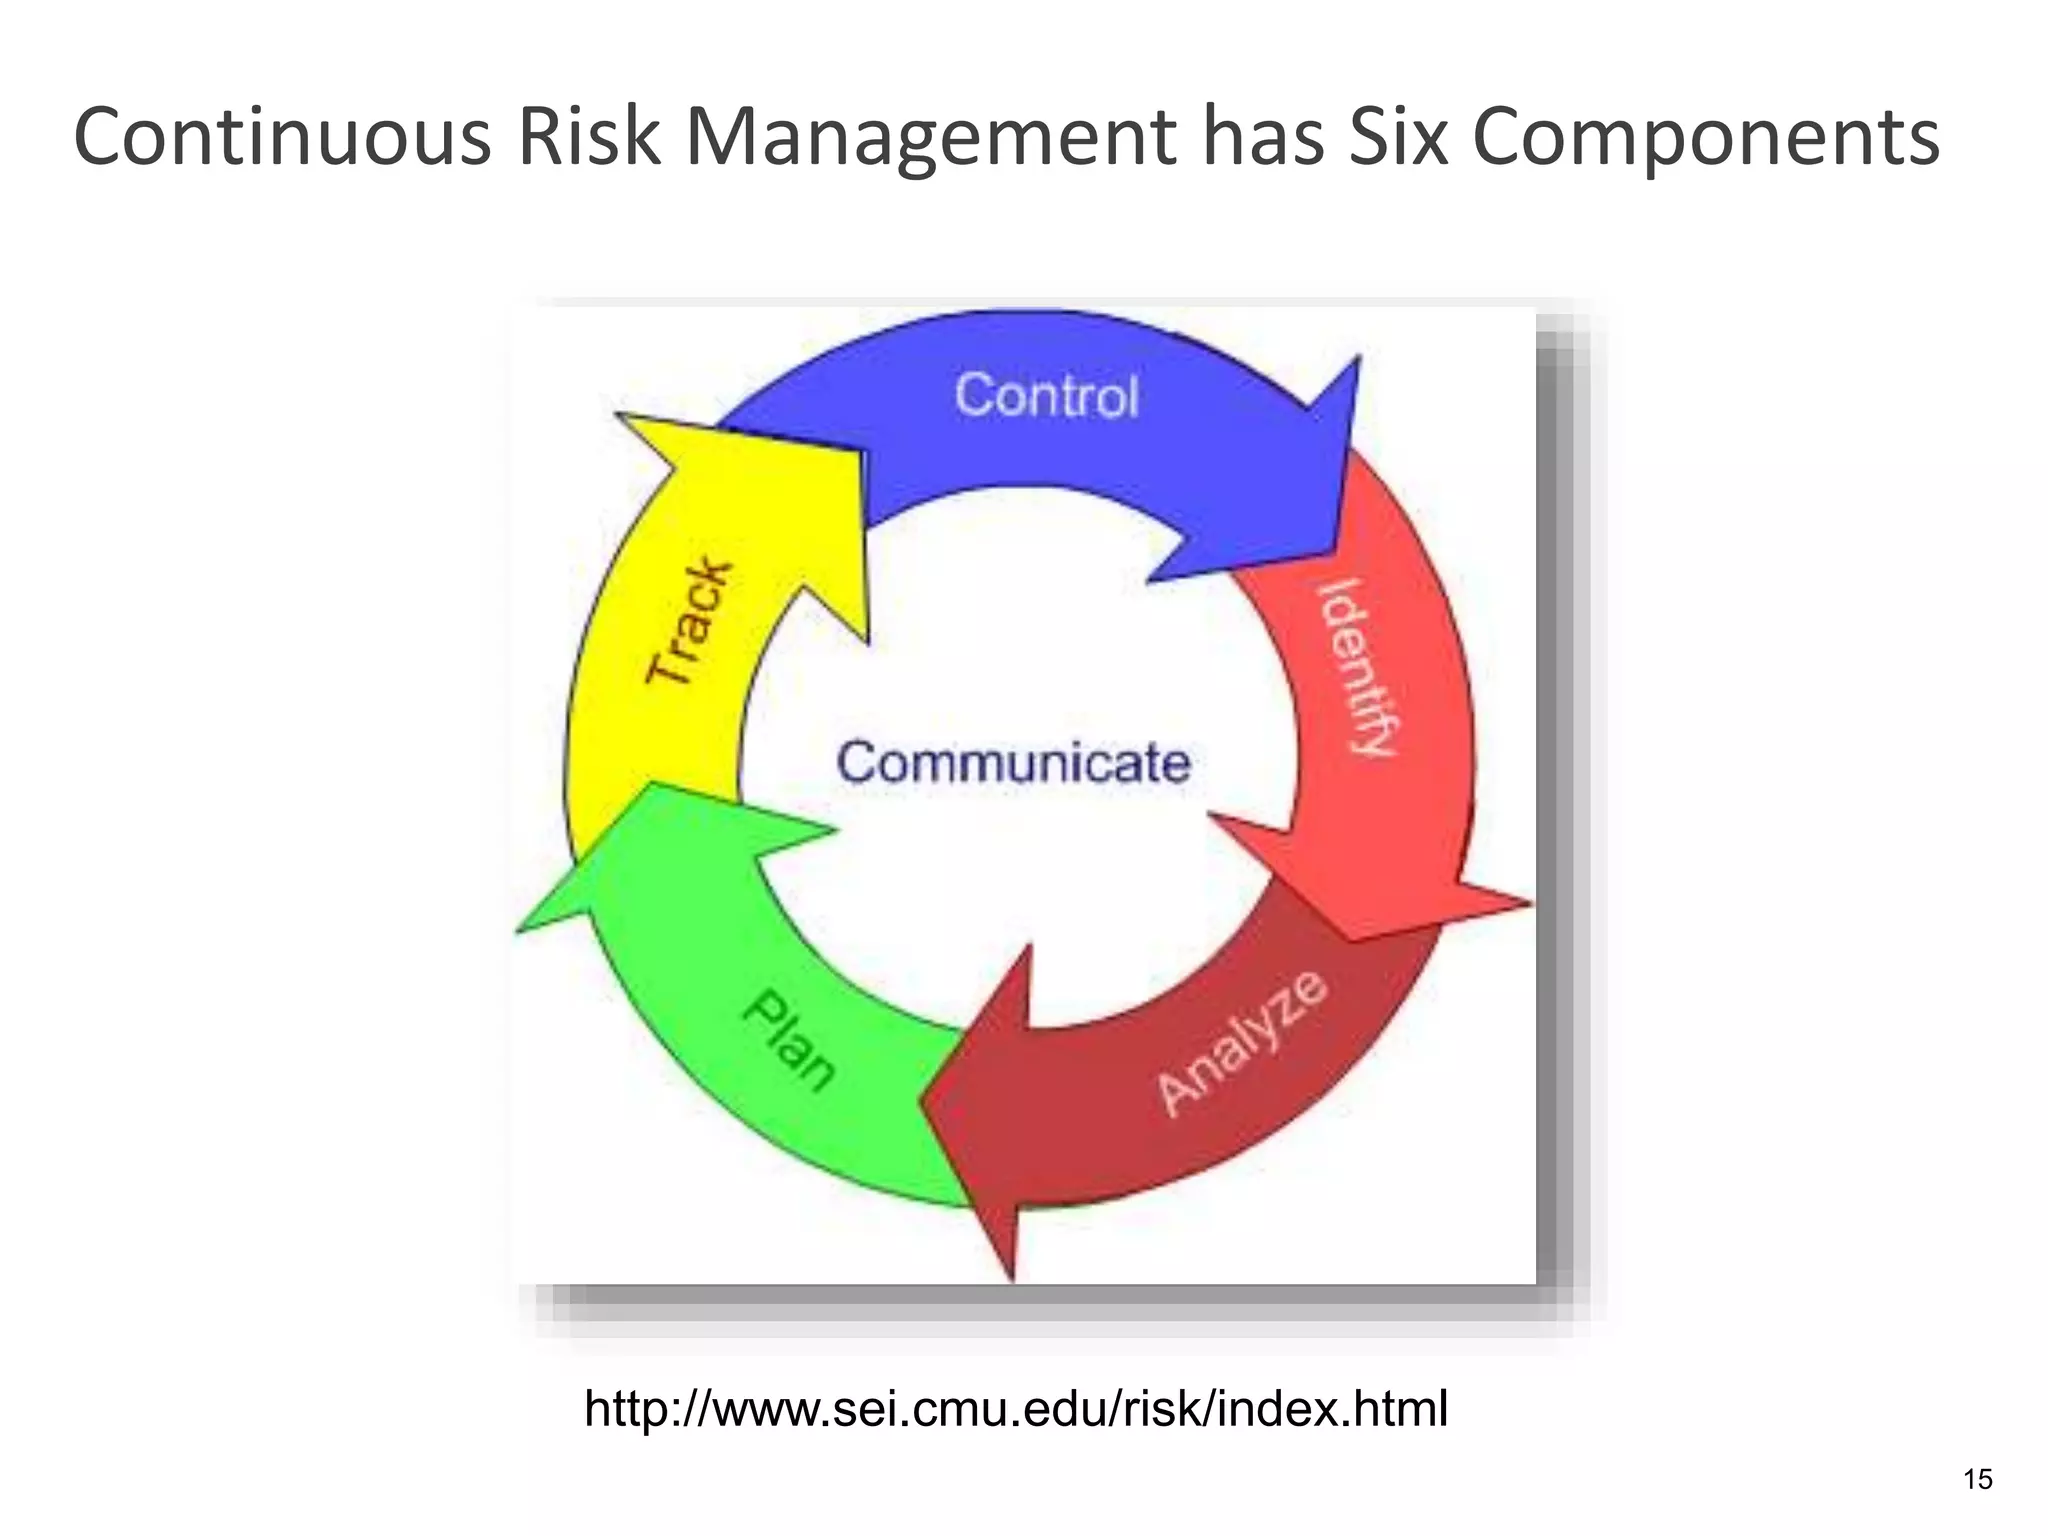
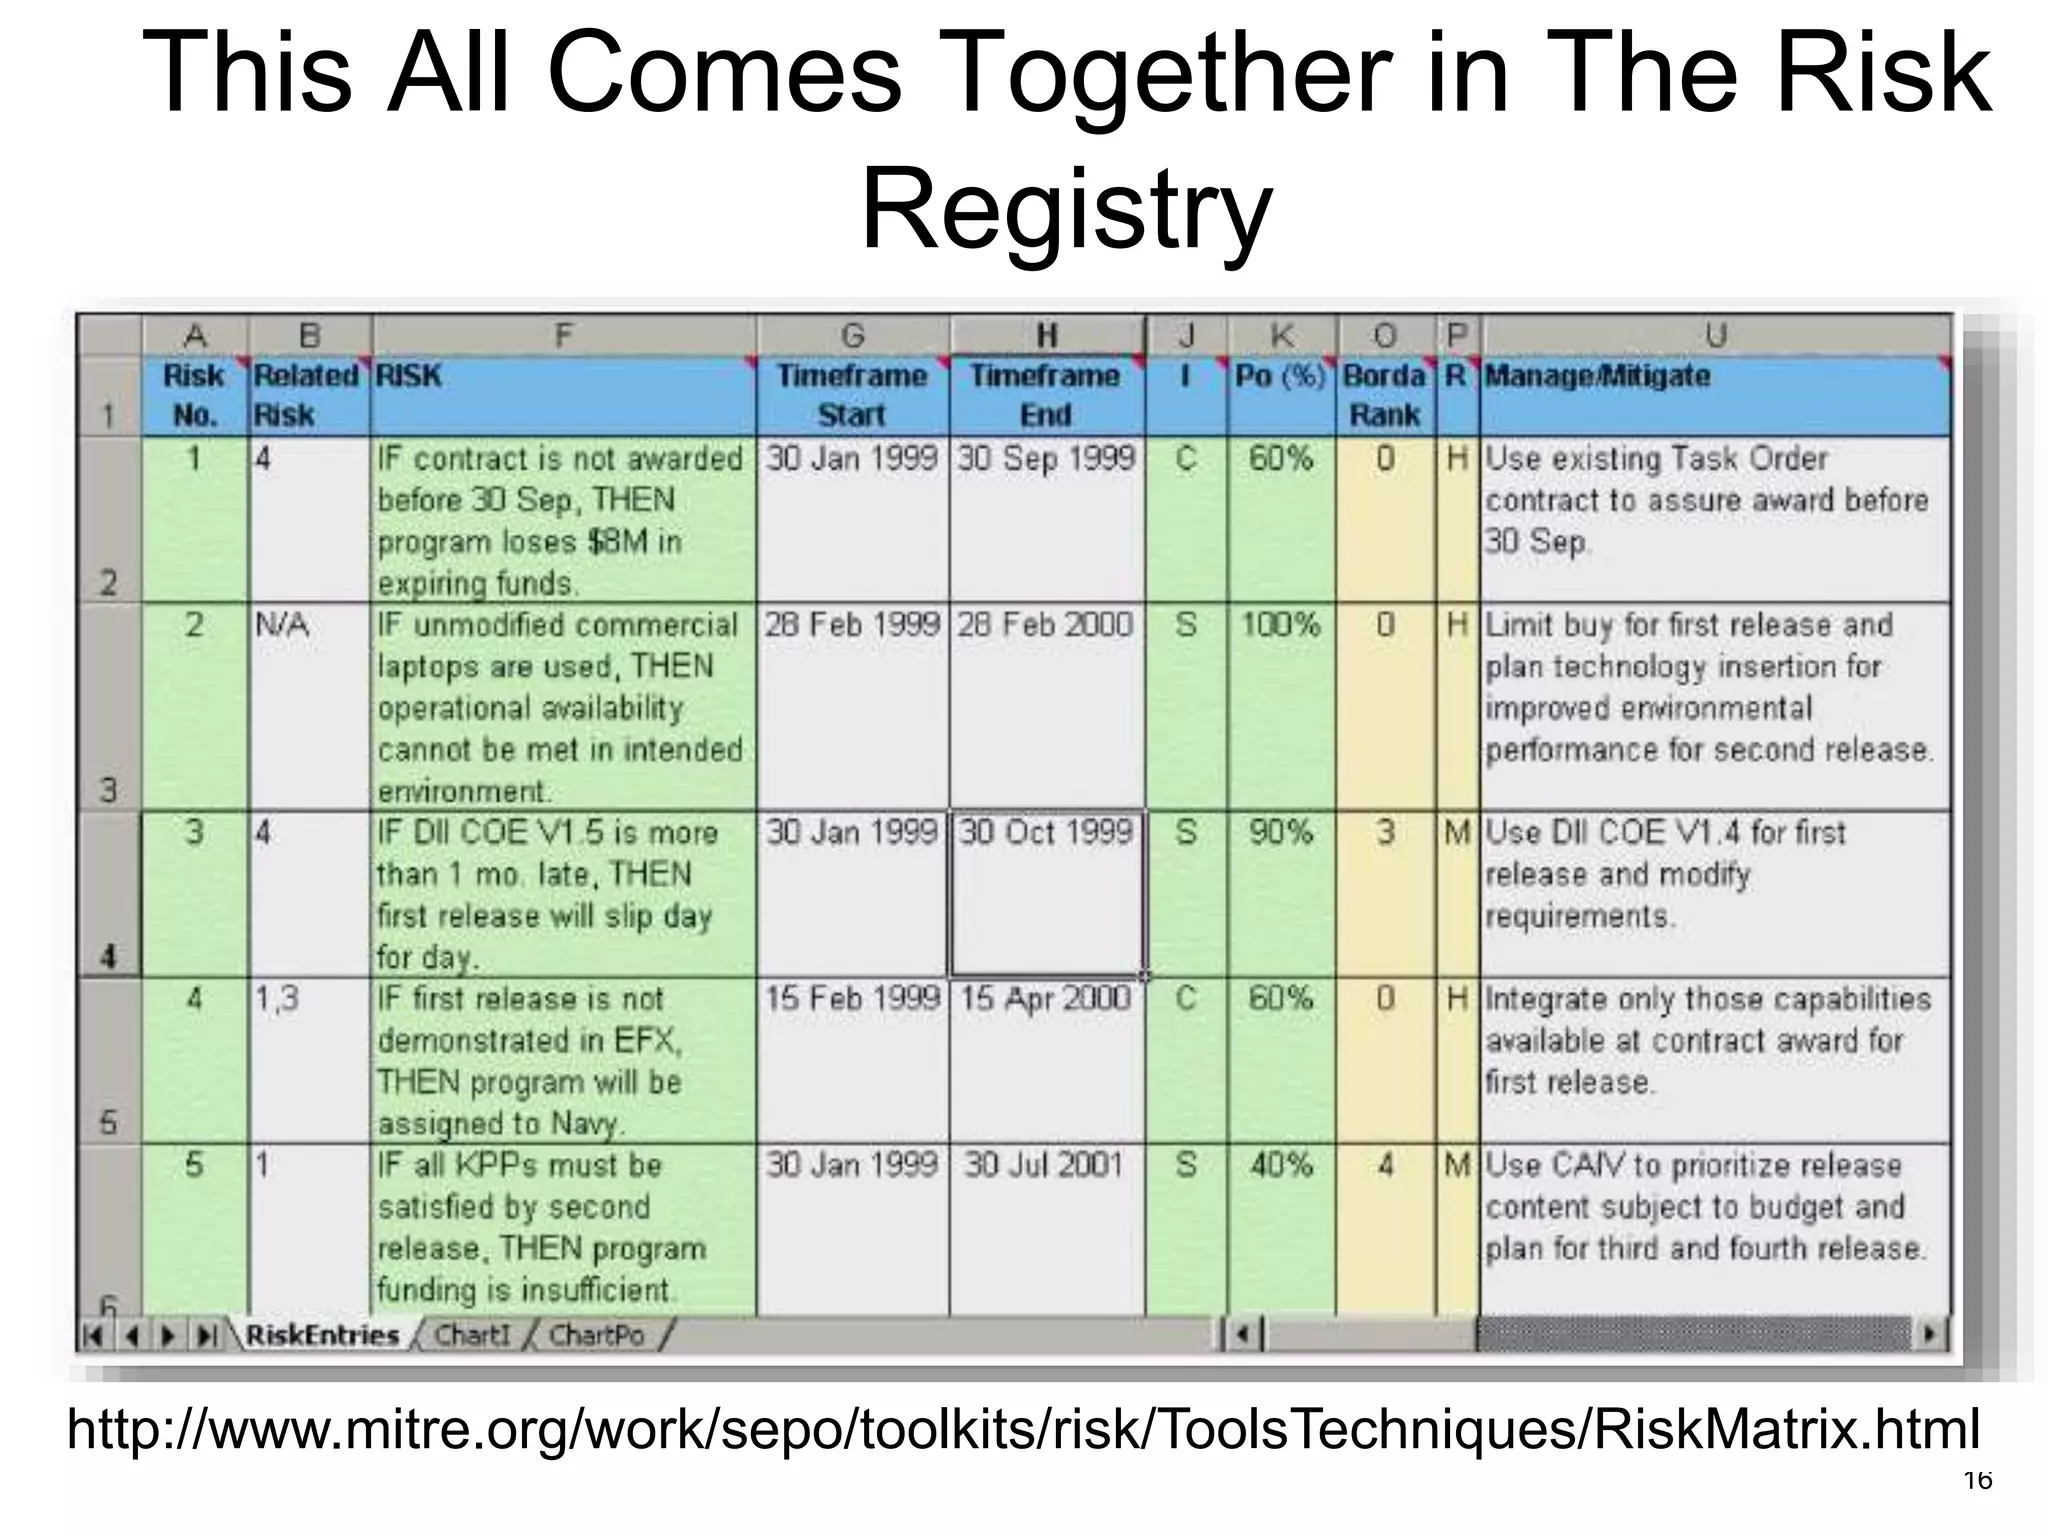
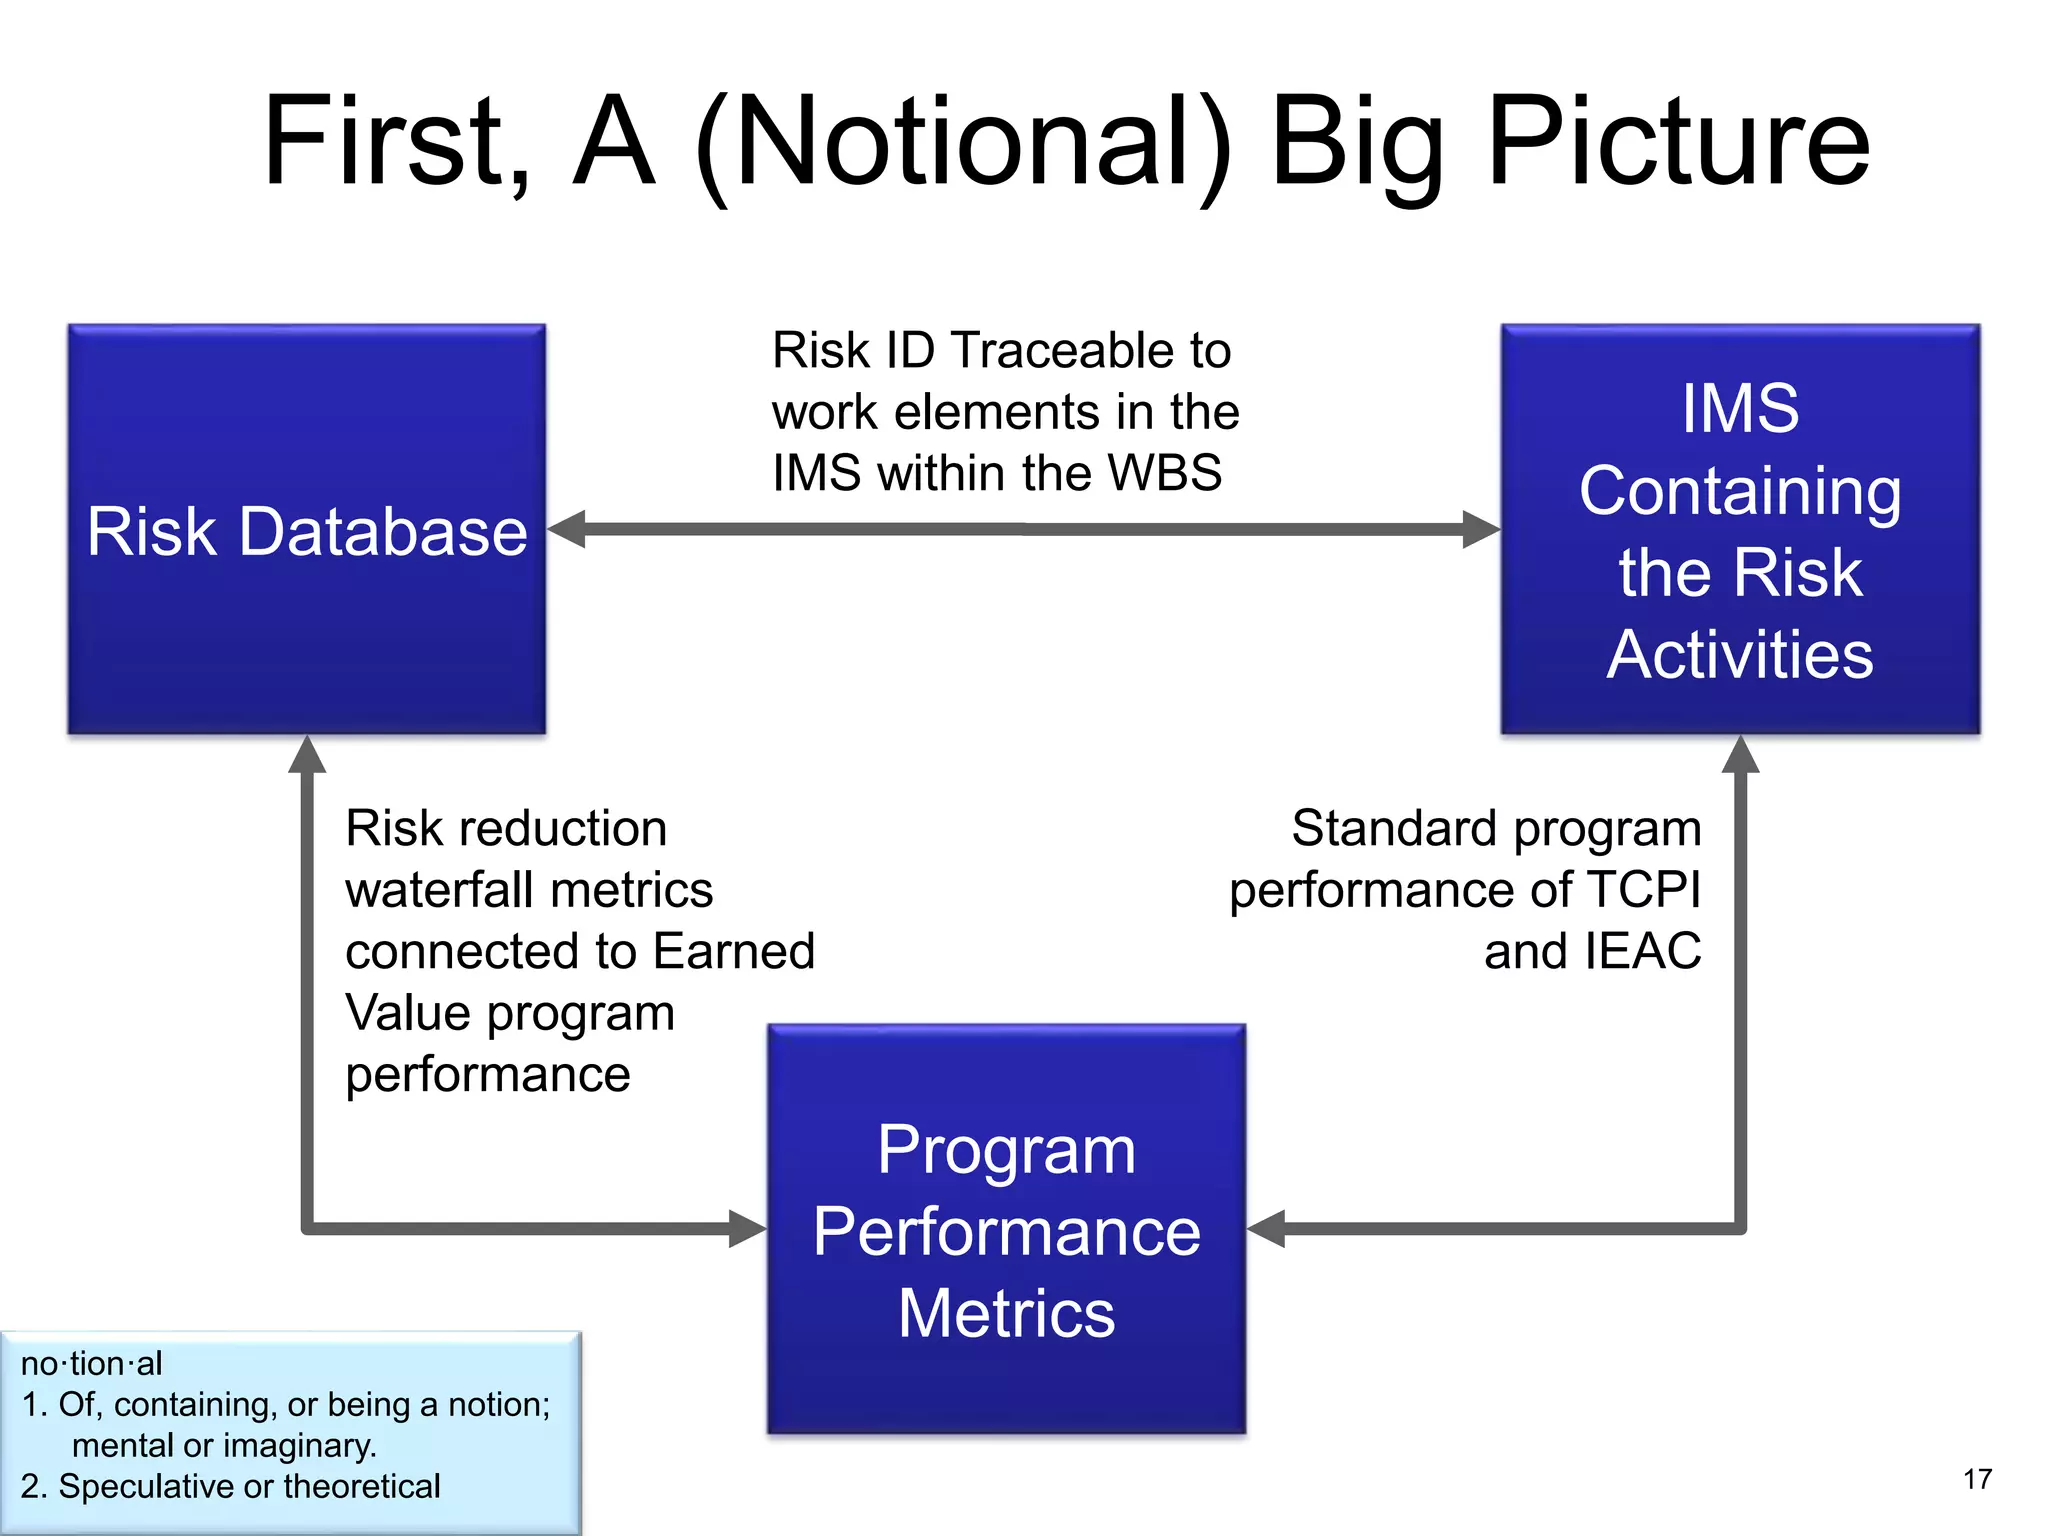
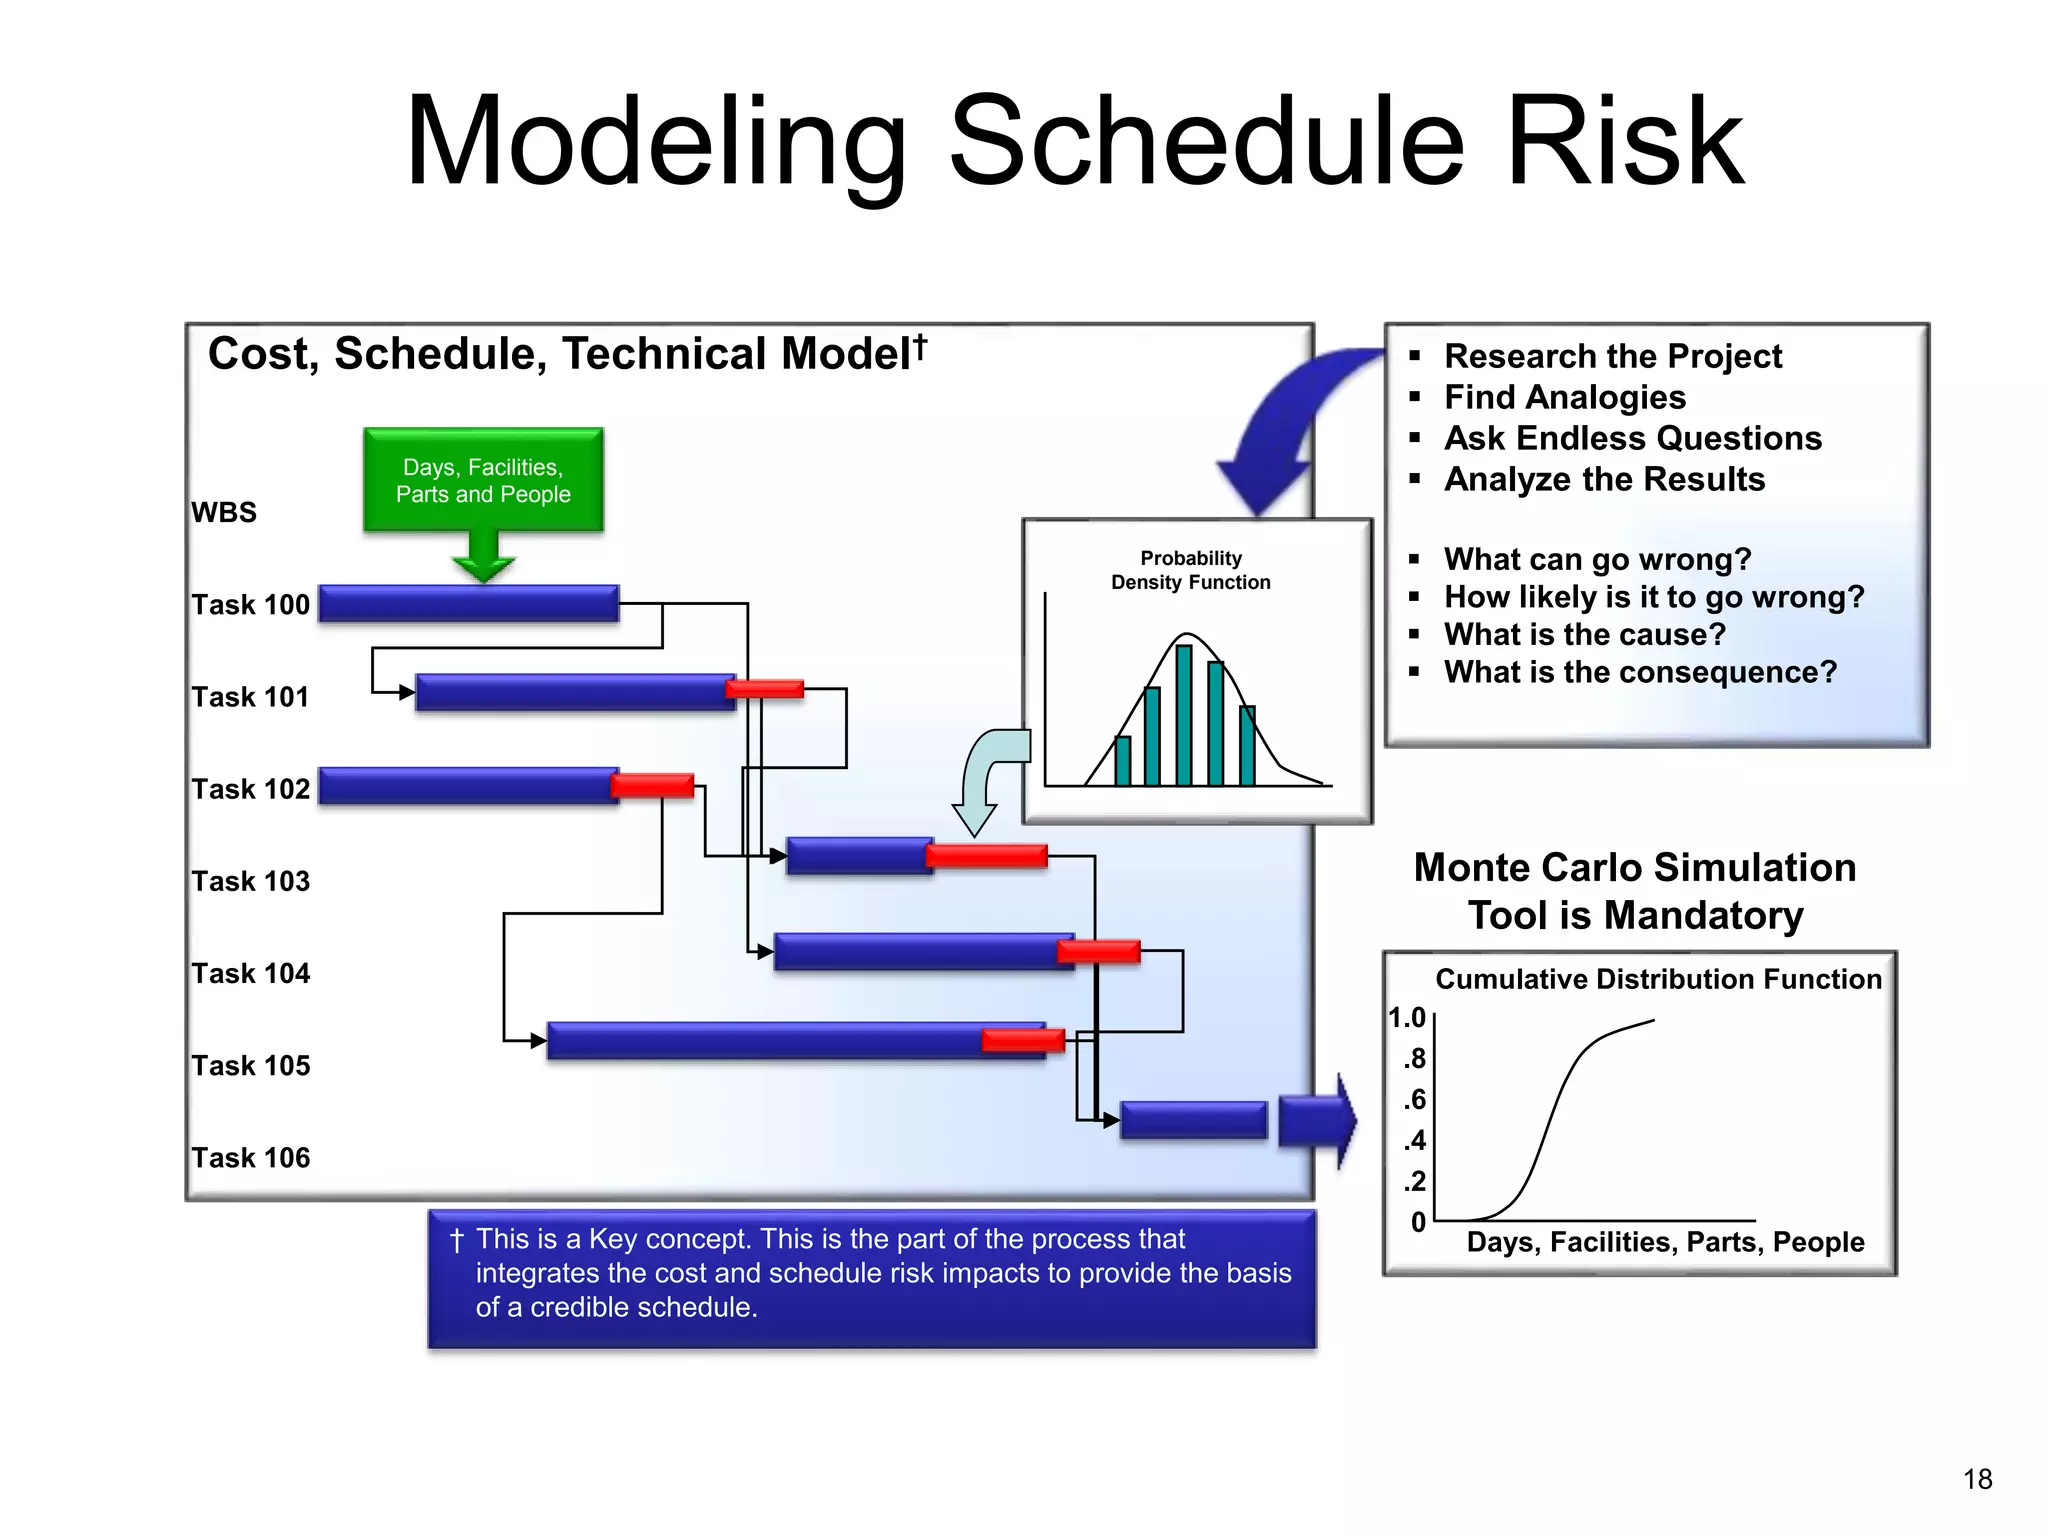
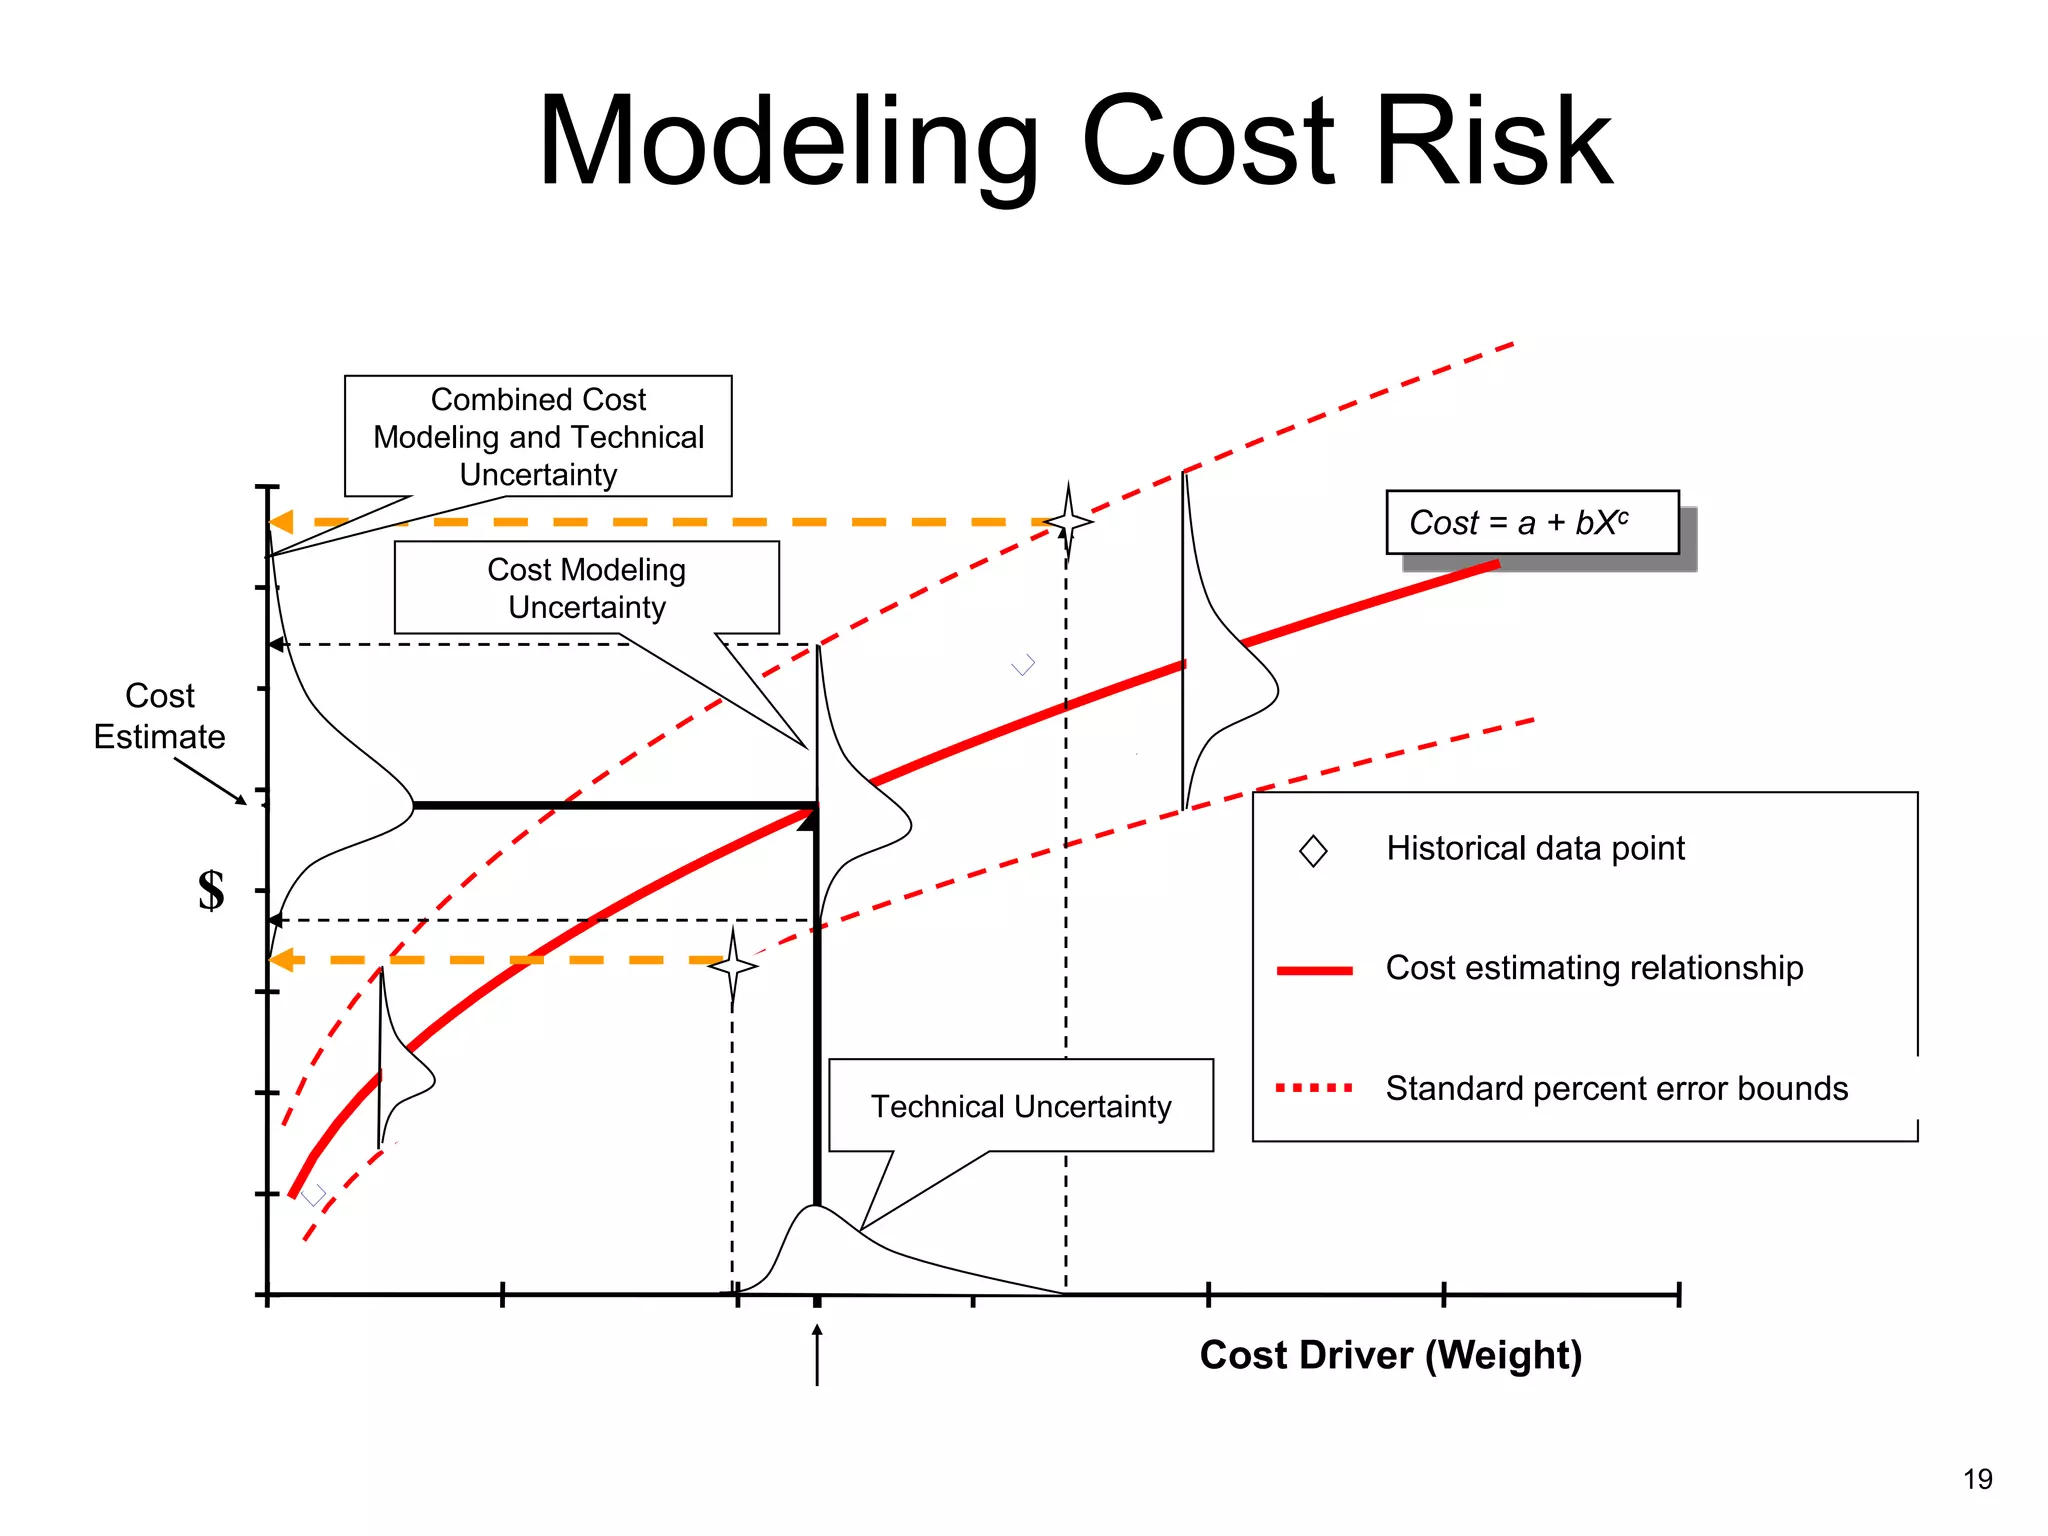
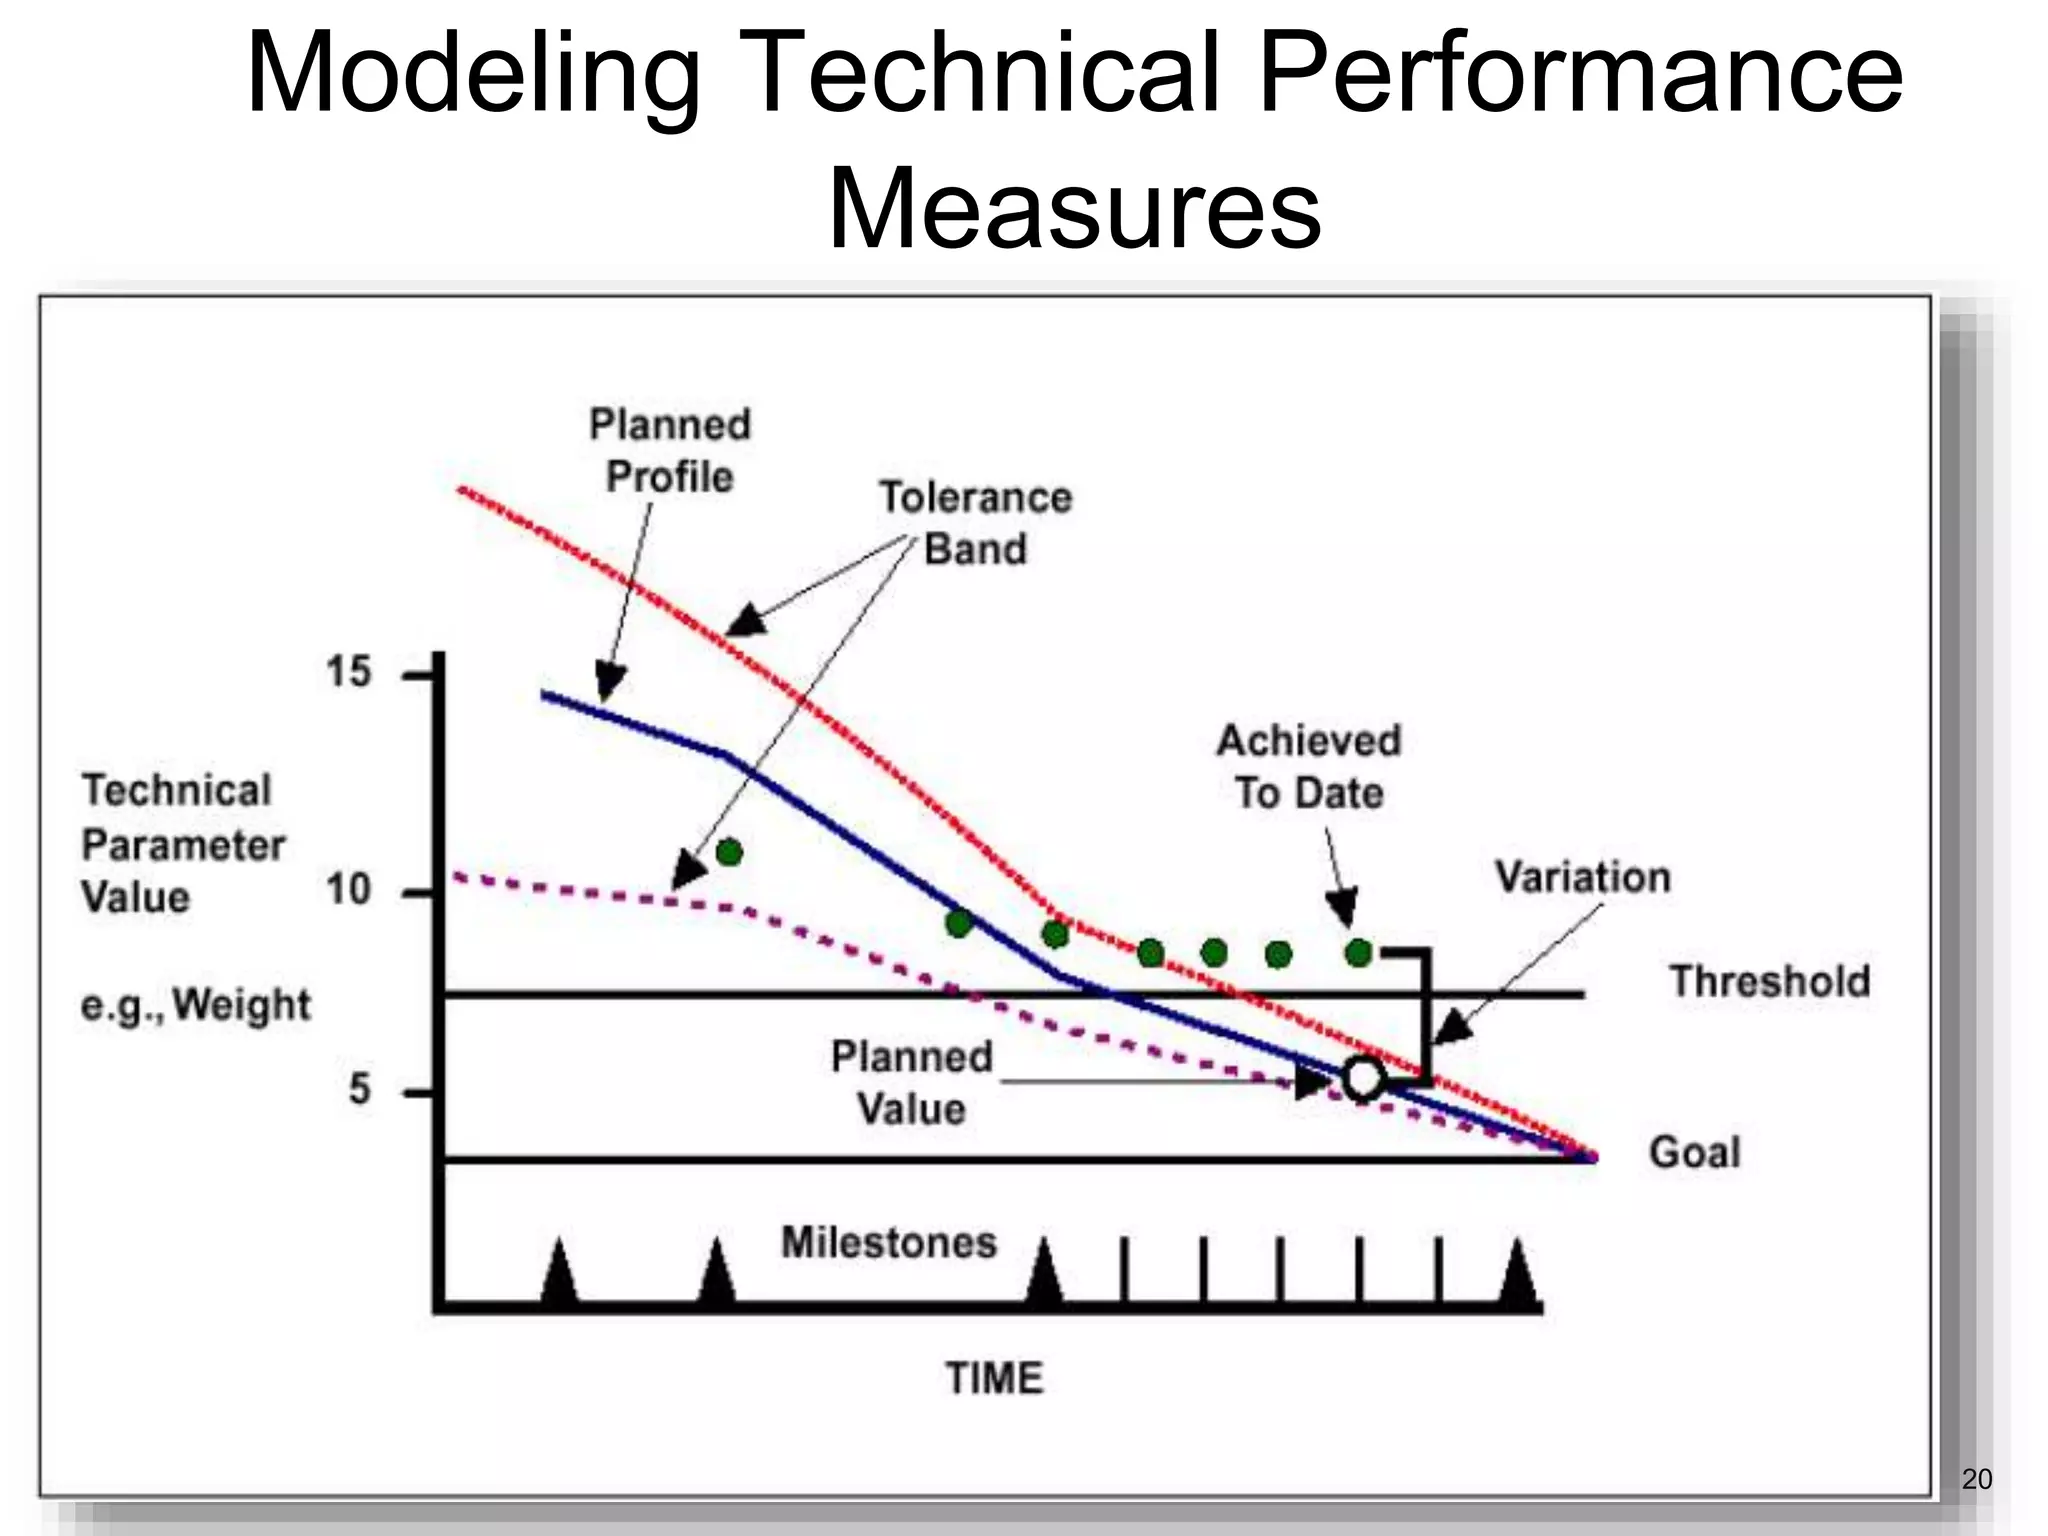
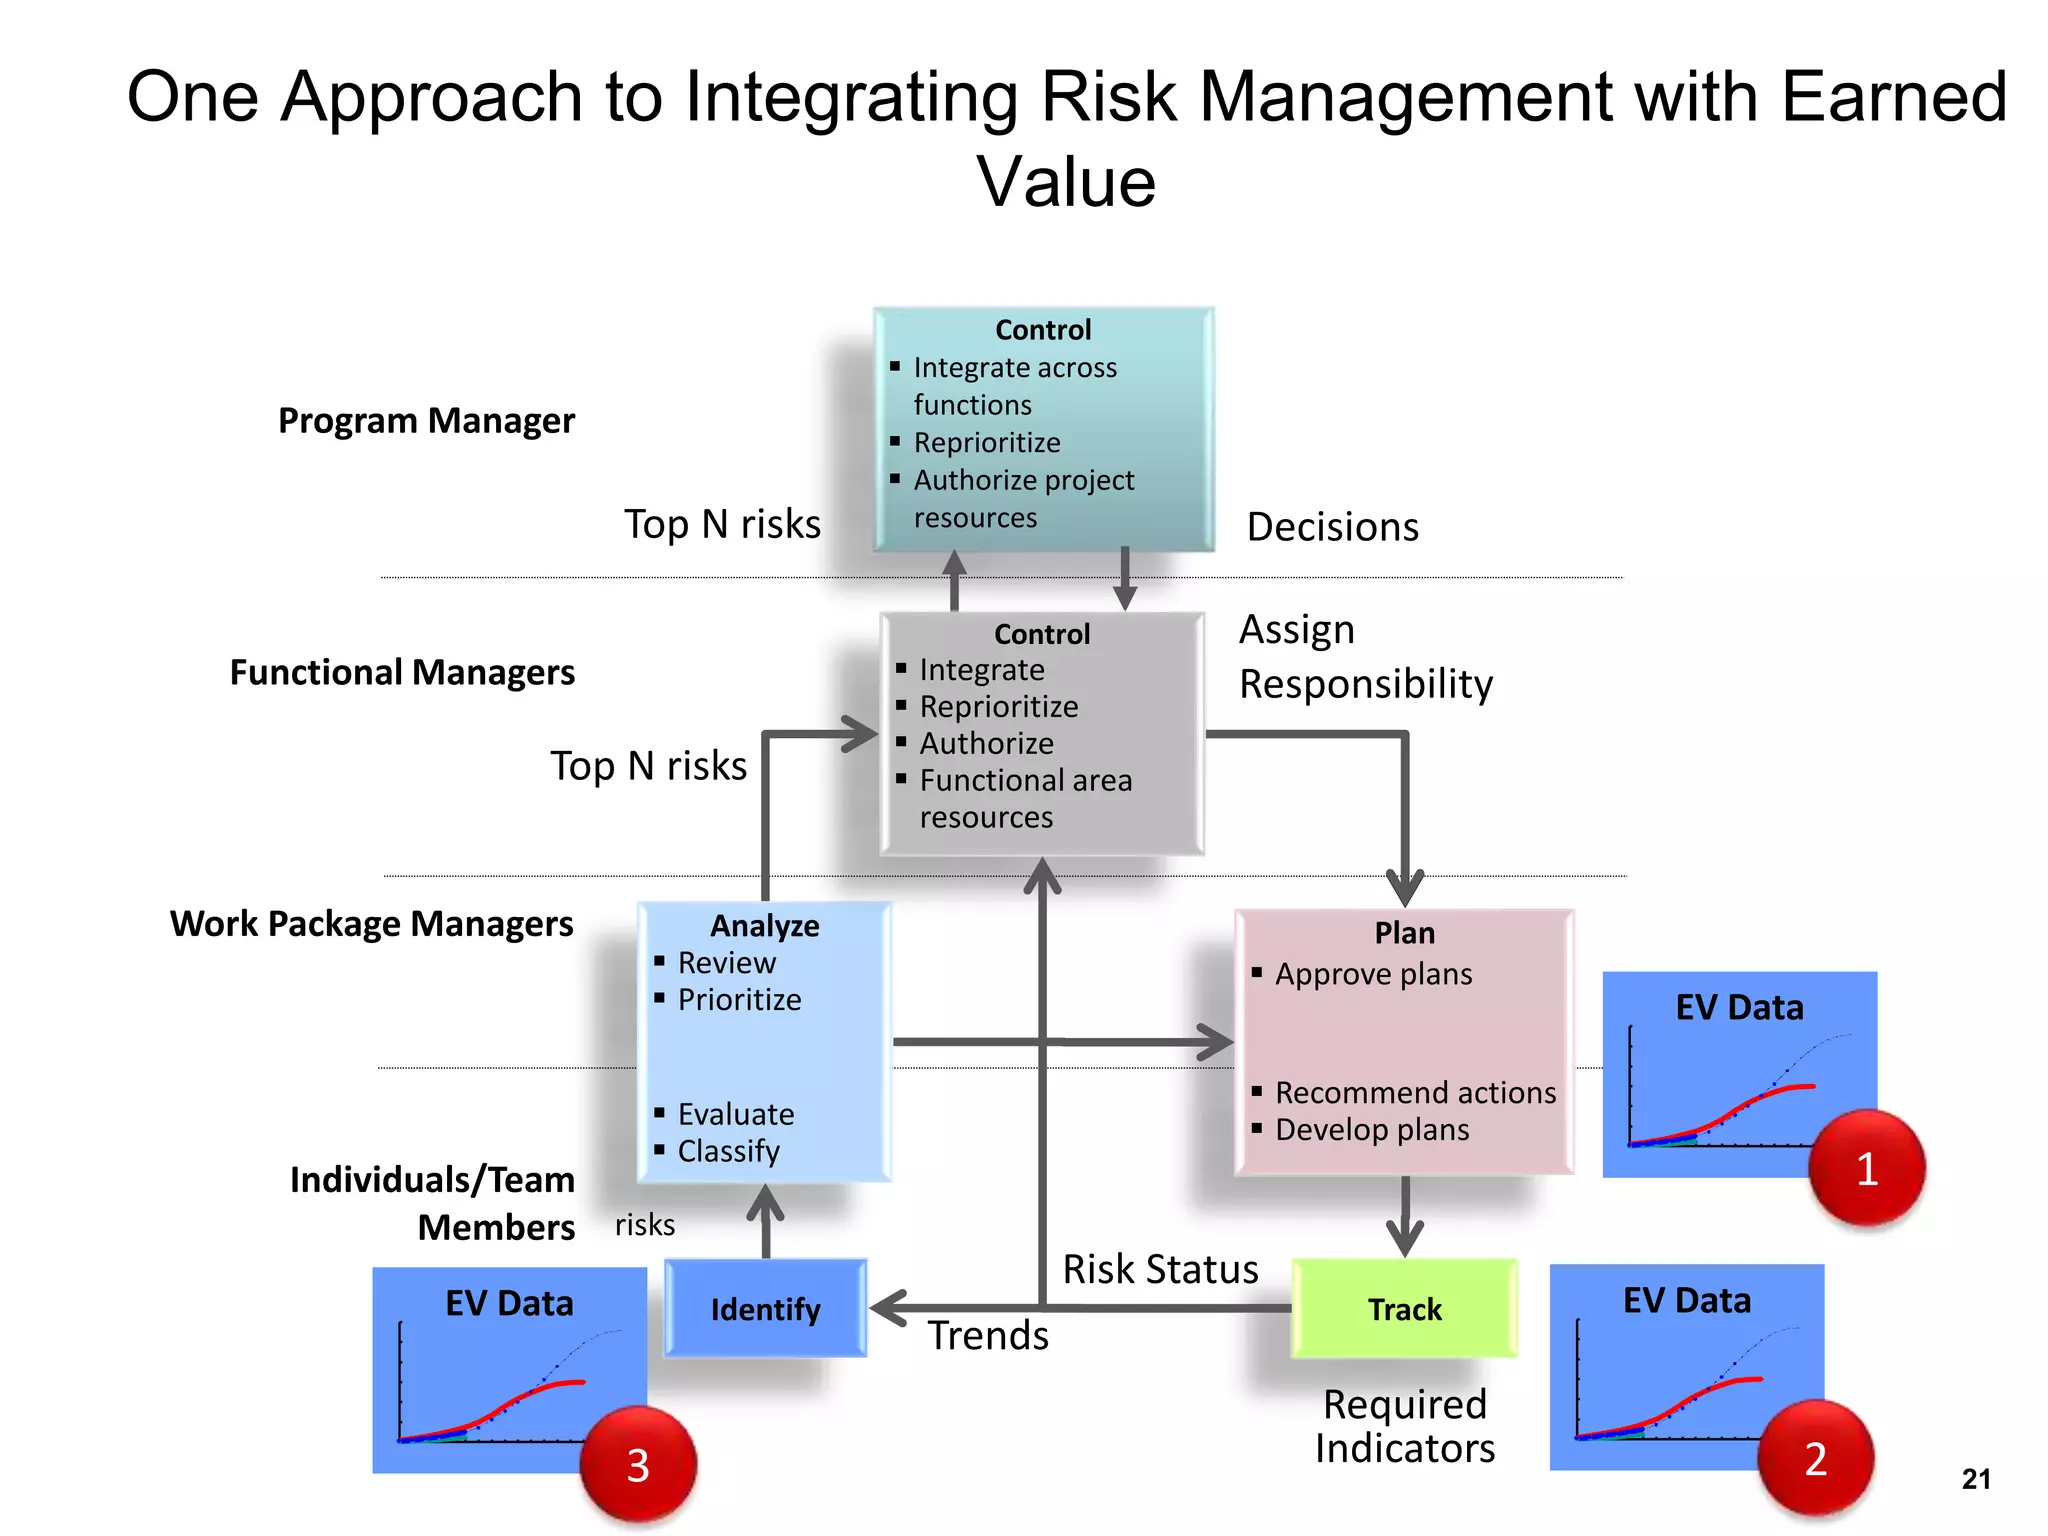
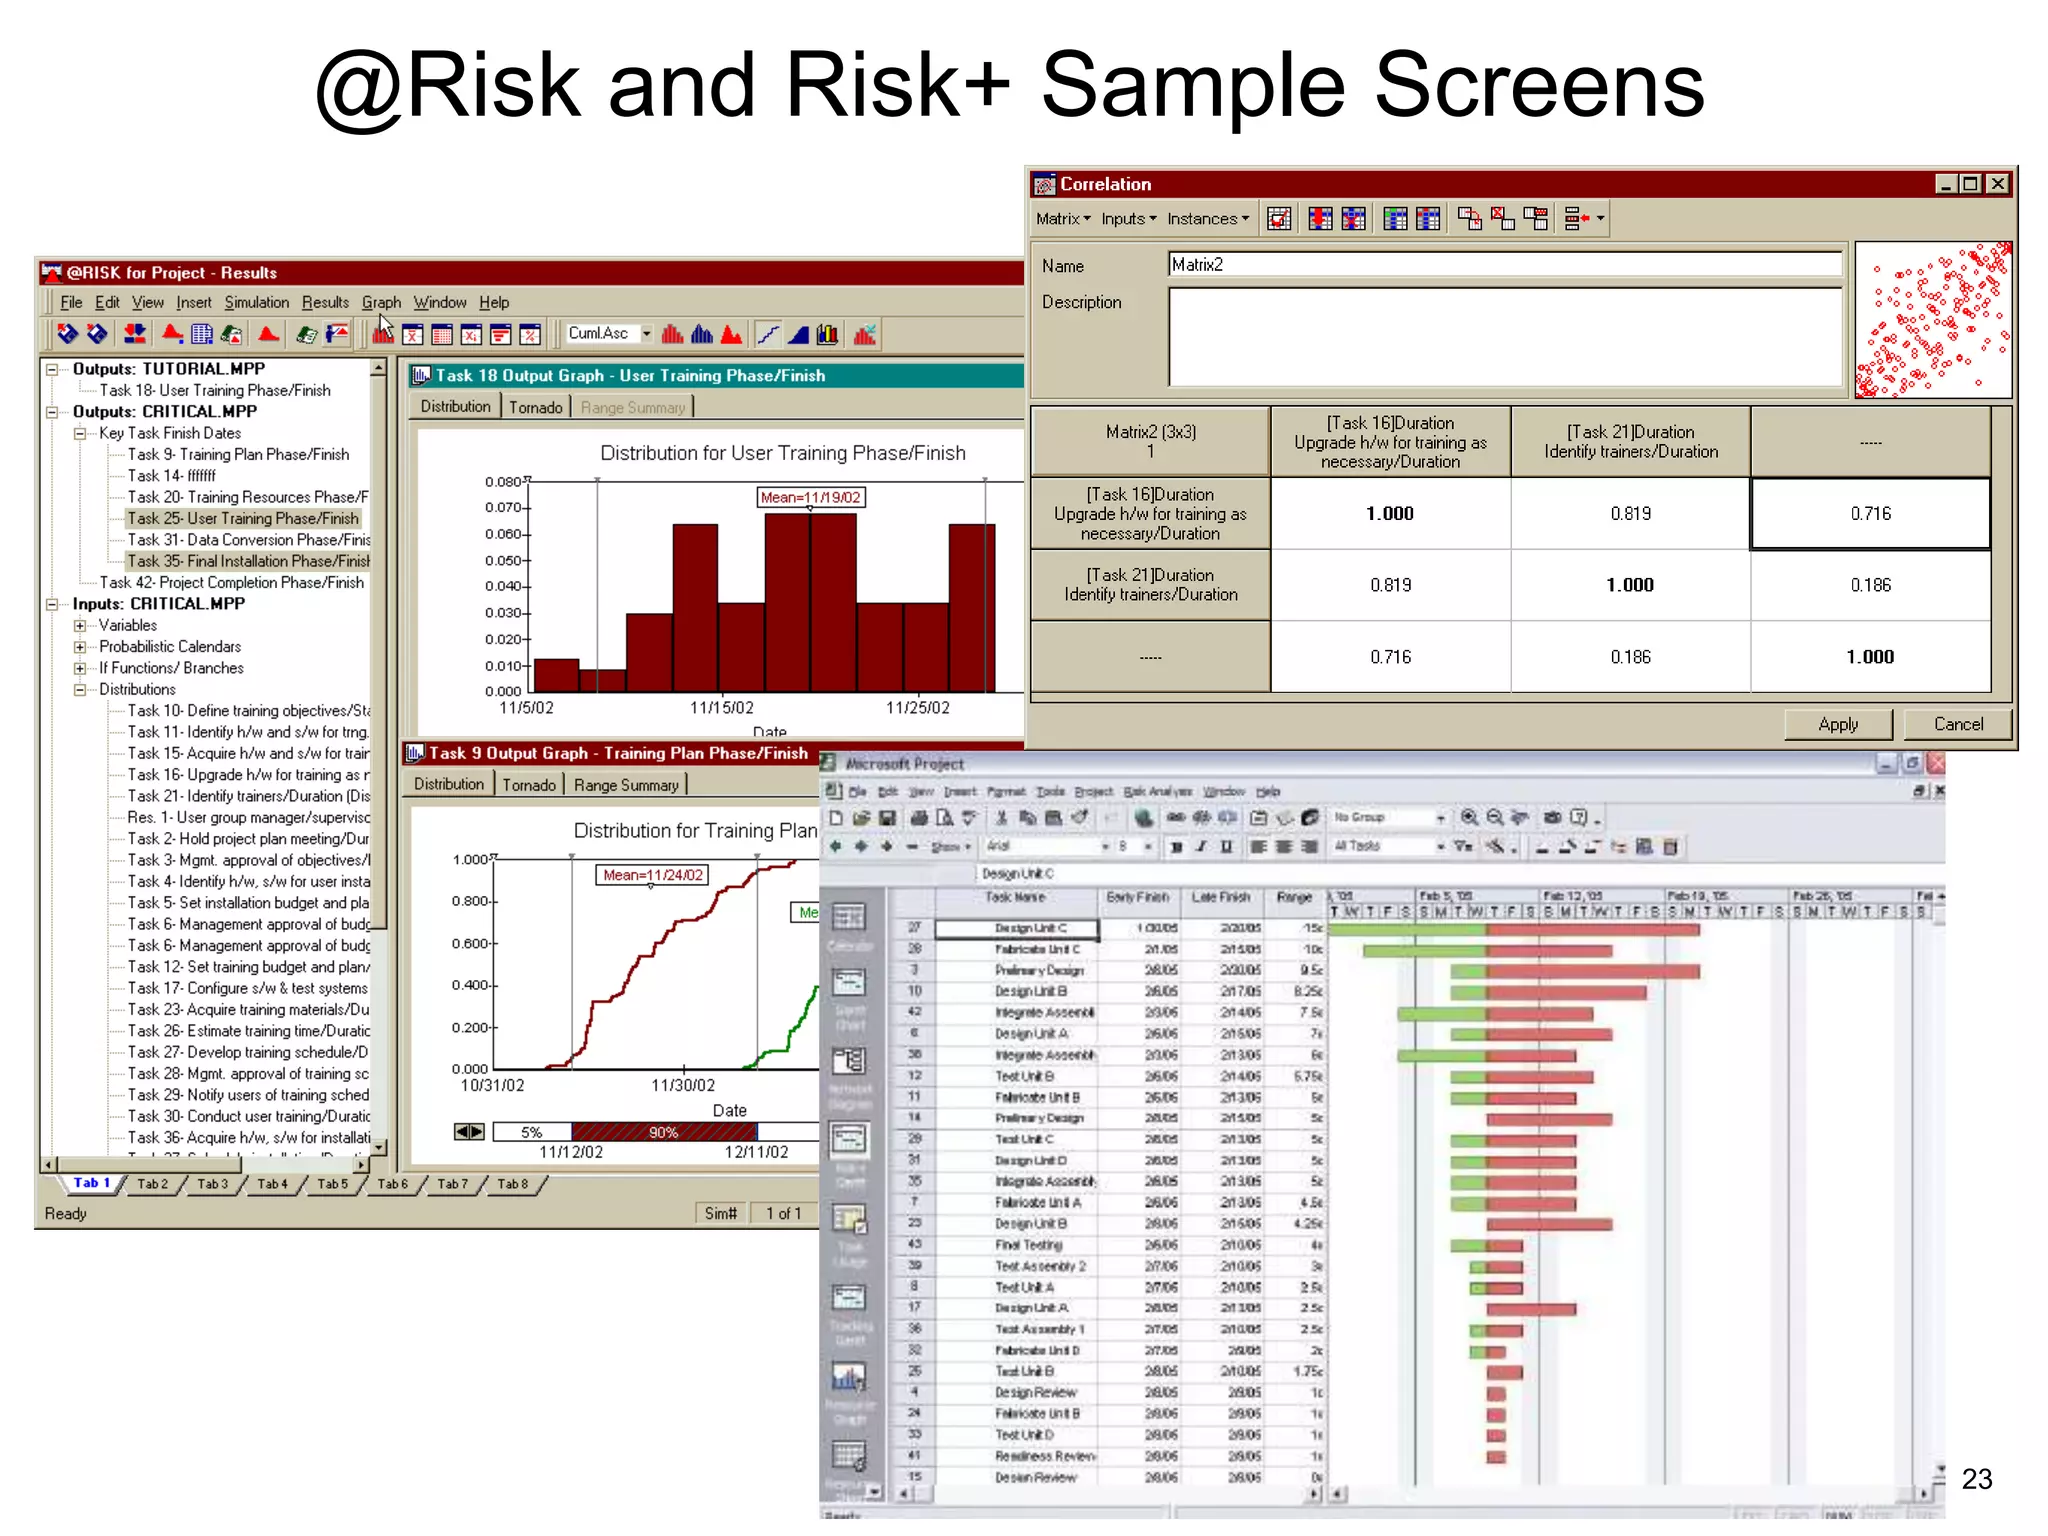
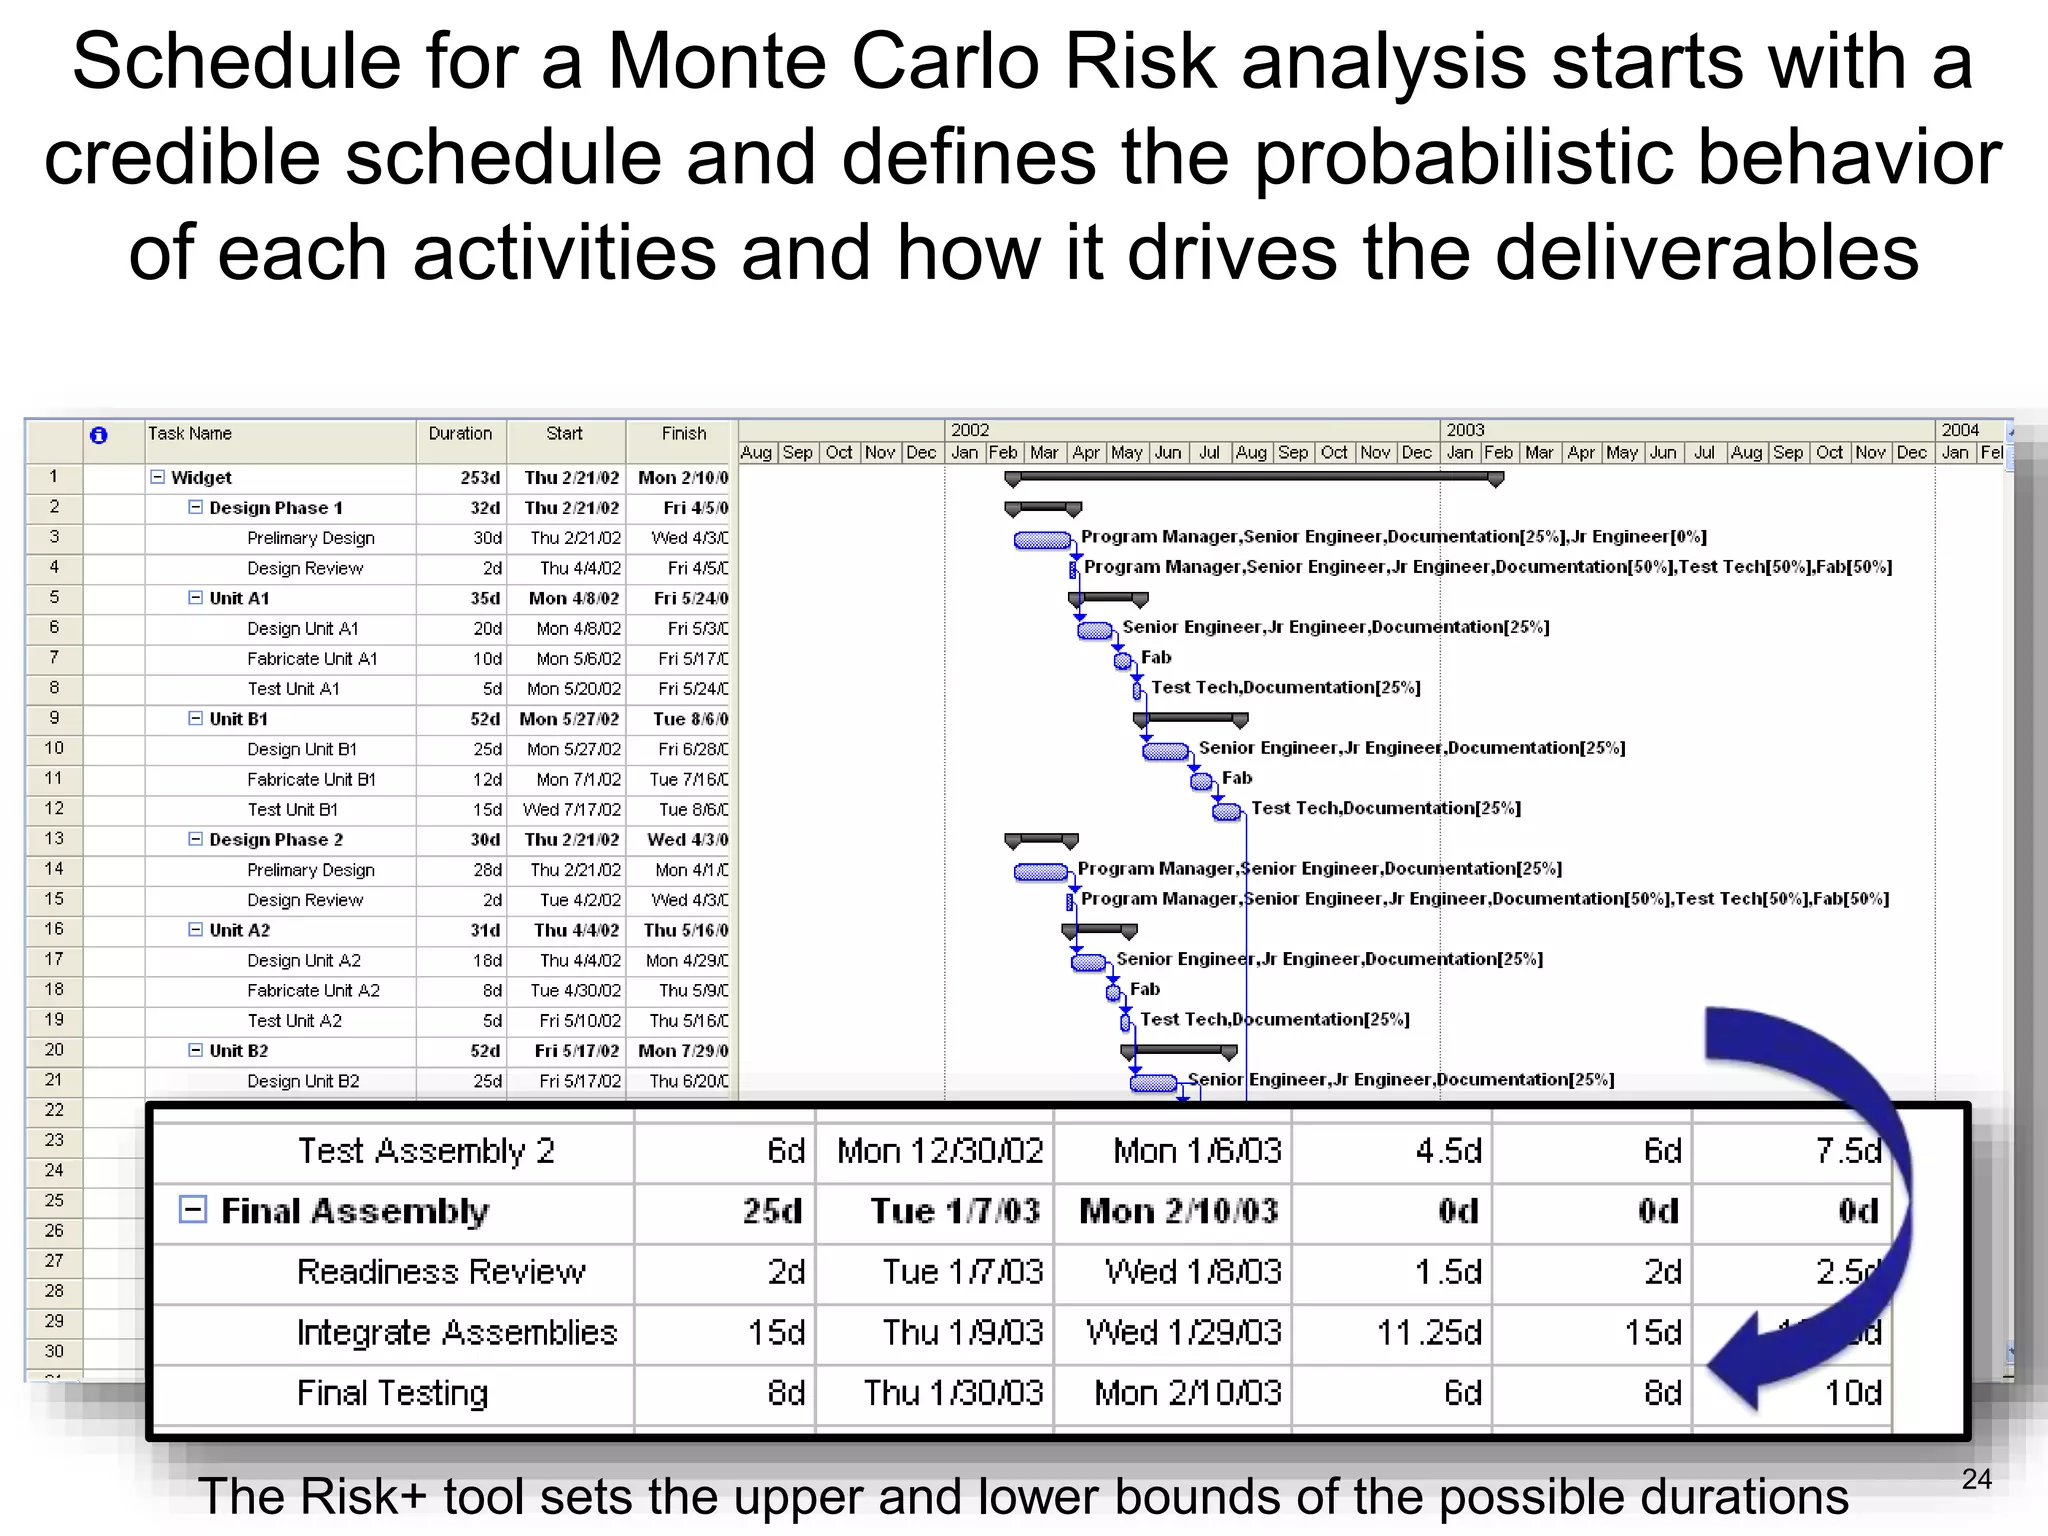
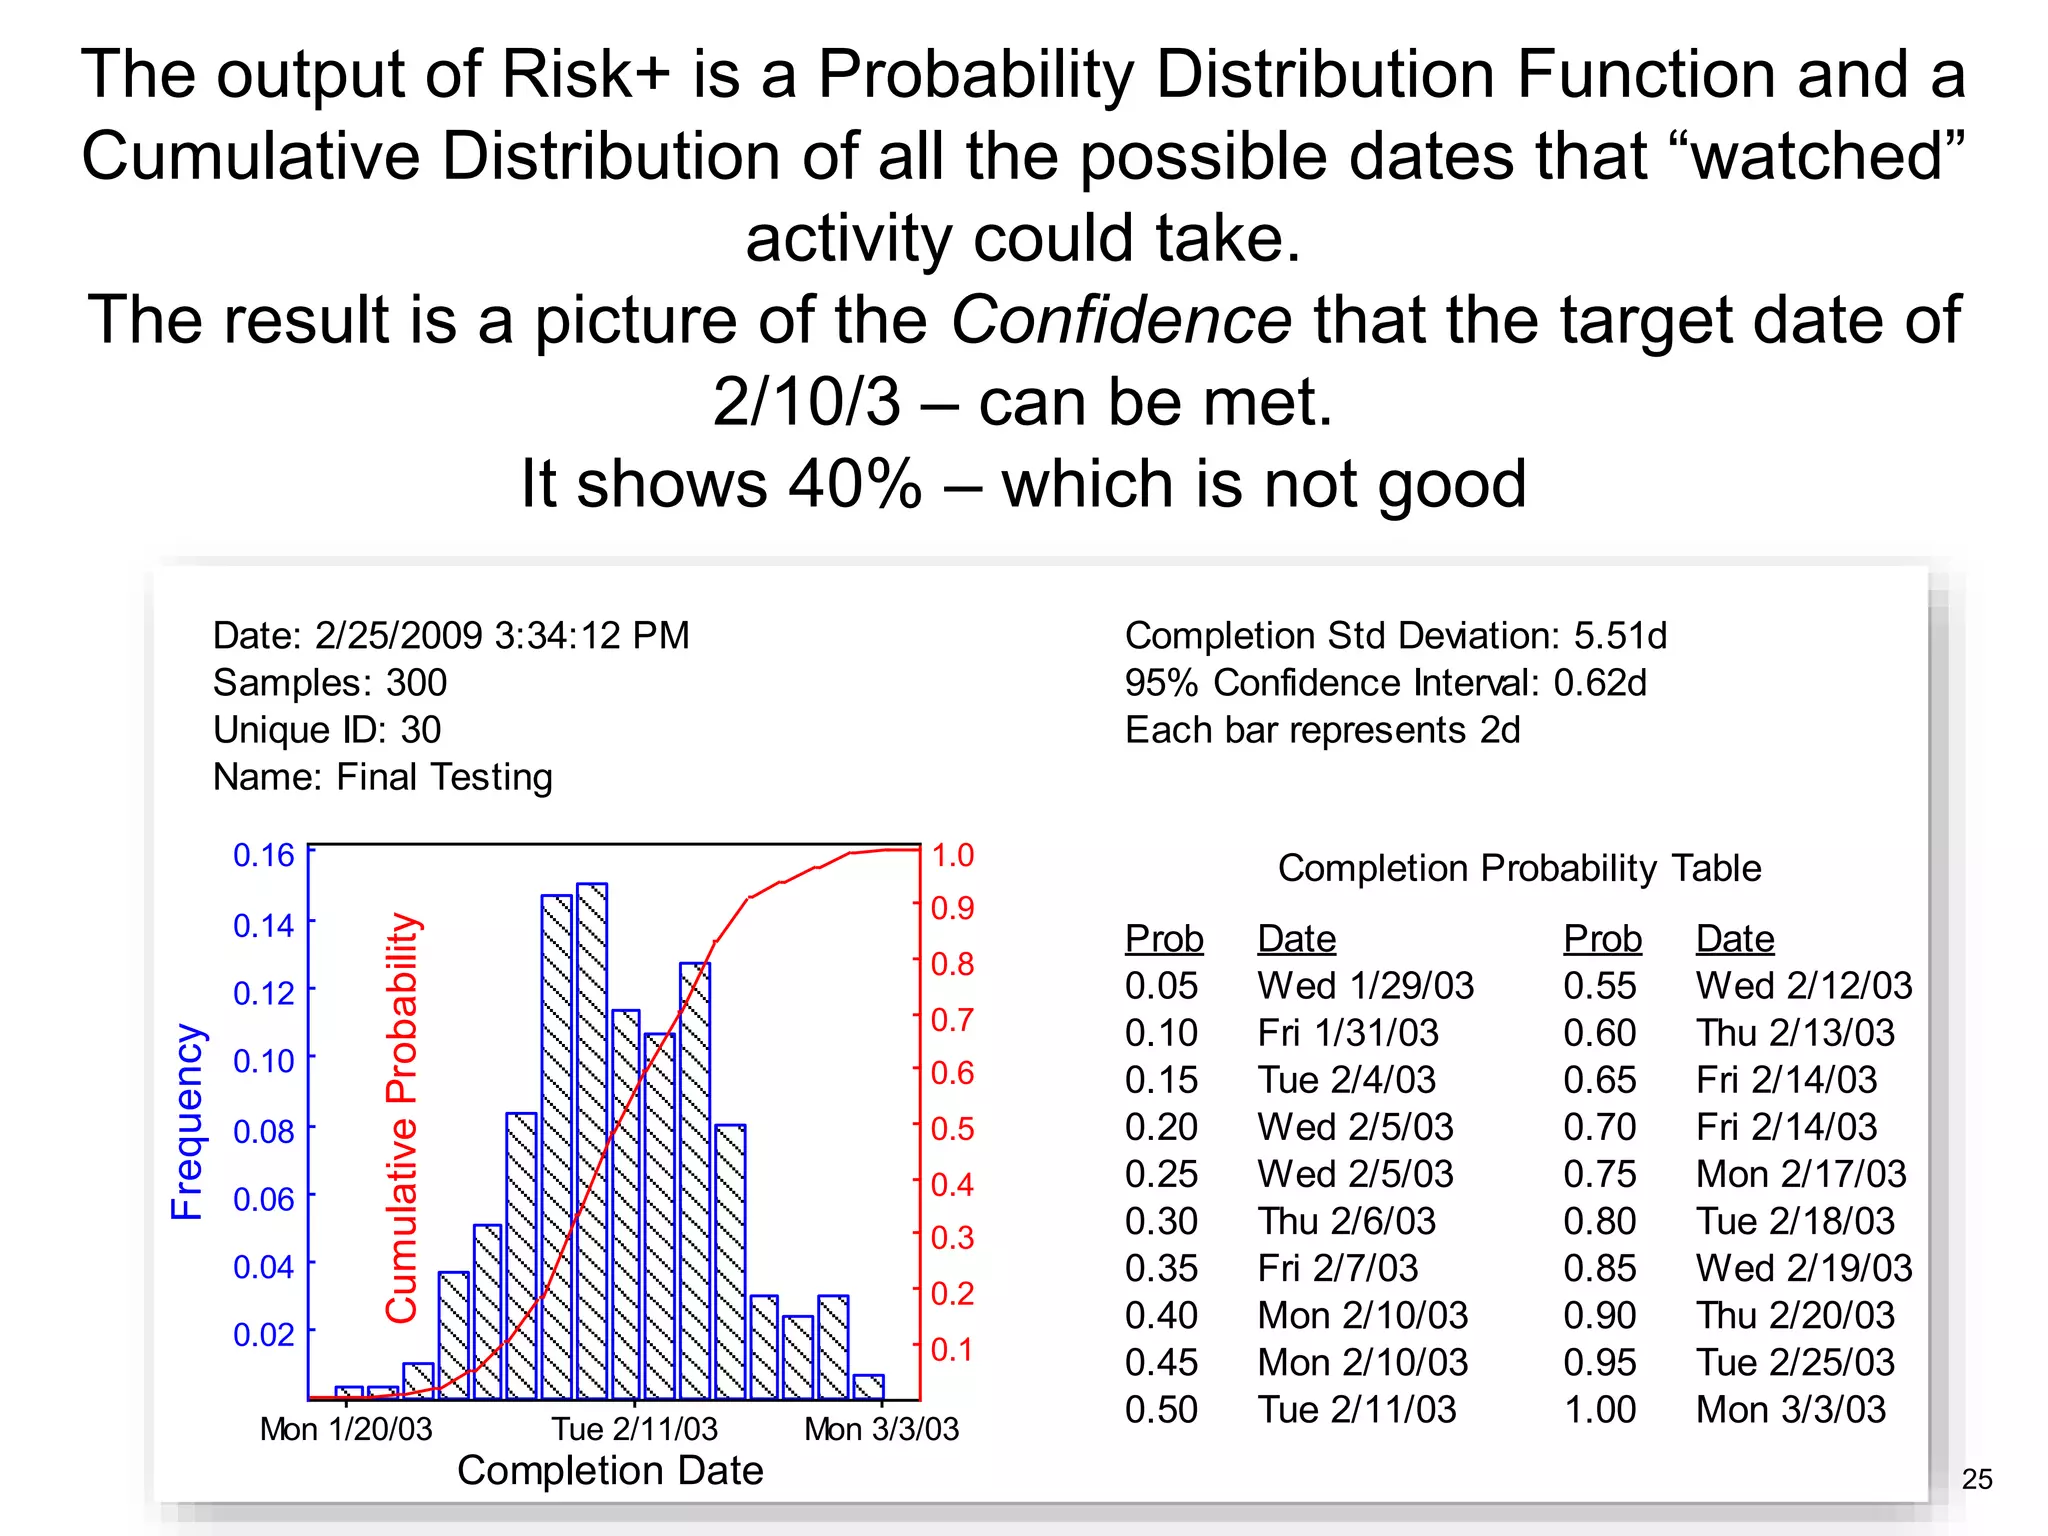
Integrating Risk with Earned Value
Pikes Peak Regional Chapter
Project Management Productivity Tools Symposium
Saturday, February 28th, 2009
Glen B. Alleman
VP, Program Planning and Controls
The notion of integrating cost, schedule, technical
performance, and risk is possible in theory. In practice
care is needed to assure credible information is provided
to the Program Manager.
1
Today's Learning Objectives
 Cost, Schedule, Technical
Performance, and Risk Are
Inseparable
 All numeric values of cost,
schedule, technical
performance, and risk
assessment are random
variables drawn from some
underlying probability
distribution
 Managing these variables
must be done through the
eyes of a Risk Manager 2
There are
usually two
phases to many
projects …
1. Too early to tell
2. Too late to stop
3
Cost
Technical
Performance
Schedule
Funding margin for
under performance
Schedule margin for over
target baseline (OTB)
Schedule margin for
underperformance or
schedule extension
Over cost or
under
performance
Over cost or
over
schedule
Over schedule
or under
performing
Dependencies Between The Inseparable Variables
4
But Many Times, The Information from Cost,
Schedule, Techncial Performance, and Risk
Management Systems Gets Mixed Up When We
Try to Put Them Together
5
EVM Analyst’s EAC Range
• Addresses Risk
• Based on CPI & SPI trend analysis not on
plugging numbers into a formula
• Incorporates technical performance, schedule
progress, CAIV and other program information
EAC Floor Performance Factor
EAC Ceiling Performance Factor
cum
cum cum
BAC BCWP BAC
EAC ACWP
CPI CPI

  
cum
cum cum cum
BAC BCWP BAC
EAC ACWP
CPI SPI CPI

  

Some Useful EV Information
http://www.daytonaero.com/Files/resource/31.pdf
6
Some Criteria for Successful EVMS
Beyond Full Compliance of the 32 Criteria
7
Define a Work
Breakdown
Structure
Identify the
Organizations
doing the work
Integrate WBS
and OBS into a
RAM
Schedule all
Planned Work
Indentify Products
and Milestones
Time Phase the
Budget
Record all Direct
Costs
Determine all
Variances
Sum These
Variances
Manage Action
Plans
Incorporate Changes
At The Same Time, Risk Management is
Commonly Misunderstood
It’s not about random chance, it’s about defining
mitigations and retirement plans in the presence of
uncertainty
8
1. Hope is not a strategy
2. No single point estimate of cost or schedule can be correct
3. Cost, Schedule, and Technical Performance are inseparable
4. Risk management requires adherence to a well defined process
5. Communication is the Number One success factor
Five Fundamental Principles of Risk
Management
9
Define and
Organize the
Work
Establish MR
Issue Budget
Authorize Plan
Establish PMB
Authorize Work
Measure
Performance
Analyze Results
Plan Risk
Activities
Perform Risk
Assessment
Develop Risk
Handling Plans
Assign
Responsibilities
Monitor and
Communicate
Update Risk Register
Revisions & Change Control
I think you
should be more
explicit about
the steps here.
Integrating
Earned Value
and Risk
Management
10
Some Actionable Details For
Putting These Four Concepts
Together
In Theory there is no difference
between Theory and Practice.
In Practice there is — Yogi Berra
11
So much for our strategy of winning
through technical dominance
 There are two types of “uncertainty” on any
sufficiently complex program
– Technical – uncertainty about the functional and
performance aspects of the program’s
technology that impacts the produceability of
the product or creates delays in the schedule
– Programmatic – uncertainty about the duration
and cost of the activities that deliver the
functional and performance elements of the
program, independent of the technical risk
 We’re interested in connecting the two in the schedule and cost
model(s)
– When the technical uncertainty arises what is the impact on the schedule
and cost?
– When the schedule or cost uncertainty arises what is the impact on the
functional and performance aspects?
The Difference Between
Technical and Programmatic
Risk
12
13
Deterministic Versus Probabilistic
Deterministic
• Each activity has a planned value
• For the schedule each task has a
predecessor and a successor.
• The longest path through the
network is the critical path
• The total duration of the project is
a fixed value - it is deterministic
• The total cost is the sum of all the
activity costs
• Risks are defined and handled as
static entities
Probabilistic
• The program elements are not
random, but they are random
variables drawn from a probability
distribution.
• Three point estimates "can" be
used to describe task duration
random variables
• The total duration of the project is
a random number
• The total cost is a random number
• Risks are stochastic processes
that have probabilistic outcomes
for cost, schedule and technical
performance
 Lack of predictive
variance analysis
 Untimely and unrealistic
Latest Revised Estimates
(LRE)
 Progress not monitored
in a regular and
consistent manner
 Lack of vertical and
horizontal traceability
cost and schedule data
for corrective action
 Lack of internal
surveillance and
controls
 Managerial actions not
demonstrated using
Earned Value
 Inattention to
budgetary
responsibilities
 Work authorizations
that are not always
followed
 Issues with Budget and
data reconciliation
 Lack of an integrated
management system
 Baseline fluctuations
and frequent replanning
 Current period and
retroactive changes
 Improper use of
management reserve
 EV techniques that do
not reflect actual
performance
Without these Principles The Program Train Wreck Starts When…
Mary K. Evans Picture Library
14
Continuous Risk Management has Six Components
http://www.sei.cmu.edu/risk/index.html
15
16
This All Comes Together in The Risk
Registry
http://www.mitre.org/work/sepo/toolkits/risk/ToolsTechniques/RiskMatrix.html
17
First, A (Notional) Big Picture
Risk Database
IMS
Containing
the Risk
Activities
Program
Performance
Metrics
Risk ID Traceable to
work elements in the
IMS within the WBS
Risk reduction
waterfall metrics
connected to Earned
Value program
performance
Standard program
performance of TCPI
and IEAC
no·tion·al
1. Of, containing, or being a notion;
mental or imaginary.
2. Speculative or theoretical
18
Modeling Schedule Risk
Cost, Schedule, Technical Model†
WBS
Task 100
Task 101
Task 102
Task 103
Task 104
Task 105
Task 106
† This is a Key concept. This is the part of the process that
integrates the cost and schedule risk impacts to provide the basis
of a credible schedule.
Probability
Density Function
 Research the Project
 Find Analogies
 Ask Endless Questions
 Analyze the Results
 What can go wrong?
 How likely is it to go wrong?
 What is the cause?
 What is the consequence?
Monte Carlo Simulation
Tool is Mandatory
1.0
.8
.6
.4
.2
0
Days, Facilities, Parts, People
Cumulative Distribution Function
Days, Facilities,
Parts and People
19
Modeling Cost Risk
$
Cost Driver (Weight)
Cost = a + bXc
Cost
Estimate
Historical data point
Cost estimating relationship
Standard percent error bounds
Technical Uncertainty
Combined Cost
Modeling and Technical
Uncertainty
Cost Modeling
Uncertainty
20
Modeling Technical Performance
Measures
EV Data
EV Data
21
One Approach to Integrating Risk Management with Earned
Value
Program Manager
Functional Managers
Work Package Managers
Individuals/Team
Members
Identify
Analyze
 Review
 Prioritize
 Evaluate
 Classify
Track
Plan
 Approve plans
 Recommend actions
 Develop plans
Control
 Integrate across
functions
 Reprioritize
 Authorize project
resources
risks
Top N risks Decisions
Assign
Responsibility
Required
Indicators
Trends
Risk Status
Control
 Integrate
 Reprioritize
 Authorize
 Functional area
resources
EV Data
1
3 2
Top N risks
Example Schedule Risk Analysis
Monte Carlo tools model the task durations with random
variables for the durations and build “pictures” of the
likelihood of a task completely on or before a specific
date.
22
@Risk and Risk+ Sample Screens
23
24
Schedule for a Monte Carlo Risk analysis starts with a
credible schedule and defines the probabilistic behavior
of each activities and how it drives the deliverables
The Risk+ tool sets the upper and lower bounds of the possible durations
25
Date: 2/25/2009 3:34:12 PM
Samples: 300
Unique ID: 30
Name: Final Testing
Completion Std Deviation: 5.51d
95% Confidence Interval: 0.62d
Each bar represents 2d
Completion Date
Frequency
CumulativeProbability
Tue 2/11/03Mon 1/20/03 Mon 3/3/03
0.1
0.2
0.3
0.4
0.5
0.6
0.7
0.8
0.9
1.0
0.02
0.04
0.06
0.08
0.10
0.12
0.14
0.16 Completion Probability Table
Prob ProbDate Date
0.05 Wed 1/29/03
0.10 Fri 1/31/03
0.15 Tue 2/4/03
0.20 Wed 2/5/03
0.25 Wed 2/5/03
0.30 Thu 2/6/03
0.35 Fri 2/7/03
0.40 Mon 2/10/03
0.45 Mon 2/10/03
0.50 Tue 2/11/03
0.55 Wed 2/12/03
0.60 Thu 2/13/03
0.65 Fri 2/14/03
0.70 Fri 2/14/03
0.75 Mon 2/17/03
0.80 Tue 2/18/03
0.85 Wed 2/19/03
0.90 Thu 2/20/03
0.95 Tue 2/25/03
1.00 Mon 3/3/03
The output of Risk+ is a Probability Distribution Function and a
Cumulative Distribution of all the possible dates that “watched”
activity could take.
The result is a picture of the Confidence that the target date of
2/10/3 – can be met.
It shows 40% – which is not good
 What cost impact will there be?
 What resource impacts?
 What technical dependencies?
 What mitigation or retirement plans must be in place
to increase the probability of success to something
greater than 40%?
 What other interdependencies are there in the
program?
26
So with this information we can ask
Program Management is Risky Business
Traditional Approaches Are Seriously Flawed
Risk Management Is Not About Preventing Risk
Risk Management Is About Managing In The Presence Of
Risk
This means managing Cost, Schedule, and Technical
Performance
27
 Interfacing Risk & Earned Value: Management Reserve,
 “Technical Performance Measurement, Earned Value, and Risk Management: An
Integrated Diagnostic Tool for Program Management,” Commander N. D. Pisano, SC,
USN, Program Executive Office for Air ASW, Assault, and Special Mission Programs
(PEO(A))
 Practical Risk Management: The ATOM Method, David Hillson and Peter Simon,
Management Concepts.
 Project Risk Analysis and Management Guide, APM Publishing.
 “Formal Risk Management,” DACS Gold Practices
 “Quantify Risk to Manage Cost and Schedule,” Fred Raymond, Acquisition Review
Quarterly, Spring 1999, pp. 147–154
 Probabilistic Risk Assessment Procedures Guide for NASA Managers and Practitioners,
Office of Safety and Mission Assurance, April 2002
 Development Of Risk Management Defense Extensions To The PMI Project
Management Body Of Knowledge – Tutorial,” Edmund Conrow, Acquisition Review
Quarterly, Spring, 2003.
 Effective Risk management: Some Keys to Success, Edmund Conrow, American Institute
of Aeronautics and Astronautics, 2000.
28
Source Materials
29

Integrating risk with earned value

  • 1.
    Integrating Risk withEarned Value Pikes Peak Regional Chapter Project Management Productivity Tools Symposium Saturday, February 28th, 2009 Glen B. Alleman VP, Program Planning and Controls The notion of integrating cost, schedule, technical performance, and risk is possible in theory. In practice care is needed to assure credible information is provided to the Program Manager. 1
  • 2.
    Today's Learning Objectives Cost, Schedule, Technical Performance, and Risk Are Inseparable  All numeric values of cost, schedule, technical performance, and risk assessment are random variables drawn from some underlying probability distribution  Managing these variables must be done through the eyes of a Risk Manager 2
  • 3.
    There are usually two phasesto many projects … 1. Too early to tell 2. Too late to stop 3
  • 4.
    Cost Technical Performance Schedule Funding margin for underperformance Schedule margin for over target baseline (OTB) Schedule margin for underperformance or schedule extension Over cost or under performance Over cost or over schedule Over schedule or under performing Dependencies Between The Inseparable Variables 4
  • 5.
    But Many Times,The Information from Cost, Schedule, Techncial Performance, and Risk Management Systems Gets Mixed Up When We Try to Put Them Together 5
  • 6.
    EVM Analyst’s EACRange • Addresses Risk • Based on CPI & SPI trend analysis not on plugging numbers into a formula • Incorporates technical performance, schedule progress, CAIV and other program information EAC Floor Performance Factor EAC Ceiling Performance Factor cum cum cum BAC BCWP BAC EAC ACWP CPI CPI     cum cum cum cum BAC BCWP BAC EAC ACWP CPI SPI CPI      Some Useful EV Information http://www.daytonaero.com/Files/resource/31.pdf 6
  • 7.
    Some Criteria forSuccessful EVMS Beyond Full Compliance of the 32 Criteria 7 Define a Work Breakdown Structure Identify the Organizations doing the work Integrate WBS and OBS into a RAM Schedule all Planned Work Indentify Products and Milestones Time Phase the Budget Record all Direct Costs Determine all Variances Sum These Variances Manage Action Plans Incorporate Changes
  • 8.
    At The SameTime, Risk Management is Commonly Misunderstood It’s not about random chance, it’s about defining mitigations and retirement plans in the presence of uncertainty 8
  • 9.
    1. Hope isnot a strategy 2. No single point estimate of cost or schedule can be correct 3. Cost, Schedule, and Technical Performance are inseparable 4. Risk management requires adherence to a well defined process 5. Communication is the Number One success factor Five Fundamental Principles of Risk Management 9
  • 10.
    Define and Organize the Work EstablishMR Issue Budget Authorize Plan Establish PMB Authorize Work Measure Performance Analyze Results Plan Risk Activities Perform Risk Assessment Develop Risk Handling Plans Assign Responsibilities Monitor and Communicate Update Risk Register Revisions & Change Control I think you should be more explicit about the steps here. Integrating Earned Value and Risk Management 10
  • 11.
    Some Actionable DetailsFor Putting These Four Concepts Together In Theory there is no difference between Theory and Practice. In Practice there is — Yogi Berra 11
  • 12.
    So much forour strategy of winning through technical dominance  There are two types of “uncertainty” on any sufficiently complex program – Technical – uncertainty about the functional and performance aspects of the program’s technology that impacts the produceability of the product or creates delays in the schedule – Programmatic – uncertainty about the duration and cost of the activities that deliver the functional and performance elements of the program, independent of the technical risk  We’re interested in connecting the two in the schedule and cost model(s) – When the technical uncertainty arises what is the impact on the schedule and cost? – When the schedule or cost uncertainty arises what is the impact on the functional and performance aspects? The Difference Between Technical and Programmatic Risk 12
  • 13.
    13 Deterministic Versus Probabilistic Deterministic •Each activity has a planned value • For the schedule each task has a predecessor and a successor. • The longest path through the network is the critical path • The total duration of the project is a fixed value - it is deterministic • The total cost is the sum of all the activity costs • Risks are defined and handled as static entities Probabilistic • The program elements are not random, but they are random variables drawn from a probability distribution. • Three point estimates "can" be used to describe task duration random variables • The total duration of the project is a random number • The total cost is a random number • Risks are stochastic processes that have probabilistic outcomes for cost, schedule and technical performance
  • 14.
     Lack ofpredictive variance analysis  Untimely and unrealistic Latest Revised Estimates (LRE)  Progress not monitored in a regular and consistent manner  Lack of vertical and horizontal traceability cost and schedule data for corrective action  Lack of internal surveillance and controls  Managerial actions not demonstrated using Earned Value  Inattention to budgetary responsibilities  Work authorizations that are not always followed  Issues with Budget and data reconciliation  Lack of an integrated management system  Baseline fluctuations and frequent replanning  Current period and retroactive changes  Improper use of management reserve  EV techniques that do not reflect actual performance Without these Principles The Program Train Wreck Starts When… Mary K. Evans Picture Library 14
  • 15.
    Continuous Risk Managementhas Six Components http://www.sei.cmu.edu/risk/index.html 15
  • 16.
    16 This All ComesTogether in The Risk Registry http://www.mitre.org/work/sepo/toolkits/risk/ToolsTechniques/RiskMatrix.html
  • 17.
    17 First, A (Notional)Big Picture Risk Database IMS Containing the Risk Activities Program Performance Metrics Risk ID Traceable to work elements in the IMS within the WBS Risk reduction waterfall metrics connected to Earned Value program performance Standard program performance of TCPI and IEAC no·tion·al 1. Of, containing, or being a notion; mental or imaginary. 2. Speculative or theoretical
  • 18.
    18 Modeling Schedule Risk Cost,Schedule, Technical Model† WBS Task 100 Task 101 Task 102 Task 103 Task 104 Task 105 Task 106 † This is a Key concept. This is the part of the process that integrates the cost and schedule risk impacts to provide the basis of a credible schedule. Probability Density Function  Research the Project  Find Analogies  Ask Endless Questions  Analyze the Results  What can go wrong?  How likely is it to go wrong?  What is the cause?  What is the consequence? Monte Carlo Simulation Tool is Mandatory 1.0 .8 .6 .4 .2 0 Days, Facilities, Parts, People Cumulative Distribution Function Days, Facilities, Parts and People
  • 19.
    19 Modeling Cost Risk $ CostDriver (Weight) Cost = a + bXc Cost Estimate Historical data point Cost estimating relationship Standard percent error bounds Technical Uncertainty Combined Cost Modeling and Technical Uncertainty Cost Modeling Uncertainty
  • 20.
  • 21.
    EV Data EV Data 21 OneApproach to Integrating Risk Management with Earned Value Program Manager Functional Managers Work Package Managers Individuals/Team Members Identify Analyze  Review  Prioritize  Evaluate  Classify Track Plan  Approve plans  Recommend actions  Develop plans Control  Integrate across functions  Reprioritize  Authorize project resources risks Top N risks Decisions Assign Responsibility Required Indicators Trends Risk Status Control  Integrate  Reprioritize  Authorize  Functional area resources EV Data 1 3 2 Top N risks
  • 22.
    Example Schedule RiskAnalysis Monte Carlo tools model the task durations with random variables for the durations and build “pictures” of the likelihood of a task completely on or before a specific date. 22
  • 23.
    @Risk and Risk+Sample Screens 23
  • 24.
    24 Schedule for aMonte Carlo Risk analysis starts with a credible schedule and defines the probabilistic behavior of each activities and how it drives the deliverables The Risk+ tool sets the upper and lower bounds of the possible durations
  • 25.
    25 Date: 2/25/2009 3:34:12PM Samples: 300 Unique ID: 30 Name: Final Testing Completion Std Deviation: 5.51d 95% Confidence Interval: 0.62d Each bar represents 2d Completion Date Frequency CumulativeProbability Tue 2/11/03Mon 1/20/03 Mon 3/3/03 0.1 0.2 0.3 0.4 0.5 0.6 0.7 0.8 0.9 1.0 0.02 0.04 0.06 0.08 0.10 0.12 0.14 0.16 Completion Probability Table Prob ProbDate Date 0.05 Wed 1/29/03 0.10 Fri 1/31/03 0.15 Tue 2/4/03 0.20 Wed 2/5/03 0.25 Wed 2/5/03 0.30 Thu 2/6/03 0.35 Fri 2/7/03 0.40 Mon 2/10/03 0.45 Mon 2/10/03 0.50 Tue 2/11/03 0.55 Wed 2/12/03 0.60 Thu 2/13/03 0.65 Fri 2/14/03 0.70 Fri 2/14/03 0.75 Mon 2/17/03 0.80 Tue 2/18/03 0.85 Wed 2/19/03 0.90 Thu 2/20/03 0.95 Tue 2/25/03 1.00 Mon 3/3/03 The output of Risk+ is a Probability Distribution Function and a Cumulative Distribution of all the possible dates that “watched” activity could take. The result is a picture of the Confidence that the target date of 2/10/3 – can be met. It shows 40% – which is not good
  • 26.
     What costimpact will there be?  What resource impacts?  What technical dependencies?  What mitigation or retirement plans must be in place to increase the probability of success to something greater than 40%?  What other interdependencies are there in the program? 26 So with this information we can ask
  • 27.
    Program Management isRisky Business Traditional Approaches Are Seriously Flawed Risk Management Is Not About Preventing Risk Risk Management Is About Managing In The Presence Of Risk This means managing Cost, Schedule, and Technical Performance 27
  • 28.
     Interfacing Risk& Earned Value: Management Reserve,  “Technical Performance Measurement, Earned Value, and Risk Management: An Integrated Diagnostic Tool for Program Management,” Commander N. D. Pisano, SC, USN, Program Executive Office for Air ASW, Assault, and Special Mission Programs (PEO(A))  Practical Risk Management: The ATOM Method, David Hillson and Peter Simon, Management Concepts.  Project Risk Analysis and Management Guide, APM Publishing.  “Formal Risk Management,” DACS Gold Practices  “Quantify Risk to Manage Cost and Schedule,” Fred Raymond, Acquisition Review Quarterly, Spring 1999, pp. 147–154  Probabilistic Risk Assessment Procedures Guide for NASA Managers and Practitioners, Office of Safety and Mission Assurance, April 2002  Development Of Risk Management Defense Extensions To The PMI Project Management Body Of Knowledge – Tutorial,” Edmund Conrow, Acquisition Review Quarterly, Spring, 2003.  Effective Risk management: Some Keys to Success, Edmund Conrow, American Institute of Aeronautics and Astronautics, 2000. 28 Source Materials
  • 29.