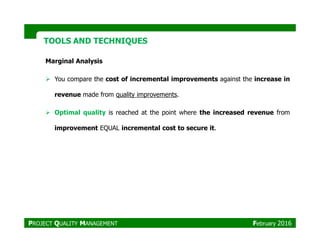
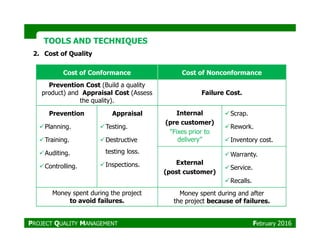
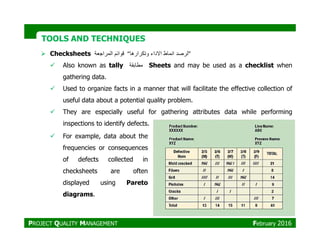
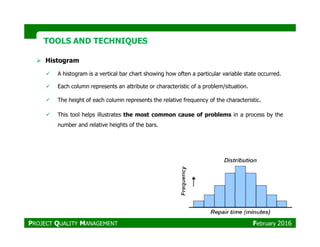
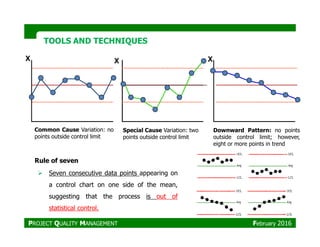
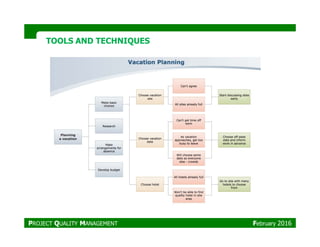
SlideShare a Scribd company logo
1 of 93
Download to read offline
PPROJECTROJECT QQUALITYUALITY
MMANAGEMENTANAGEMENT
Hisham Haridy, PMP, PMI-RMPFebruary 2016
PPROJECTROJECT QQUALITYUALITY
MMANAGEMENTANAGEMENT
Part “Part “11””
February 2016
Quality
Total Quality
Management
QUALITYQUALITY
Inspection
Allocating blame
Quality
Control
Compliance to
specification
Quality
Assurance
Involvement
Management
Continuous
Improvement
PROJECT QUALITY MANAGEMENT February 2016
QUALITYQUALITY
People Materials Environment
Equipment Method
PROJECT QUALITY MANAGEMENT February 2016
What is Quality?What is Quality?
“The degree to which a set of inherent characteristics fulfill
requirements”
OR the degree to which the project fulfills the requirements
Quality and GradeQuality and Grade
Quality Grade
The combination of all of an entity’s
characteristics that enable the satisfaction
of stated or implied needs.
A category or rank given to entities having
the same functional use but different technical
characteristics.
Low quality is always a problem Low grade may NOT be a problem
QualityQuality MUST BEMUST BE planned inplanned in NOTNOT inspected ininspected in
PROJECT QUALITY MANAGEMENT February 2016
Standard Regulation
A document established by consensus and
approved by a recognized body that
provides, for common and repeated use,
Is a government imposed requirement,
which specifies product, process or service
Standard and RegulationStandard and Regulation
provides, for common and repeated use,
rules, guidelines or characteristics for
activities or their results, aimed at
achievement of the optimum degree of order
in a given context
which specifies product, process or service
characteristics, including the applicable
administrative provision, with which compliance
is mandatory.
Example: the size of a computer disk and
the ISO standards.
Example: Building codes
PROJECT QUALITY MANAGEMENT February 2016
Project Management and Quality ManagementProject Management and Quality Management
Similarities Differences
Customer satisfaction: Understanding,
evaluating, defining, and managing
expectations so that customer
requirements are met.
Prevention over inspection: The cost
Focus: Quality Management
systems focus on the entire
organization , while Project Quality
Management per the PMBOK Guide
focuses on projects.
Prevention over inspection: The cost
of avoiding mistakes is much less than
the cost of correcting them
Management responsibility: Success
requires participation of all members of
the team, but it is the responsibility of
management to provide resources
needed.
Continuous Improvement:
Plan/Do/Check/Act cycle.
Management Responsibility:
The project manager has the
ultimate responsibility for the quality
of the product of the project and the
Project Management deliverables,
while Senior Management has the
ultimate responsibility for the quality
in the organization as a whole.
PROJECT QUALITY MANAGEMENT February 2016
Plan Quality Perform Quality
Control Quality
Project Quality Management includes the processes required to ensure that
the project will satisfy the needs for which it was undertaken.
Quality Management
Plan Quality
Management
Perform Quality
Assurance
Control Quality
Quality planning
involves identifying
which quality
standards are
relevant to the
project and
determining how to
satisfy them.
All of the planned and
systematic activities to
ensure that the project will
employ all processes
needed to meet
requirements.
Control quality involves the
monitoring of specific project
results to determine if the results
comply with quality standards,
and based on those results,
identifying ways to eliminate
causes of unsatisfactory results
What is Quality? How
will we ensure it?
Are we following the
standards?
Are we meeting the
standards?
PROJECT QUALITY MANAGEMENT February 2016
Plan Quality Management
Input
Tools and
Techniques
Output
1. Project management plan 1. Cost-benefit analysis 1. Quality management plan
“The process of identifying quality requirements and/or standards for the project and
product, and documenting how the project will demonstrate compliance”
2. Stakeholder register
3. Risk register
4. Requirements
documentation.
5. Enterprise environmental
factors
6. Organizational process
assets
2. Cost of quality
3. Seven basic quality tools
4. Benchmarking
5. Design of experiments
6. Statistical sampling
7. Additional Plan quality tools.
8. Meetings
2. Process improvement plan
3. Quality metrics
4. Quality checklists
5. Project documents updates
The key benefit of this process is that it provides guidance and direction on how quality will be
managed and validated throughout the project.
PROJECT QUALITY MANAGEMENT February 2016
INPUTSINPUTS
1. Project Management Plan
Scope baseline: Scope statement, WBS and WBS dictionary.
Schedule baseline
Cost baseline
Other management plan.
2. Stakeholders Register
The stakeholder register identifies stakeholders with a particular interest in, orThe stakeholder register identifies stakeholders with a particular interest in, or
impact on, quality.
3. Risk Register
The risk register contains information on threats and opportunities that may
impact quality requirements.
4. Requirements Documentation
Requirements documentation captures the requirements that the project shall
meet pertaining to stakeholder expectations. (project and quality requirements).
PROJECT QUALITY MANAGEMENT February 2016
INPUTSINPUTS
5. Enterprise Environmental Factors
Governmental agency regulations, rules, standards, and guidelines specific to the
application area may affect the project.
6. Organizational Process Assets
Organizational quality policies, procedures and guidelines, historical databases
and lessons learned from previous projects specific to the application area may
affect the project.affect the project.
PROJECT QUALITY MANAGEMENT February 2016
TOOLS AND TECHNIQUESTOOLS AND TECHNIQUES
1. Cost-Benefit Analysis
Plan quality must consider cost-benefit trade-offs
Primary benefit of meeting quality requirements is less rework, higher productivity,
lower costs, increased stakeholder satisfaction.
Primary cost = expenses associated with Project Quality Management activities.
Quality can be expensive to achieve.Quality can be expensive to achieve.
No activities should be performed that cost
more (or even the same) as the expected
benefits.
PROJECT QUALITY MANAGEMENT February 2016
The cost of quality should be 3 – 5% .
Cost of non-quality is estimated to be 12 – 20%.
TOOLS AND TECHNIQUESTOOLS AND TECHNIQUES
Marginal Analysis
You compare the cost of incremental improvements against the increase in
revenue made from quality improvements.
Optimal quality is reached at the point where the increased revenue from
PROJECT QUALITY MANAGEMENT February 2016
improvement EQUAL incremental cost to secure it.
2. Cost of Quality
TOOLS AND TECHNIQUESTOOLS AND TECHNIQUES
Cost of Conformance Cost of Nonconformance
Prevention Cost (Build a quality
product) and Appraisal Cost (Assess
the quality).
Failure Cost.
Prevention
Planning.
Appraisal
Testing.
Internal
(pre customer)
Scrap.
Rework.Planning.
Training.
Auditing.
Controlling.
Testing.
Destructive
testing loss.
Inspections.
(pre customer)
“Fixes prior to
delivery”
Rework.
Inventory cost.
External
(post customer)
Warranty.
Service.
Recalls.
Money spent during the project
to avoid failures.
Money spent during and after
the project because of failures.
PROJECT QUALITY MANAGEMENT February 2016
TOOLS AND TECHNIQUESTOOLS AND TECHNIQUES
Cost of Quality before and after TQM
After TQMBefore TQM
PROJECT QUALITY MANAGEMENT February 2016
Cause and Effect Diagram / Ishikawa / Fishbone 1977
Identifying the Likely Causes of Problems..
Professor Kaoru Ishikawa created Cause & Effect Analysis in the 1960s. The technique uses a
diagram-based approach for thinking through all of the possible causes of a problem. This
helps you to carry out a thorough analysis of the situation.
Used to show how different factors relate together and might be tied to potential problems.
TOOLS AND TECHNIQUESTOOLS AND TECHNIQUES
3. Seven Basic Quality Tools
Used to show how different factors relate together and might be tied to potential problems.
Used as part of an approach to improve quality by identifying quality problems and trying to
uncover the underlying cause.
Used to explore the future or the past.
May be used in Plan quality or control.
Try using Cause and Effect Analysis – you'll find that
they are particularly useful when you're trying to
solve complicated problems. For instance, you can
use it to:
Discover the root cause of a problem.
Uncover bottlenecks in your processes.
Identify where and why a process isn't working.
PROJECT QUALITY MANAGEMENT February 2016
TOOLS AND TECHNIQUESTOOLS AND TECHNIQUES
There are four steps to using Cause and Effect Analysis.
1. Identify the problem.
2. Work out the major factors involved.
3. Identify possible causes.
4. Analyze your diagram.
PROJECT QUALITY MANAGEMENT February 2016
TOOLS AND TECHNIQUESTOOLS AND TECHNIQUES
Flow chars (future analysis)
A flowchart shows how a process or system flows from beginning to end and
how the elements interrelate.
It can be used to "see" a process and find potential quality problems.
There are many styles, but all process flowcharts show activities, decision
points, and the order of processing.points, and the order of processing.
During quality planning, flowcharting can help the project team anticipate
quality problems that might occur.
Help analyze how problems occurs
Flowcharts are a tool that can be used in
many parts of project management.
PROJECT QUALITY MANAGEMENT February 2016
TOOLS AND TECHNIQUESTOOLS AND TECHNIQUES
Process Flowchart Example for design reviews
PROJECT QUALITY MANAGEMENT February 2016
Checksheets ‫قوائم‬‫المراجعة‬ “ ‫لرصد‬‫انماط‬‫االداء‬‫وتكرارھا‬ ”
Also known as tally ‫مطابقة‬ Sheets and may be used as a checklist when
gathering data.
Used to organize facts in a manner that will facilitate the effective collection of
useful data about a potential quality problem.
They are especially useful for gathering attributes data while performing
inspections to identify defects.
TOOLS AND TECHNIQUESTOOLS AND TECHNIQUES
inspections to identify defects.
For example, data about the
frequencies or consequences
of defects collected in
checksheets are often
displayed using Pareto
diagrams.
PROJECT QUALITY MANAGEMENT February 2016
Pareto Chart
Specific type of histogram ordered by the frequency of occurrence (how many
defects were generated by type / category of cause)
It graphically prioritizes the causes of process problems (by frequency of occurrence)
to help focus attention on the most critical issues affecting quality.
TOOLS AND TECHNIQUESTOOLS AND TECHNIQUES
Using the 80:20 Rule to Prioritize.
Pareto Analysis is a simple technique for
Pareto Analysis not only shows you the most important
problem to solve, it also gives you a score showing how
severe the problem is.
PROJECT QUALITY MANAGEMENT February 2016
prioritizing problem-solving work so that
the first piece of work you do resolved the
greatest number of problems. It's based
on the Pareto Principle (also known as the
80/20 Rule) – the idea that 80% of
problems may be caused by as few as
20% of causes.
Problem Cause Score (Step
TOOLS AND TECHNIQUESTOOLS AND TECHNIQUES
Steps:
1. Identify and List Problems.
2. Identify the Root Cause of Each Problem.
3. Score Problems.
4. Group Problems Together By Root Cause.
5. Add up the Scores for Each Group.
6. Take Action.
No.
Problem
(Step1)
Cause
(Step 2)
Score (Step
3)
1 Too few service center staff. 15
2 Too few service center staff. 6
3
Poor organization and
preparation.
4
4
Poor organization and
preparation.
2
5 Lack of Training 30
6 Lack of Training 21
PROJECT QUALITY MANAGEMENT February 2016
TOOLS AND TECHNIQUESTOOLS AND TECHNIQUES
Histogram
A histogram is a vertical bar chart showing how often a particular variable state occurred.
Each column represents an attribute or characteristic of a problem/situation.
The height of each column represents the relative frequency of the characteristic.
This tool helps illustrates the most common cause of problems in a process by the
number and relative heights of the bars.number and relative heights of the bars.
PROJECT QUALITY MANAGEMENT February 2016
TOOLS AND TECHNIQUESTOOLS AND TECHNIQUES
Control Chart
Control charts measure the results of processes over time and display the results in
graph form.
Control charts are a way to measure variances to determine whether process variances are
in control or out of control.
A control chart is based on sample variance measurements. From the samples chosen and
measured, the mean and standard deviation are determined.
X
Process Average
UCL
LCL
+ 3σσσσ
- 3σσσσ
Mean
“Upper Control Limit”= Process Average + 3 Standard
Deviations
“Lower Control Limit”= Process Average - 3 Standard
Deviations
PROJECT QUALITY MANAGEMENT February 2016
TOOLS AND TECHNIQUESTOOLS AND TECHNIQUES
X XX
Common Cause Variation: no
points outside control limit
Special Cause Variation: two
points outside control limit
Downward Pattern: no points
outside control limit; however,
eight or more points in trend
Rule of seven
Seven consecutive data points appearing on
a control chart on one side of the mean,
suggesting that the process is out of
statistical control.
PROJECT QUALITY MANAGEMENT February 2016
Statistical TermsStatistical Terms
Average
Value obtained by dividing the sum of a set of quantities by the number of
quantities in the set (arithmetic mean).
Mean Sum of the values divided by the number of values .
Median Middle value of a set of values ordered by rank.
Mode
For lists, the mode is the most common (frequent) value. A list can have more
Mode
than one mode.
Standard Deviation
Standard deviation tells how spread out numbers are from the average,
calculated by taking the square root of the arithmetic average of the squares
of the deviations from the mean in a frequency distribution.
3 Sigma 3 standard deviations.
6 Sigma 6 standard deviations.
PROJECT QUALITY MANAGEMENT February 2016
Statistical TermsStatistical Terms
1. To calculate the standard deviation, first compute the difference of each data point from the
mean, and square the result of each: (15.36-15.40)2= 0.0016, (15.04-15.4)2= 0.1296, …….etc.
2. Next compute the average of these values, and take the square root:
√ (0.0016+0.1296+ ……..etc) = 0.36 then Standard deviation is ± 0.36
9
PROJECT QUALITY MANAGEMENT February 2016
Statistical TermsStatistical Terms
Standard deviation is a statistical calculation used to measure and describe how data is organized.
68.25% of the values will fall within 1σ from the mean.
95.46% of the values will fall within 2σ from the mean.
99.73% of the values will fall within 3σ from the mean.
99.99966% of the values will fall within 6σ from the mean.
PROJECT QUALITY MANAGEMENT February 2016
Statistical TermsStatistical Terms
PROJECT QUALITY MANAGEMENT February 2016
Scatter Diagram
Scatter diagrams use two variables, one called an independent variable, which is an input,
and one called a dependent variable, which is an output.
Scatter diagrams display the relationship between these two elements as points on a graph.
This relationship is typically analyzed to prove or disprove cause-and-effect relationships.
TOOLS AND TECHNIQUESTOOLS AND TECHNIQUES
Powerful tool for spotting trends in data.
The important point to remember about scatter
diagrams is that they plot the dependent and
independent variables, and the closer the points
resemble a diagonal line, the closer these
variables are related.
Powerful tool for spotting trends in data.
PROJECT QUALITY MANAGEMENT February 2016
TOOLS AND TECHNIQUESTOOLS AND TECHNIQUES
PROJECT QUALITY MANAGEMENT February 2016
TOOLS AND TECHNIQUESTOOLS AND TECHNIQUES
4. Benchmarking (past analysis)
Comparing actual or planned project practices to other projects, in order to
generate ideas for improvement and to provide a standard against which to
measure performance.
5. Design of experiments
(what if?)
PROJECT QUALITY MANAGEMENT February 2016
Analytical technique that
helps identify which
variables have the most
influence on the overall
outcome and helps
determine an optimal
solution from a relatively
limited number of cases.
TOOLS AND TECHNIQUESTOOLS AND TECHNIQUES
6. Statistical sampling
Statistical sampling involves choosing part of a population of interest for inspection
(for example, selecting ten engineering drawings at random from a list of seventy-
five).
Sample frequency and sizes should be determined during the Plan Quality
process so the cost of quality will include the number of tests, expected scrap, etc.
PROJECT QUALITY MANAGEMENT February 2016
TOOLS AND TECHNIQUESTOOLS AND TECHNIQUES
7. Additional Plan quality tools
Other quality planning tools are used to define the quality requirements and to
plan effective quality management activities.
1. Brainstorming
2. Force field analysis
3. Nominal group technique
4. Quality management and control tools.
1) Affinity Diagram
2) Process decision program charts (PDPC)
3) Interrelationship digraphs
4) Tree diagrams
5) Prioritization matrices
6) Activity network diagrams
7) Matrix diagrams
PROJECT QUALITY MANAGEMENT February 2016
TOOLS AND TECHNIQUESTOOLS AND TECHNIQUES
1) Brainstorming
‫العصف‬‫الذھني‬
EQUILIBRIUM
RESTRAINING FORCES
PROJECT QUALITY MANAGEMENT February 2016
‫العصف‬‫الذھني‬
DRIVING FORCES
2) Force field analysis
‫تحليل‬‫القوه‬‫الميدانيه‬
3) Nominal group technique
TOOLS AND TECHNIQUESTOOLS AND TECHNIQUES
a. Affinity Diagram c. Interrelationship diagramb. Process decision program
charts (PDPC)
PROJECT QUALITY MANAGEMENT February 2016
e. Prioritization matrices g. Matrix diagramsd. Tree diagrams f. Activity network diagrams
TOOLS AND TECHNIQUESTOOLS AND TECHNIQUES
1. Brainstorming
A technique used to generate and collect multiple ideas related to project and
product requirements.
The common principle of brainstorming is to set aside the restrictive thinking
processes so that many ideas can be generated.
It is a way to reach a consensus of experts on
a subject.
It helps to expose crucial relationships and
patterns in data that may not be initially
apparent.
PROJECT QUALITY MANAGEMENT February 2016
TOOLS AND TECHNIQUESTOOLS AND TECHNIQUES
2. Force field analysis Kurt Lewin (1951)
Identifies the forces and factors that may
influence the problem or goal.
Helps an organization to better understand
promoting or driving and restraining or
inhibiting forces so that the positives can be
EQUILIBRIUM
RESTRAININGFORCES
inhibiting forces so that the positives can be
reinforced and the negatives reduced or
eliminated.
RESTRAININGFORCES
DRIVINGFORCES
PROJECT QUALITY MANAGEMENT February 2016
TOOLS AND TECHNIQUESTOOLS AND TECHNIQUES
Steps:
1. Define the objective.
2. Brainstorm the forces that promote (driving, to be listed on the left) and inhibit (restraining, to
be listed on the right) achieving the goal.
3. Score the forces according to their 'magnitude'.
4. Take action to strengthen the promoting forces and weaken the inhibiting forces (The score
may well not balance on either side).
Restraining forcesDriving forces
PROJECT QUALITY MANAGEMENT February 2016
No Change Change
Restraining forcesDriving forces
Equilibrium
Strength Strength
Capital investment
Fear
Lack of incentives
Lack of training
Increased efficiency
Customer demands
Executive mandate
Trust in unit leader
4
3
5
4
3
7
4
3
16 17
TOOLS AND TECHNIQUESTOOLS AND TECHNIQUES
3. Nominal group technique
This technique enhances brainstorming with a voting process used to rank the
most useful ideas for further brainstorming or for prioritization.
Helps eliminate biases and peer-pressure.
Encourages participation from all team members.
All opinions are heard and weighted equally.
Steps:
1. Team members silently write down ideas
2. Ideas are shared and discussed
3. Team members vote
PROJECT QUALITY MANAGEMENT February 2016
TOOLS AND TECHNIQUESTOOLS AND TECHNIQUES
4. Quality Management and Control Tools:
a. Affinity Diagram ‫مخطط‬‫التقارب‬ Jiro Kawakita, anthropologist , 1960
organizing a large number of ideas, opinions, and facts relating to a broad
problem or subject area.
Steps:
1. State the issue in a full sentence.
PROJECT QUALITY MANAGEMENT February 2016
1. State the issue in a full sentence.
2. Brainstorm using short sentences
on self-adhesive notes.
3. Post them for the team to see.
4. Sort ideas into logical groups.
5. Create concise descriptive
headings for each group.
6. Tidy Up the Affinity Diagram
TOOLS AND TECHNIQUESTOOLS AND TECHNIQUES
PROJECT QUALITY MANAGEMENT February 2016
TOOLS AND TECHNIQUESTOOLS AND TECHNIQUES
b. Process Decision Program Charts (PDPC) ‫مخطط‬‫برنامج‬‫اتخاذ‬‫القرار‬
Used to understand a goal in relation to the steps for getting to the goal.
The PDPC avoids surprises and identifies possible countermeasures.
PDPC is a method for mapping out every conceivable event and contingency that
can occur when moving from a problem statement to possible solutions.
Steps:
1. The team state the objective.
2. That activity is followed by the first level.
3. In some cases a second level of detailed activities may be used.
4. The team brainstorms to determine what could go wrong with the conference, and
these are shown as the “what-if” level.
5. The countermeasures are brainstormed and placed in a balloon in the last level.
6. The last step is to evaluate the countermeasures and select the optimal ones by
placing an O underneath. Place an X under those that are rejected.
PROJECT QUALITY MANAGEMENT February 2016
TOOLS AND TECHNIQUESTOOLS AND TECHNIQUES
PROJECT QUALITY MANAGEMENT February 2016
TOOLS AND TECHNIQUESTOOLS AND TECHNIQUES
c. Interrelationship Digraphs ‫مخطط‬‫العالقات‬‫المتبادلة‬ (ID)
Identifies and explores causal relationships among related concepts or ideas.
It allows the team to classify the cause-and-effect relationships among all
factors so that the key drivers and outcomes can be used to solve the problem.
Steps:
1. The team should agree on the issue or problem statement.
2. All of the ideas or issues from other techniques or from brainstorming should
be laid out.
3. Start with the first issue.
4. The second iteration is to compare other issues.
5. The entire diagram should be reviewed and revised where necessary.
6. The diagram is completed by tallying the incoming and outgoing arrows and
placing this information below the box.
PROJECT QUALITY MANAGEMENT February 2016
TOOLS AND TECHNIQUESTOOLS AND TECHNIQUES
PROJECT QUALITY MANAGEMENT February 2016
TOOLS AND TECHNIQUESTOOLS AND TECHNIQUES
d. Tree Diagrams ‫المخطط‬‫الشجري‬
Maps out the paths and tasks necessary to complete a specific project or
reach a specified goal.
Steps:
1. Choose an action-oriented objective statement from the interrelationship
diagram, affinity diagram, brainstorming, team mission statement.
2. Using brainstorming, choose the major headings.
3. Generate the next level by analyzing the major headings.
4. Repeat this question at each level.
PROJECT QUALITY MANAGEMENT February 2016
TOOLS AND TECHNIQUESTOOLS AND TECHNIQUES
PROJECT QUALITY MANAGEMENT February 2016
TOOLS AND TECHNIQUESTOOLS AND TECHNIQUES
e. Prioritization Matrices ‫مصفوفة‬‫تحديد‬‫األولويات‬
Prioritizes issues, tasks, characteristics, based on weighted criteria using a combination of tree
and matrix diagram techniques.
Once prioritized, effective decision can be made.
Prioritization matrices are designed to reduce the team’s options rationally before
implementation planning occurs.
PROJECT QUALITY MANAGEMENT February 2016
TOOLS AND TECHNIQUESTOOLS AND TECHNIQUES
Steps:
1. Identify the overall objective
2. Gather the people who are to work on the problem.
3. Produce the list of items to be prioritized.
4. Identify a list of criteria which may be used to judge how well each item on the list from step 3
serves the objective from step 1.
5. Allocate a weighting number to each criterion to show their relative importance in achieving the
overall objective.overall objective.
6. Select the actual criteria to use against the list items to be prioritized.
7. Define how the list items from step 3 will be scored against each of the criteria identified in step 6.
8. Score each item against each criterion, using the method identified in step 7.
9. Multiply each score from step 8 by the number allocated to the appropriate criterion in step 5 to get
the weighted score for each item against each criterion.
10.For each item, add up all of the weighted scores from step 8. This gives the final prioritizing score for
each item, as in the figure below.
11.The final list of prioritized items may be made clearer for communication and decision making by
sorting it into priority order and displaying it in a Pareto Chart.
PROJECT QUALITY MANAGEMENT February 2016
TOOLS AND TECHNIQUESTOOLS AND TECHNIQUES
PROJECT QUALITY MANAGEMENT February 2016
Calculating weighting and final score
Building the Prioritization Matrix
TOOLS AND TECHNIQUESTOOLS AND TECHNIQUES
f. Activity Network Diagrams ‫المخطط‬‫الشبكي‬‫لألنشطة‬
Program evaluation and review technique (PERT).
Critical path method (CPM).
Arrow diagram.
Activity on node (AON).
The diagram shows completion times, simultaneous tasks, and critical activity
path.
Steps:
1. The team brainstorms or documents all the task to complete a project.
2. The first task is located and placed on the extreme left of a large view work surface.
3. Any tasks that can be done simultaneously are placed below.
4. Repeat steps 2 and 3 until all tasks are placed in their correct sequence.
5. Number each task and draw connecting arrows.
6. Determine the critical path by completing the four remaining boxes in each task.
PROJECT QUALITY MANAGEMENT February 2016
TOOLS AND TECHNIQUESTOOLS AND TECHNIQUES
PROJECT QUALITY MANAGEMENT February 2016
TOOLS AND TECHNIQUESTOOLS AND TECHNIQUES
g. Matrix Diagrams ‫مخطط‬‫المصفوفة‬
Display relationships between ideas, activities or other dimensions in such a way as to provide
logical connecting points between each item.
Data are presented in table form and can be objective or subjective, which can be given
symbols with or without numerical values.
Steps:Steps:
1. Select the factors affecting a successful plan.
2. Select the appropriate format (depend on the number of variables).
3. Determine the relationship symbols.
PROJECT QUALITY MANAGEMENT February 2016
TOOLS AND TECHNIQUESTOOLS AND TECHNIQUES
PROJECT QUALITY MANAGEMENT February 2016
TOOLS AND TECHNIQUESTOOLS AND TECHNIQUES
7. Meetings
Project teams may hold planning meetings to develop the quality management
plan.
Attendees at these meetings may include the project manager; the project
sponsor; selected project team members; selected stakeholders; anyone with
responsibility for Project Quality Management activities namely Plan Quality
Management, Perform Quality Assurance, or Control Quality; and others as needed.
PROJECT QUALITY MANAGEMENT February 2016
OUTPUTSOUTPUTS
1. Quality management plan (It should be in early stage of project)
The purpose of the Plan Quality process is to determine what quality is and to put
a plan in place to manage quality.
This plan is called the quality management plan. There are many different
examples of quality management plans. Most include the following:
The quality standards that apply to the project.
Who will be involved in managing quality, when, and what their specific duties will be .
Review of earlier decisions to make sure those decisions are correct.
The meetings to be held addressing quality.
The reports that will address quality.
What metrics will be used to measure quality.
What parts of the project or deliverables will be measured and when additional plan
quality tools.
PROJECT QUALITY MANAGEMENT February 2016
OUTPUTSOUTPUTS
2. Process improvement plan
Is a subsidiary of the Project Management Plan that details the steps for analyzing
processes that will facilitate the identification of waste and non-value added
activity, such as:
Process boundaries (purpose, start, end, inputs, outputs, data required, owner and
stakeholder processes)
Process configuration (flowchart of processes to facilitate analysis with interfacesProcess configuration (flowchart of processes to facilitate analysis with interfaces
identified)
Process metrics (maintain control over status of processes)
Targets for improved performance
Deals with how quality activities will be streamlined and improved.
3. Project documents (updates)
Stakeholder register.
Responsibility Assignment Matrix.
PROJECT QUALITY MANAGEMENT February 2016
OUTPUTSOUTPUTS
3. Quality Metrics
Metric = Operational definition that describes in very specific terms, what
something is, and how quality control process measures it.
A measurement is an actual value.
Examples:
Defect density, failure rate, availability, test coverage
What is a variable?
A characteristic to measure.
Example: Size & Shape
What is an attribute?
The measurement
Example: Inches, Meters and Pounds
Defect density, failure rate, availability, test coverage
It is not adequate for the team to say that the system needs to have a rapid
response time. Instead, a quality metric might specify that a system must
respond within two seconds to 99% of all requests up to 1,000 simultaneous
users.
PROJECT QUALITY MANAGEMENT February 2016
OUTPUTSOUTPUTS
4. Quality checklists
A checklist is a Plan quality output put to ensure that all steps were performed, and
that they were performed in the proper sequence.
Establish a common reference for quality management execution.
Are especially effective when developed and improved over several projects.
Checklists are a sample tool that is used to keep from overlooking items of importance.Checklists are a sample tool that is used to keep from overlooking items of importance.
A checklist is really just an instruction sheet for an inspector to use.
The items in the checklist should be significant items.
5. Project Documents Updates
Stakeholder register.
Responsibility assignment matrix.
WBS and WBS Dictionary.
PROJECT QUALITY MANAGEMENT February 2016
Perform Quality Assurance
Input Tools and Techniques Output
1. Quality management plan 1. Plan quality & quality 1. Change requests
The process of auditing the quality requirements and the results from quality
control measurements to ensure appropriate quality standards and operational
definitions are used.
1. Quality management plan
2. Process improvement plan
3. Quality metrics
4. Quality control
measurements
5. Project documents
1. Plan quality & quality
control tools
2. Quality auditsaudits
3. Process analysis
1. Change requests
2. Project management plan
updates
3. Project documents updates
4. Organizational process asset
updates
PROJECT QUALITY MANAGEMENT February 2016
INPUTSINPUTS
1. Quality management plan
Quality management plan: The quality management plan describes how quality
assurance will be performed within the project.
Process improvement plan: The process improvement plan details the steps for
analyzing processes to identify activities which enhance their value.
2. Process improvement plan
The project’s quality assurance activities should be supportive of and consistent
with the performing organization’s process improvement plans.
3. Quality metrics
The quality metrics provide the attributes that should be measured and the
allowable variations.
PROJECT QUALITY MANAGEMENT February 2016
INPUTSINPUTS
4. Quality control measurements.
The quality control measurements can be thought of as a feedback loop.
As changes are evaluated here in the process of Perform Quality Assurance, they
are measured in Perform Quality Control and fed back into this process for
evaluation.
Are the results of the quality control activities that are feedback to QA process
for use in re-evaluating and analyzing the quality standards and processes of the
performing organization.
5. Project documents
Project documents may influence quality assurance work and should be
monitored within the context of a system for configuration management.
PROJECT QUALITY MANAGEMENT February 2016
TOOLS AND TECHNIQUESTOOLS AND TECHNIQUES
1. Plan quality & quality control tools
Tools and techniques from Plan Quality and Perform Quality Control.
2. Quality audits
Audits (Key Tool) review the project to evaluate which activities taking place on
the project should be improved and which meet quality standards
The goal of the audits is both to improve acceptance of the product and theThe goal of the audits is both to improve acceptance of the product and the
overall cost of quality
Structured, independent review to determine whether the project activities
comply with organizational and project policies, processes and procedures
Confirm the implementation of approved change requests, corrective actions,
defect repairs and preventive actions
May be scheduled or at random, may be carried out by in-house or external
auditors
PROJECT QUALITY MANAGEMENT February 2016
3. Process analysis
Follow the steps outlined in the process improvement plan to ensure that it is
working efficiently and effectively.
Examines problems experienced, constraints and non-value added activities
identified during process operation.
TOOLS AND TECHNIQUESTOOLS AND TECHNIQUES
Include: root cause analysis (specific technique to analyze a situation,
determine the underlying causes that lead to it and develop preventive actions
for similar problems).
PROJECT QUALITY MANAGEMENT February 2016
OUTPUTSOUTPUTS
1. Change requests
Change requests are created and used as input into the Perform Integrated Change
Control process to allow full consideration of the recommended improvements.
2. Project management plan updates
Quality management plan,
Schedule management plan, and
Cost management plan.Cost management plan.
3. Project documents updates
Quality audits reports,
Training plans, and
Process documentation.
4. Organizational process asset updates
Elements of the organizational process assets that may be updated include, the
quality standards.
PROJECT QUALITY MANAGEMENT February 2016
Control Quality
Input Tools and Techniques Output
1. Quality management plan
2. Quality metrics
1. Seven basic quality tools
2. Statistical sampling
1. Quality Control
measurements
The process of monitoring and recording results of executing the quality
activities to assess performance and recommend necessary changes.
2. Quality metrics
3. Quality checklists
4. Work performance data
5. Approved change requests
6. Deliverables
7. Project documents
8. Organizational process
assets
2. Statistical sampling
3. Inspection
4. Approved change request
review
measurements
2. Validated changes
3. Verified deliverables
4. Work performance
information
5. Change requests
6. Project management plan
updates
7. Project documents updates
8. Organizational process asset
updates
PROJECT QUALITY MANAGEMENT February 2016
INPUTSINPUTS
1. Quality management plan
Quality management plan
2. Quality metrics
A quality metric describes a project or product attribute and how it will be
measured.
Some examples of quality metrics include: function points, mean time between
failure (MTBF), and mean time to repair (MTTR).failure (MTBF), and mean time to repair (MTTR).
3. Quality checklists
Quality checklists are structured lists that help to verify that the work of the
project and its deliverables fulfill a set of requirements
4. Work performance data
Planned vs. actual technical performance,
Planned vs. actual schedule performance, and
Planned vs. actual cost performance.
PROJECT QUALITY MANAGEMENT February 2016
INPUTSINPUTS
5. Approved change requests
Approved change requests can include modifications such as defect repairs, revised
work methods and revised schedule.
The timely implementation of approved changes needs to be verified.
6. Deliverables
A deliverable is any unique and verifiable product, result, or capability that results in a
validated deliverable required by the project.
7. Project documents
Agreements
Quality audit reports and change logs supported with corrective action plans.
Training plans and assessments of effectiveness.
Process documentation.
8. Organizational process assets
Quality standards and policies.
Standard work guidelines.
Issue and defect reporting procedures and communication policies.
PROJECT QUALITY MANAGEMENT February 2016
1. Seven Basic Quality Tools
1. Cause-and-effect diagrams
2. Flowcharts, which
3. Checksheets
4. Pareto diagrams
5. Histograms
TOOLS AND TECHNIQUESTOOLS AND TECHNIQUES
6. Control charts
7. Scatter diagrams,
PROJECT QUALITY MANAGEMENT February 2016
TOOLS AND TECHNIQUESTOOLS AND TECHNIQUES
2. Statistical sampling
Statistical sampling involves choosing part of a population of interest for inspection
(for example, selecting ten engineering drawings at random from a list of seventy-
five). Sample frequency and sizes should be determined during the Plan Quality
process so the cost of quality will include the number of tests, expected scrap, etc.
3. Inspection
Is the examination of a work product to determine whether it conforms to standardsIs the examination of a work product to determine whether it conforms to standards
Includes measuring, examining and testing
Performed at various points in the project
Intensity level is dependent on the quality plan
Also referred to as reviews, peer reviews, audits and walkthroughs
4. Approved change request review
All approved change requests should be reviewed to verify that they were
implemented as approved.
PROJECT QUALITY MANAGEMENT February 2016
OUTPUTSOUTPUTS
1. Quality Control measurements
The quality control measurements can be thought of as a feedback loop.
As changes are evaluated here in the process of Perform Quality Assurance, they are
measured in Perform Quality Control and fed back into this process for evaluation.
Are the results of the quality control activities that are feedback to QA process for
use in re-evaluating and analyzing the quality standards and processes of the
performing organizationperforming organization
2. Validated changes
Any changed or repaired items are inspected and will be either accepted or rejected
before notification of the decision is provided. Rejected items may require rework.
3. Verified deliverables
A goal of quality control is to determine the correctness of deliverables.
The results of the execution quality control processes are validated deliverables.
Validated deliverables are an input to Verify Scope for formalized acceptance.
PROJECT QUALITY MANAGEMENT February 2016
OUTPUTSOUTPUTS
4. Work Performance Information
Work performance information is the performance data collected from various controlling
processes, analyzed in context and integrated based on relationships across areas.
5. Change requests
If the recommended corrective or preventive actions or a defect repair requires a change to the
project management plan, a change request should be initiated in accordance with the defined
Perform Integrated Change Control process.
6. Project management plan updates
Quality management plan.
Process improvement plan.
7. Project documents updates
Quality standards.
8. Organizational process asset updates
Completed checklists.
Lessons learned documentation.
PROJECT QUALITY MANAGEMENT February 2016
REMEMBERREMEMBER
The project manager should recommend improvements to the performing organization's
standards, policies, and processes. Such recommendations are expected and welcomed by
management.
Quality should be considered whenever there is a change to any component of the project
constraints.
Quality should be checked before an activity or work package is completed.
The project manager must spend time trying to improve quality.
PROJECT QUALITY MANAGEMENT February 2016
The project manager must spend time trying to improve quality.
The project manager must determine metrics to be used to measure quality before the
project work begins.
The project manager MUST put in place a plan for continually improving processes.
The project manager MUST make sure authorized approaches and processes are followed.
Some of the quality activities may be done by a quality assurance or quality control
department.
REMEMBERREMEMBER
Action for ensuring Quality
1. Review the project charter and project scope statement
2. Ask customer what is his definition of quality
3. Identify any quality standards that are applicable to the project
4. Identify the desired levels of performance in the product
5. Identify level of control for the project
PROJECT QUALITY MANAGEMENT February 2016
6. Set standard to reach to that level of performance
7. Decide what will you to ensure processes are followed and standards are met
8. Meetings, reports, measurements, calculations.
9. Perform QA
10. Perform QC
PPROJECTROJECT QQUALITYUALITY
MMANAGEMENTANAGEMENT
Part “2”Part “2”
February 2016
Quality EvolutionQuality Evolution
PROJECT QUALITY MANAGEMENT February 2016
The basic approach to project quality management described in the PMBOK is intended
to be compatible with that of The International Organization for Standardization
(ISO).
For the PMP Exam you need to know the paradigms and absolutes of the main quality
systems and gurus:
1. ISO: it is a quality system standard applicable to any product, service, or process anywhere in
the world
Quality EvolutionQuality Evolution
2. TQM: Total Quality Management Philosophy encourages companies and their employees to focus
on finding ways to continuously improve quality of their business practices and products.
3. Deming: Develop Plan-Do-Check-Act to improve quality, each process should go through these
steps to improve the quality.
4. Joseph Juran: “fitness to use” , Cost of quality is cost of conformance and nonconformance
5. Philip Crosby: “conformance to requirement”, “Zero Defects” “Do it right the first time”.
PROJECT QUALITY MANAGEMENT February 2016
Quality EvolutionQuality Evolution
National Standards Institute (ANSI) represents the United States. ISO 9000 is not a
set of standards for products or services, nor is it specific to any one industry.
Instead, it is a quality system standard applicable to any product, service, or
process anywhere in the world.
The information included in the ISO 9000 series includes:
ISO 9000: This defines the key terms and acts as a road map for the other standards
within the series.within the series.
ISO 9001: This defines the model for a quality system when a contractor demonstrates the
capability to design, produce, and install products or services.
ISO 9002: This is a quality system model for quality assurance in production and
installation.
ISO 9003: This is a quality system model for quality assurance in final inspection and
testing.
ISO 9004: This provides quality management guidelines for any organization wishing to
develop and implement a quality system. Guidelines are also available to determine the
extent to which each quality system model is applicable.
PROJECT QUALITY MANAGEMENT February 2016
Quality EvolutionQuality Evolution
1 2 3 4 5
Becoming
6
Writing a
policy
Defining
Procedures
Following
them
Getting
everyone
else to follow
them
Everyone
wants to
follow them
Becoming
prevention
oriented
continuously
improving
organization
ISO 9000
TOTAL QUALITY MANAGEMENT
PROJECT QUALITY MANAGEMENT February 2016
Quality EvolutionQuality Evolution
Principles of TQM
Customer-oriented
Leadership
Strategic planning
Employee responsibility
Continuous improvement
Cooperation
Statistical methods
Training and education
PROJECT QUALITY MANAGEMENT February 2016
W. Edwards Deming ““Quality is a management problem”
The 14 Points “standard reference for quality transformation”
1. Create a constant purpose toward improvement.
2. Adopt the new philosophy.
3. Stop depending on inspections.
4. Use a single supplier for any one item.
5. Improve constantly and forever.
Continuously improve your systems and processes. Deming promoted the Plan-Do-
Check-Act approach to process analysis and improvement.
Emphasize training and education so everyone can do their jobs better.
Use kaizen as a model to reduce waste and to improve productivity, effectiveness, and
safety.
By improving
quality, companies
will decrease
expenses as well as
increase
productivity and
market share.
“Out of Crisis”
1982
safety.
6. Use training on the job.
7. Implement leadership.
8. Eliminate fear.
9. Break down barriers between departments.
10.Get rid of unclear slogans.
11.Eliminate management by objectives.
12.Remove barriers to pride of workmanship.
13.Implement education and self-improvement.
14.Make "transformation" everyone's job.
Oct.1900 – Dec. 1993
Quality problem (85% management and 15% worker)
PROJECT QUALITY MANAGEMENT February 2016
Dr. Joseph M. Juran (The Father of Quality) ““Fitness for Use”
Quality begins with who, how, and why these customers will use it,
without this information any improvement will be guesswork.
In other words, all improvement activities should be customer focused
Juran’s five attributes for “fitness for use”:
1. Quality of design
2. Quality of conformance (Dec. 1904 – Feb. 2008)
2. Quality of conformance
3. Availability
4. Safety
5. Field use
He development 80/20 principle
Quality is fitness for use.
1Quality Control Handbook, 2Managerial Breakthrough, 3Management of
Quality Control, 4Quality Planning and Analysis, 5Upper Management and
Quality, and 6Juran on Planning for Quality.
Needs of the
customers and
Stakeholders are
defined and then
attempted to
satisfy.
“Quality Control
Handbook 1951”
(Dec. 1904 – Feb. 2008)
PROJECT QUALITY MANAGEMENT February 2016
Philip Crosby ““Zero defects and prevention or rework results ”
Zero defects is a way of thinking and doing that reinforces the
notion that defects are not acceptable, and that everyone should
"do things right the first time".
The idea here is that with a philosophy of zero defects, you can
increase profits both by eliminating the cost of failure and
increasing revenues through increased customer satisfaction.
Defects are not
acceptable, and
that everyone
should "do
things right the
first time“
“Quality is free
1979”
Zero defects is NOT about being perfect. Zero defects is about
changing your perspective. It does this by demanding that you:
1. Recognize the high cost of quality issues.
2. Continuously think of the places where flaws may be
introduced.
3. Work proactively to address the flaws in your systems and
processes, which allow defects to occur.
Quality is conformance to requirements.
Jun.1926 - Aug. 2001
PROJECT QUALITY MANAGEMENT February 2016
Kaizen Philosophy ““Continuous Improvement”
Apply continuous small improvements to reduce costs and ensure consistency.
Kaizen (Ky’zen) is meaning “change for the better” in Japanese.
改改改改
In united Stated and most of Western Europe, improvements are thought of as big improvements.
In Japan, improvements are thought of as small improvements.
PROJECT QUALITY MANAGEMENT February 2016
善善善善
Quality ResearchesQuality Researches
Walter Shewart
In 1920s, developed control charts.
Introduced the term “quality assurance” .
W. Edwards Deming
Developed courses during World War II to teach statistical quality-control techniques to
engineers and executives of companies that were military suppliers.
After the war, began teaching statistical quality control to Japanese companies.
Joseph M. Juran
Followed Deming to Japan in 1954.Followed Deming to Japan in 1954.
Focused on strategic quality planning.
Philip Crosby
In 1979, emphasized that costs of poor quality far outweigh the cost of preventing poor
quality.
In 1984, defined absolutes of quality management — conformance to requirements,
prevention, and “zero defects”.
Kaoru Ishikawa
Promoted use of quality circles.
Developed “fishbone” diagram.
Emphasized importance of internal customer.
PROJECT QUALITY MANAGEMENT February 2016
Quality ResearchesQuality Researches
Deming Juran Crosby Ishikawa
PDCA
(Plan, Do, Check,
Act)
Quality is a
management
problem
TQM
“Total Quality
Management”
Quality is free
Cause and Effect
Fishbone Diagram
(Flowchart)
problem
Poor quality:
85% Management
15% Worker
Fitness for Use Zero defects Design Statistics
Don’t confuse with
80/20
Conformance to
requirements
PROJECT QUALITY MANAGEMENT February 2016
PrecisionAccuracy
A very accurate
measurement is not
necessarily precise.
Precise measurements
are not necessarily
accurate.
Precise and AccuratePrecise and Accurate
Precision Accuracy
Consistency that the value of
repeated measurements are
clustered and have little
scatter
Correctness that the
measured value is very close
to the true value
Precision or Accuracy which one is more important to be determined by the
project management team?
PROJECT QUALITY MANAGEMENT February 2016
Refreshments
Q1: When a product or service completely meets a customer's requirements:
A. Quality is achieved.
B. The cost of quality is high.
C. The cost of quality is low.
D. The customer pays the minimum price.
Q2: To what does the following sentence refer? "The point where the benefits or revenue toQ2: To what does the following sentence refer? "The point where the benefits or revenue to
be received from improving quality equals the incremental cost to achieve that quality."
A. Quality control analysis
B. Marginal analysis
C. Standard quality analysis
D. Conformance analysis
PROJECT QUALITY MANAGEMENT February 2016
Refreshments
Q3: A project manager and team from a firm that designs railroad equipment are tasked to
design a machine to load stone onto railroad cars. The design allows for two percent spillage,
amounting to over two tons of spilled rock per day. In which of the following does the project
manager document quality control, quality assurance, and quality improvements for this
project?project?
A. Quality management plan
B. Quality policy
C. Control charts
D. Project management plan
PROJECT QUALITY MANAGEMENT February 2016
Refreshments
Q4: You are managing a project in a just-in-time environment. This will require more
attention, because the amount of inventory in such an environmental is generally:
A. 45 percent.
B. 10 percent.
C. 12 percent.C. 12 percent.
D. 0 percent.
PROJECT QUALITY MANAGEMENT February 2016
Refreshments
Q5: Work on a project is ongoing when the project manager overhears two workers
arguing over what a set of instructions mean. The project manager investigates and
discovers that the instructions for the construction of the concrete footings currently
being poured were poorly translated between the different languages in use on the
project. Which of the following is the BEST thing for the project manager to do FIRST?project. Which of the following is the BEST thing for the project manager to do FIRST?
A. Get the instructions translated by a more experienced party.
B. Look for quality impacts of the poor translation of the instructions for the footings.
C. Bring the issue to the attention of the team and ask them to look for other translation
problems.
D. Inform the sponsor of the problem in the next project report.
PROJECT QUALITY MANAGEMENT February 2016
THANK YOU
PROJECT QUALITY MANAGEMENT February 2016

More Related Content

What's hot

Project management process and Project Management Knowledge areas
Project management process and Project Management Knowledge areasProject management process and Project Management Knowledge areas
Project management process and Project Management Knowledge areasMazen Zbib
 
Project quality management - PMI PMBOK Knowledge Area
Project quality management - PMI PMBOK Knowledge AreaProject quality management - PMI PMBOK Knowledge Area
Project quality management - PMI PMBOK Knowledge AreaImran Jamil
 
8.0 Project Quality Management Overview
8.0 Project Quality Management Overview8.0 Project Quality Management Overview
8.0 Project Quality Management OverviewDavidMcLachlan1
 
Project Quality Management
 Project Quality Management Project Quality Management
Project Quality ManagementSerdar Temiz
 
Introduction to Project Management
Introduction to Project ManagementIntroduction to Project Management
Introduction to Project ManagementWaleed Elnaggar
 
Introduction to Project Management
Introduction to Project ManagementIntroduction to Project Management
Introduction to Project ManagementSlav Karaslavov
 
Project Quality Management - PMBOK
Project Quality Management - PMBOKProject Quality Management - PMBOK
Project Quality Management - PMBOKArief Rahmana
 
Project Quality Control
Project Quality ControlProject Quality Control
Project Quality ControlSheetal Narkar
 
Project Management and Process
Project Management and ProcessProject Management and Process
Project Management and ProcessMuhammad Rehman
 
Project management
Project managementProject management
Project managementJay Raval
 
2.project lifecycle
2.project lifecycle2.project lifecycle
2.project lifecyclerlabsza
 
Project Management
Project ManagementProject Management
Project Managementajithsrc
 
Smart project management - Best Practices to Manage Project effectively
Smart project management - Best Practices to Manage Project effectivelySmart project management - Best Practices to Manage Project effectively
Smart project management - Best Practices to Manage Project effectivelyChetan Khanzode
 
Project Quality Management | Project Quality Control | Edureka
Project Quality Management | Project Quality Control | EdurekaProject Quality Management | Project Quality Control | Edureka
Project Quality Management | Project Quality Control | EdurekaEdureka!
 
Project Quality Management PPT.pptx
Project Quality Management PPT.pptxProject Quality Management PPT.pptx
Project Quality Management PPT.pptxZiyad Zaidi
 
Project Control- Overview Presentation Tafseer
Project Control- Overview Presentation   TafseerProject Control- Overview Presentation   Tafseer
Project Control- Overview Presentation TafseerKishan Solankimbaccepmp
 

What's hot (20)

Project quality management
Project quality managementProject quality management
Project quality management
 
Project management
Project managementProject management
Project management
 
Project management process and Project Management Knowledge areas
Project management process and Project Management Knowledge areasProject management process and Project Management Knowledge areas
Project management process and Project Management Knowledge areas
 
Project quality management.ppt msm
Project quality management.ppt msmProject quality management.ppt msm
Project quality management.ppt msm
 
Project quality management - PMI PMBOK Knowledge Area
Project quality management - PMI PMBOK Knowledge AreaProject quality management - PMI PMBOK Knowledge Area
Project quality management - PMI PMBOK Knowledge Area
 
8.0 Project Quality Management Overview
8.0 Project Quality Management Overview8.0 Project Quality Management Overview
8.0 Project Quality Management Overview
 
Project Quality Management
 Project Quality Management Project Quality Management
Project Quality Management
 
Introduction to Project Management
Introduction to Project ManagementIntroduction to Project Management
Introduction to Project Management
 
Introduction to Project Management
Introduction to Project ManagementIntroduction to Project Management
Introduction to Project Management
 
Project Quality Management - PMBOK
Project Quality Management - PMBOKProject Quality Management - PMBOK
Project Quality Management - PMBOK
 
Project Quality Control
Project Quality ControlProject Quality Control
Project Quality Control
 
Project Management Tools and Techniques
Project Management Tools and TechniquesProject Management Tools and Techniques
Project Management Tools and Techniques
 
Project Management and Process
Project Management and ProcessProject Management and Process
Project Management and Process
 
Project management
Project managementProject management
Project management
 
2.project lifecycle
2.project lifecycle2.project lifecycle
2.project lifecycle
 
Project Management
Project ManagementProject Management
Project Management
 
Smart project management - Best Practices to Manage Project effectively
Smart project management - Best Practices to Manage Project effectivelySmart project management - Best Practices to Manage Project effectively
Smart project management - Best Practices to Manage Project effectively
 
Project Quality Management | Project Quality Control | Edureka
Project Quality Management | Project Quality Control | EdurekaProject Quality Management | Project Quality Control | Edureka
Project Quality Management | Project Quality Control | Edureka
 
Project Quality Management PPT.pptx
Project Quality Management PPT.pptxProject Quality Management PPT.pptx
Project Quality Management PPT.pptx
 
Project Control- Overview Presentation Tafseer
Project Control- Overview Presentation   TafseerProject Control- Overview Presentation   Tafseer
Project Control- Overview Presentation Tafseer
 

Viewers also liked

Pmbok 4th edition chapter 8 - Project Quality Management
Pmbok 4th edition   chapter 8 - Project Quality Management Pmbok 4th edition   chapter 8 - Project Quality Management
Pmbok 4th edition chapter 8 - Project Quality Management Ahmad Maharma, PMP,RMP
 

Viewers also liked (17)

Pmbok 4th edition chapter 8 - Project Quality Management
Pmbok 4th edition   chapter 8 - Project Quality Management Pmbok 4th edition   chapter 8 - Project Quality Management
Pmbok 4th edition chapter 8 - Project Quality Management
 
CCP_SEC3_Planning and Scheduling
CCP_SEC3_Planning and SchedulingCCP_SEC3_Planning and Scheduling
CCP_SEC3_Planning and Scheduling
 
PMP_Project Human Resources Management
PMP_Project Human Resources ManagementPMP_Project Human Resources Management
PMP_Project Human Resources Management
 
CCP_SEC2_ Cost Estimating
CCP_SEC2_ Cost EstimatingCCP_SEC2_ Cost Estimating
CCP_SEC2_ Cost Estimating
 
1_PMI-RMP_Project Risk Management Plan
1_PMI-RMP_Project Risk Management Plan1_PMI-RMP_Project Risk Management Plan
1_PMI-RMP_Project Risk Management Plan
 
CCP_SEC4_Progress and Cost Control
CCP_SEC4_Progress and Cost ControlCCP_SEC4_Progress and Cost Control
CCP_SEC4_Progress and Cost Control
 
PMP_Economic Selection Criteria
PMP_Economic Selection CriteriaPMP_Economic Selection Criteria
PMP_Economic Selection Criteria
 
CCP_SEC5_ Project Management
CCP_SEC5_ Project ManagementCCP_SEC5_ Project Management
CCP_SEC5_ Project Management
 
PMP_Professional and Social Responsibility
PMP_Professional and Social ResponsibilityPMP_Professional and Social Responsibility
PMP_Professional and Social Responsibility
 
PMP_Project Integration Management
PMP_Project Integration ManagementPMP_Project Integration Management
PMP_Project Integration Management
 
PMP_Project Cost Management
PMP_Project Cost ManagementPMP_Project Cost Management
PMP_Project Cost Management
 
CCP_SEC6_Economic Analysis Statistics and Probability and Risk
CCP_SEC6_Economic Analysis Statistics and Probability and RiskCCP_SEC6_Economic Analysis Statistics and Probability and Risk
CCP_SEC6_Economic Analysis Statistics and Probability and Risk
 
PMP_Project Stakeholder Management
PMP_Project Stakeholder ManagementPMP_Project Stakeholder Management
PMP_Project Stakeholder Management
 
PMP_Project Procurement Management
PMP_Project Procurement ManagementPMP_Project Procurement Management
PMP_Project Procurement Management
 
PMP_Project Time Management
PMP_Project Time ManagementPMP_Project Time Management
PMP_Project Time Management
 
PMP_Project Risk Management
PMP_Project Risk ManagementPMP_Project Risk Management
PMP_Project Risk Management
 
PMP_Project Communication Management
PMP_Project Communication ManagementPMP_Project Communication Management
PMP_Project Communication Management
 

Similar to PQM Plan Quality

PROJECT QUALITY MANAGEMENT.pptx
PROJECT QUALITY MANAGEMENT.pptxPROJECT QUALITY MANAGEMENT.pptx
PROJECT QUALITY MANAGEMENT.pptxSuzyTharwat1
 
Construction quality management plan (Construction Productivity Analysis)
Construction quality management plan (Construction Productivity Analysis)Construction quality management plan (Construction Productivity Analysis)
Construction quality management plan (Construction Productivity Analysis)Jayson Narito
 
PROJECT QUALITY MANAGEMENT for Project.ppt
PROJECT QUALITY MANAGEMENT for Project.pptPROJECT QUALITY MANAGEMENT for Project.ppt
PROJECT QUALITY MANAGEMENT for Project.pptAhtashamArshad4
 
PROJECT QUALITY KNOLEDGE AREA.ppt
PROJECT QUALITY KNOLEDGE    AREA.pptPROJECT QUALITY KNOLEDGE    AREA.ppt
PROJECT QUALITY KNOLEDGE AREA.pptRandolphRodrigues2
 
Quality assurance
Quality assuranceQuality assurance
Quality assuranceSahil Shah
 
2.08 quality management 1
2.08 quality management 12.08 quality management 1
2.08 quality management 1reddvise
 
Quality Management
Quality ManagementQuality Management
Quality ManagementBuchiri
 
Quality Mangt
Quality MangtQuality Mangt
Quality Mangtajithsrc
 
Quality management in construction
Quality management in constructionQuality management in construction
Quality management in constructionIsidro Sid Calayag
 
Project Quality Management
Project Quality ManagementProject Quality Management
Project Quality Managementmzedan
 
Project Quality Management powerpoint
Project Quality Management powerpointProject Quality Management powerpoint
Project Quality Management powerpointDjamadaMuhamedKAGUSU
 
Quality management slides
Quality management slidesQuality management slides
Quality management slidesSaba Afaq
 
Plan_QualityManagement
Plan_QualityManagementPlan_QualityManagement
Plan_QualityManagementFahad Saleem
 
Project quality management
Project quality managementProject quality management
Project quality managementsyeda zoya mehdi
 
What is software quality management
What is software quality managementWhat is software quality management
What is software quality managementselinasimpson321
 

Similar to PQM Plan Quality (20)

PROJECT QUALITY MANAGEMENT.pptx
PROJECT QUALITY MANAGEMENT.pptxPROJECT QUALITY MANAGEMENT.pptx
PROJECT QUALITY MANAGEMENT.pptx
 
Construction quality management plan (Construction Productivity Analysis)
Construction quality management plan (Construction Productivity Analysis)Construction quality management plan (Construction Productivity Analysis)
Construction quality management plan (Construction Productivity Analysis)
 
Project managment 7
Project managment  7Project managment  7
Project managment 7
 
PROJECT QUALITY MANAGEMENT for Project.ppt
PROJECT QUALITY MANAGEMENT for Project.pptPROJECT QUALITY MANAGEMENT for Project.ppt
PROJECT QUALITY MANAGEMENT for Project.ppt
 
PROJECT QUALITY KNOLEDGE AREA.ppt
PROJECT QUALITY KNOLEDGE    AREA.pptPROJECT QUALITY KNOLEDGE    AREA.ppt
PROJECT QUALITY KNOLEDGE AREA.ppt
 
Quality assurance
Quality assuranceQuality assurance
Quality assurance
 
2.08 quality management 1
2.08 quality management 12.08 quality management 1
2.08 quality management 1
 
Quality Management
Quality ManagementQuality Management
Quality Management
 
Ch27
Ch27Ch27
Ch27
 
Quality Mangt
Quality MangtQuality Mangt
Quality Mangt
 
5) PQM.pptx
5) PQM.pptx5) PQM.pptx
5) PQM.pptx
 
Quality management in construction
Quality management in constructionQuality management in construction
Quality management in construction
 
Project Quality Management
Project Quality ManagementProject Quality Management
Project Quality Management
 
Project Quality Management powerpoint
Project Quality Management powerpointProject Quality Management powerpoint
Project Quality Management powerpoint
 
Quality management slides
Quality management slidesQuality management slides
Quality management slides
 
Plan_QualityManagement
Plan_QualityManagementPlan_QualityManagement
Plan_QualityManagement
 
Quality management forms
Quality management formsQuality management forms
Quality management forms
 
Project quality management
Project quality managementProject quality management
Project quality management
 
Pmb
PmbPmb
Pmb
 
What is software quality management
What is software quality managementWhat is software quality management
What is software quality management
 

More from Hisham Haridy MBA, PMP®, RMP®, SP® (8)

Implication of economic conditions in changing project objectives (how to ada...
Implication of economic conditions in changing project objectives (how to ada...Implication of economic conditions in changing project objectives (how to ada...
Implication of economic conditions in changing project objectives (how to ada...
 
Implication of economic conditions in changing project objectives
Implication of economic conditions in changing project objectivesImplication of economic conditions in changing project objectives
Implication of economic conditions in changing project objectives
 
Practical project risk management implementation challenges in saudi arabia
Practical project risk management implementation challenges in saudi arabiaPractical project risk management implementation challenges in saudi arabia
Practical project risk management implementation challenges in saudi arabia
 
2_Project Scope Management
2_Project Scope Management2_Project Scope Management
2_Project Scope Management
 
1_Project Management Foundation
1_Project Management Foundation1_Project Management Foundation
1_Project Management Foundation
 
ERM overview
ERM overviewERM overview
ERM overview
 
CCP_SEC1_Cost
CCP_SEC1_CostCCP_SEC1_Cost
CCP_SEC1_Cost
 
CCP_introduction
CCP_introductionCCP_introduction
CCP_introduction
 

Recently uploaded

VIP Kolkata Call Girl Rajarhat 👉 8250192130 Available With Room
VIP Kolkata Call Girl Rajarhat 👉 8250192130  Available With RoomVIP Kolkata Call Girl Rajarhat 👉 8250192130  Available With Room
VIP Kolkata Call Girl Rajarhat 👉 8250192130 Available With Roomdivyansh0kumar0
 
LPC Operations Review PowerPoint | Operations Review
LPC Operations Review PowerPoint | Operations ReviewLPC Operations Review PowerPoint | Operations Review
LPC Operations Review PowerPoint | Operations Reviewthomas851723
 
ANIn Gurugram April 2024 |Can Agile and AI work together? by Pramodkumar Shri...
ANIn Gurugram April 2024 |Can Agile and AI work together? by Pramodkumar Shri...ANIn Gurugram April 2024 |Can Agile and AI work together? by Pramodkumar Shri...
ANIn Gurugram April 2024 |Can Agile and AI work together? by Pramodkumar Shri...AgileNetwork
 
Reflecting, turning experience into insight
Reflecting, turning experience into insightReflecting, turning experience into insight
Reflecting, turning experience into insightWayne Abrahams
 
Pooja Mehta 9167673311, Trusted Call Girls In NAVI MUMBAI Cash On Payment , V...
Pooja Mehta 9167673311, Trusted Call Girls In NAVI MUMBAI Cash On Payment , V...Pooja Mehta 9167673311, Trusted Call Girls In NAVI MUMBAI Cash On Payment , V...
Pooja Mehta 9167673311, Trusted Call Girls In NAVI MUMBAI Cash On Payment , V...Pooja Nehwal
 
Fifteenth Finance Commission Presentation
Fifteenth Finance Commission PresentationFifteenth Finance Commission Presentation
Fifteenth Finance Commission Presentationmintusiprd
 
原版1:1复刻密西西比大学毕业证Mississippi毕业证留信学历认证
原版1:1复刻密西西比大学毕业证Mississippi毕业证留信学历认证原版1:1复刻密西西比大学毕业证Mississippi毕业证留信学历认证
原版1:1复刻密西西比大学毕业证Mississippi毕业证留信学历认证jdkhjh
 
LPC Warehouse Management System For Clients In The Business Sector
LPC Warehouse Management System For Clients In The Business SectorLPC Warehouse Management System For Clients In The Business Sector
LPC Warehouse Management System For Clients In The Business Sectorthomas851723
 
Farmer Representative Organization in Lucknow | Rashtriya Kisan Manch
Farmer Representative Organization in Lucknow | Rashtriya Kisan ManchFarmer Representative Organization in Lucknow | Rashtriya Kisan Manch
Farmer Representative Organization in Lucknow | Rashtriya Kisan ManchRashtriya Kisan Manch
 
Board Diversity Initiaive Launch Presentation
Board Diversity Initiaive Launch PresentationBoard Diversity Initiaive Launch Presentation
Board Diversity Initiaive Launch Presentationcraig524401
 
Unlocking Productivity and Personal Growth through the Importance-Urgency Matrix
Unlocking Productivity and Personal Growth through the Importance-Urgency MatrixUnlocking Productivity and Personal Growth through the Importance-Urgency Matrix
Unlocking Productivity and Personal Growth through the Importance-Urgency MatrixCIToolkit
 
Call Us🔝⇛+91-97111🔝47426 Call In girls Munirka (DELHI)
Call Us🔝⇛+91-97111🔝47426 Call In girls Munirka (DELHI)Call Us🔝⇛+91-97111🔝47426 Call In girls Munirka (DELHI)
Call Us🔝⇛+91-97111🔝47426 Call In girls Munirka (DELHI)jennyeacort
 
Beyond the Five Whys: Exploring the Hierarchical Causes with the Why-Why Diagram
Beyond the Five Whys: Exploring the Hierarchical Causes with the Why-Why DiagramBeyond the Five Whys: Exploring the Hierarchical Causes with the Why-Why Diagram
Beyond the Five Whys: Exploring the Hierarchical Causes with the Why-Why DiagramCIToolkit
 
Simplifying Complexity: How the Four-Field Matrix Reshapes Thinking
Simplifying Complexity: How the Four-Field Matrix Reshapes ThinkingSimplifying Complexity: How the Four-Field Matrix Reshapes Thinking
Simplifying Complexity: How the Four-Field Matrix Reshapes ThinkingCIToolkit
 
Measuring True Process Yield using Robust Yield Metrics
Measuring True Process Yield using Robust Yield MetricsMeasuring True Process Yield using Robust Yield Metrics
Measuring True Process Yield using Robust Yield MetricsCIToolkit
 
Introduction to LPC - Facility Design And Re-Engineering
Introduction to LPC - Facility Design And Re-EngineeringIntroduction to LPC - Facility Design And Re-Engineering
Introduction to LPC - Facility Design And Re-Engineeringthomas851723
 

Recently uploaded (17)

VIP Kolkata Call Girl Rajarhat 👉 8250192130 Available With Room
VIP Kolkata Call Girl Rajarhat 👉 8250192130  Available With RoomVIP Kolkata Call Girl Rajarhat 👉 8250192130  Available With Room
VIP Kolkata Call Girl Rajarhat 👉 8250192130 Available With Room
 
sauth delhi call girls in Defence Colony🔝 9953056974 🔝 escort Service
sauth delhi call girls in Defence Colony🔝 9953056974 🔝 escort Servicesauth delhi call girls in Defence Colony🔝 9953056974 🔝 escort Service
sauth delhi call girls in Defence Colony🔝 9953056974 🔝 escort Service
 
LPC Operations Review PowerPoint | Operations Review
LPC Operations Review PowerPoint | Operations ReviewLPC Operations Review PowerPoint | Operations Review
LPC Operations Review PowerPoint | Operations Review
 
ANIn Gurugram April 2024 |Can Agile and AI work together? by Pramodkumar Shri...
ANIn Gurugram April 2024 |Can Agile and AI work together? by Pramodkumar Shri...ANIn Gurugram April 2024 |Can Agile and AI work together? by Pramodkumar Shri...
ANIn Gurugram April 2024 |Can Agile and AI work together? by Pramodkumar Shri...
 
Reflecting, turning experience into insight
Reflecting, turning experience into insightReflecting, turning experience into insight
Reflecting, turning experience into insight
 
Pooja Mehta 9167673311, Trusted Call Girls In NAVI MUMBAI Cash On Payment , V...
Pooja Mehta 9167673311, Trusted Call Girls In NAVI MUMBAI Cash On Payment , V...Pooja Mehta 9167673311, Trusted Call Girls In NAVI MUMBAI Cash On Payment , V...
Pooja Mehta 9167673311, Trusted Call Girls In NAVI MUMBAI Cash On Payment , V...
 
Fifteenth Finance Commission Presentation
Fifteenth Finance Commission PresentationFifteenth Finance Commission Presentation
Fifteenth Finance Commission Presentation
 
原版1:1复刻密西西比大学毕业证Mississippi毕业证留信学历认证
原版1:1复刻密西西比大学毕业证Mississippi毕业证留信学历认证原版1:1复刻密西西比大学毕业证Mississippi毕业证留信学历认证
原版1:1复刻密西西比大学毕业证Mississippi毕业证留信学历认证
 
LPC Warehouse Management System For Clients In The Business Sector
LPC Warehouse Management System For Clients In The Business SectorLPC Warehouse Management System For Clients In The Business Sector
LPC Warehouse Management System For Clients In The Business Sector
 
Farmer Representative Organization in Lucknow | Rashtriya Kisan Manch
Farmer Representative Organization in Lucknow | Rashtriya Kisan ManchFarmer Representative Organization in Lucknow | Rashtriya Kisan Manch
Farmer Representative Organization in Lucknow | Rashtriya Kisan Manch
 
Board Diversity Initiaive Launch Presentation
Board Diversity Initiaive Launch PresentationBoard Diversity Initiaive Launch Presentation
Board Diversity Initiaive Launch Presentation
 
Unlocking Productivity and Personal Growth through the Importance-Urgency Matrix
Unlocking Productivity and Personal Growth through the Importance-Urgency MatrixUnlocking Productivity and Personal Growth through the Importance-Urgency Matrix
Unlocking Productivity and Personal Growth through the Importance-Urgency Matrix
 
Call Us🔝⇛+91-97111🔝47426 Call In girls Munirka (DELHI)
Call Us🔝⇛+91-97111🔝47426 Call In girls Munirka (DELHI)Call Us🔝⇛+91-97111🔝47426 Call In girls Munirka (DELHI)
Call Us🔝⇛+91-97111🔝47426 Call In girls Munirka (DELHI)
 
Beyond the Five Whys: Exploring the Hierarchical Causes with the Why-Why Diagram
Beyond the Five Whys: Exploring the Hierarchical Causes with the Why-Why DiagramBeyond the Five Whys: Exploring the Hierarchical Causes with the Why-Why Diagram
Beyond the Five Whys: Exploring the Hierarchical Causes with the Why-Why Diagram
 
Simplifying Complexity: How the Four-Field Matrix Reshapes Thinking
Simplifying Complexity: How the Four-Field Matrix Reshapes ThinkingSimplifying Complexity: How the Four-Field Matrix Reshapes Thinking
Simplifying Complexity: How the Four-Field Matrix Reshapes Thinking
 
Measuring True Process Yield using Robust Yield Metrics
Measuring True Process Yield using Robust Yield MetricsMeasuring True Process Yield using Robust Yield Metrics
Measuring True Process Yield using Robust Yield Metrics
 
Introduction to LPC - Facility Design And Re-Engineering
Introduction to LPC - Facility Design And Re-EngineeringIntroduction to LPC - Facility Design And Re-Engineering
Introduction to LPC - Facility Design And Re-Engineering
 

PQM Plan Quality

  • 3. Quality Total Quality Management QUALITYQUALITY Inspection Allocating blame Quality Control Compliance to specification Quality Assurance Involvement Management Continuous Improvement PROJECT QUALITY MANAGEMENT February 2016
  • 4. QUALITYQUALITY People Materials Environment Equipment Method PROJECT QUALITY MANAGEMENT February 2016
  • 5. What is Quality?What is Quality? “The degree to which a set of inherent characteristics fulfill requirements” OR the degree to which the project fulfills the requirements Quality and GradeQuality and Grade Quality Grade The combination of all of an entity’s characteristics that enable the satisfaction of stated or implied needs. A category or rank given to entities having the same functional use but different technical characteristics. Low quality is always a problem Low grade may NOT be a problem QualityQuality MUST BEMUST BE planned inplanned in NOTNOT inspected ininspected in PROJECT QUALITY MANAGEMENT February 2016
  • 6. Standard Regulation A document established by consensus and approved by a recognized body that provides, for common and repeated use, Is a government imposed requirement, which specifies product, process or service Standard and RegulationStandard and Regulation provides, for common and repeated use, rules, guidelines or characteristics for activities or their results, aimed at achievement of the optimum degree of order in a given context which specifies product, process or service characteristics, including the applicable administrative provision, with which compliance is mandatory. Example: the size of a computer disk and the ISO standards. Example: Building codes PROJECT QUALITY MANAGEMENT February 2016
  • 7. Project Management and Quality ManagementProject Management and Quality Management Similarities Differences Customer satisfaction: Understanding, evaluating, defining, and managing expectations so that customer requirements are met. Prevention over inspection: The cost Focus: Quality Management systems focus on the entire organization , while Project Quality Management per the PMBOK Guide focuses on projects. Prevention over inspection: The cost of avoiding mistakes is much less than the cost of correcting them Management responsibility: Success requires participation of all members of the team, but it is the responsibility of management to provide resources needed. Continuous Improvement: Plan/Do/Check/Act cycle. Management Responsibility: The project manager has the ultimate responsibility for the quality of the product of the project and the Project Management deliverables, while Senior Management has the ultimate responsibility for the quality in the organization as a whole. PROJECT QUALITY MANAGEMENT February 2016
  • 8. Plan Quality Perform Quality Control Quality Project Quality Management includes the processes required to ensure that the project will satisfy the needs for which it was undertaken. Quality Management Plan Quality Management Perform Quality Assurance Control Quality Quality planning involves identifying which quality standards are relevant to the project and determining how to satisfy them. All of the planned and systematic activities to ensure that the project will employ all processes needed to meet requirements. Control quality involves the monitoring of specific project results to determine if the results comply with quality standards, and based on those results, identifying ways to eliminate causes of unsatisfactory results What is Quality? How will we ensure it? Are we following the standards? Are we meeting the standards? PROJECT QUALITY MANAGEMENT February 2016
  • 9. Plan Quality Management Input Tools and Techniques Output 1. Project management plan 1. Cost-benefit analysis 1. Quality management plan “The process of identifying quality requirements and/or standards for the project and product, and documenting how the project will demonstrate compliance” 2. Stakeholder register 3. Risk register 4. Requirements documentation. 5. Enterprise environmental factors 6. Organizational process assets 2. Cost of quality 3. Seven basic quality tools 4. Benchmarking 5. Design of experiments 6. Statistical sampling 7. Additional Plan quality tools. 8. Meetings 2. Process improvement plan 3. Quality metrics 4. Quality checklists 5. Project documents updates The key benefit of this process is that it provides guidance and direction on how quality will be managed and validated throughout the project. PROJECT QUALITY MANAGEMENT February 2016
  • 10. INPUTSINPUTS 1. Project Management Plan Scope baseline: Scope statement, WBS and WBS dictionary. Schedule baseline Cost baseline Other management plan. 2. Stakeholders Register The stakeholder register identifies stakeholders with a particular interest in, orThe stakeholder register identifies stakeholders with a particular interest in, or impact on, quality. 3. Risk Register The risk register contains information on threats and opportunities that may impact quality requirements. 4. Requirements Documentation Requirements documentation captures the requirements that the project shall meet pertaining to stakeholder expectations. (project and quality requirements). PROJECT QUALITY MANAGEMENT February 2016
  • 11. INPUTSINPUTS 5. Enterprise Environmental Factors Governmental agency regulations, rules, standards, and guidelines specific to the application area may affect the project. 6. Organizational Process Assets Organizational quality policies, procedures and guidelines, historical databases and lessons learned from previous projects specific to the application area may affect the project.affect the project. PROJECT QUALITY MANAGEMENT February 2016
  • 12. TOOLS AND TECHNIQUESTOOLS AND TECHNIQUES 1. Cost-Benefit Analysis Plan quality must consider cost-benefit trade-offs Primary benefit of meeting quality requirements is less rework, higher productivity, lower costs, increased stakeholder satisfaction. Primary cost = expenses associated with Project Quality Management activities. Quality can be expensive to achieve.Quality can be expensive to achieve. No activities should be performed that cost more (or even the same) as the expected benefits. PROJECT QUALITY MANAGEMENT February 2016 The cost of quality should be 3 – 5% . Cost of non-quality is estimated to be 12 – 20%.
  • 13. TOOLS AND TECHNIQUESTOOLS AND TECHNIQUES Marginal Analysis You compare the cost of incremental improvements against the increase in revenue made from quality improvements. Optimal quality is reached at the point where the increased revenue from PROJECT QUALITY MANAGEMENT February 2016 improvement EQUAL incremental cost to secure it.
  • 14. 2. Cost of Quality TOOLS AND TECHNIQUESTOOLS AND TECHNIQUES Cost of Conformance Cost of Nonconformance Prevention Cost (Build a quality product) and Appraisal Cost (Assess the quality). Failure Cost. Prevention Planning. Appraisal Testing. Internal (pre customer) Scrap. Rework.Planning. Training. Auditing. Controlling. Testing. Destructive testing loss. Inspections. (pre customer) “Fixes prior to delivery” Rework. Inventory cost. External (post customer) Warranty. Service. Recalls. Money spent during the project to avoid failures. Money spent during and after the project because of failures. PROJECT QUALITY MANAGEMENT February 2016
  • 15. TOOLS AND TECHNIQUESTOOLS AND TECHNIQUES Cost of Quality before and after TQM After TQMBefore TQM PROJECT QUALITY MANAGEMENT February 2016
  • 16. Cause and Effect Diagram / Ishikawa / Fishbone 1977 Identifying the Likely Causes of Problems.. Professor Kaoru Ishikawa created Cause & Effect Analysis in the 1960s. The technique uses a diagram-based approach for thinking through all of the possible causes of a problem. This helps you to carry out a thorough analysis of the situation. Used to show how different factors relate together and might be tied to potential problems. TOOLS AND TECHNIQUESTOOLS AND TECHNIQUES 3. Seven Basic Quality Tools Used to show how different factors relate together and might be tied to potential problems. Used as part of an approach to improve quality by identifying quality problems and trying to uncover the underlying cause. Used to explore the future or the past. May be used in Plan quality or control. Try using Cause and Effect Analysis – you'll find that they are particularly useful when you're trying to solve complicated problems. For instance, you can use it to: Discover the root cause of a problem. Uncover bottlenecks in your processes. Identify where and why a process isn't working. PROJECT QUALITY MANAGEMENT February 2016
  • 17. TOOLS AND TECHNIQUESTOOLS AND TECHNIQUES There are four steps to using Cause and Effect Analysis. 1. Identify the problem. 2. Work out the major factors involved. 3. Identify possible causes. 4. Analyze your diagram. PROJECT QUALITY MANAGEMENT February 2016
  • 18. TOOLS AND TECHNIQUESTOOLS AND TECHNIQUES Flow chars (future analysis) A flowchart shows how a process or system flows from beginning to end and how the elements interrelate. It can be used to "see" a process and find potential quality problems. There are many styles, but all process flowcharts show activities, decision points, and the order of processing.points, and the order of processing. During quality planning, flowcharting can help the project team anticipate quality problems that might occur. Help analyze how problems occurs Flowcharts are a tool that can be used in many parts of project management. PROJECT QUALITY MANAGEMENT February 2016
  • 19. TOOLS AND TECHNIQUESTOOLS AND TECHNIQUES Process Flowchart Example for design reviews PROJECT QUALITY MANAGEMENT February 2016
  • 20. Checksheets ‫قوائم‬‫المراجعة‬ “ ‫لرصد‬‫انماط‬‫االداء‬‫وتكرارھا‬ ” Also known as tally ‫مطابقة‬ Sheets and may be used as a checklist when gathering data. Used to organize facts in a manner that will facilitate the effective collection of useful data about a potential quality problem. They are especially useful for gathering attributes data while performing inspections to identify defects. TOOLS AND TECHNIQUESTOOLS AND TECHNIQUES inspections to identify defects. For example, data about the frequencies or consequences of defects collected in checksheets are often displayed using Pareto diagrams. PROJECT QUALITY MANAGEMENT February 2016
  • 21. Pareto Chart Specific type of histogram ordered by the frequency of occurrence (how many defects were generated by type / category of cause) It graphically prioritizes the causes of process problems (by frequency of occurrence) to help focus attention on the most critical issues affecting quality. TOOLS AND TECHNIQUESTOOLS AND TECHNIQUES Using the 80:20 Rule to Prioritize. Pareto Analysis is a simple technique for Pareto Analysis not only shows you the most important problem to solve, it also gives you a score showing how severe the problem is. PROJECT QUALITY MANAGEMENT February 2016 prioritizing problem-solving work so that the first piece of work you do resolved the greatest number of problems. It's based on the Pareto Principle (also known as the 80/20 Rule) – the idea that 80% of problems may be caused by as few as 20% of causes.
  • 22. Problem Cause Score (Step TOOLS AND TECHNIQUESTOOLS AND TECHNIQUES Steps: 1. Identify and List Problems. 2. Identify the Root Cause of Each Problem. 3. Score Problems. 4. Group Problems Together By Root Cause. 5. Add up the Scores for Each Group. 6. Take Action. No. Problem (Step1) Cause (Step 2) Score (Step 3) 1 Too few service center staff. 15 2 Too few service center staff. 6 3 Poor organization and preparation. 4 4 Poor organization and preparation. 2 5 Lack of Training 30 6 Lack of Training 21 PROJECT QUALITY MANAGEMENT February 2016
  • 23. TOOLS AND TECHNIQUESTOOLS AND TECHNIQUES Histogram A histogram is a vertical bar chart showing how often a particular variable state occurred. Each column represents an attribute or characteristic of a problem/situation. The height of each column represents the relative frequency of the characteristic. This tool helps illustrates the most common cause of problems in a process by the number and relative heights of the bars.number and relative heights of the bars. PROJECT QUALITY MANAGEMENT February 2016
  • 24. TOOLS AND TECHNIQUESTOOLS AND TECHNIQUES Control Chart Control charts measure the results of processes over time and display the results in graph form. Control charts are a way to measure variances to determine whether process variances are in control or out of control. A control chart is based on sample variance measurements. From the samples chosen and measured, the mean and standard deviation are determined. X Process Average UCL LCL + 3σσσσ - 3σσσσ Mean “Upper Control Limit”= Process Average + 3 Standard Deviations “Lower Control Limit”= Process Average - 3 Standard Deviations PROJECT QUALITY MANAGEMENT February 2016
  • 25. TOOLS AND TECHNIQUESTOOLS AND TECHNIQUES X XX Common Cause Variation: no points outside control limit Special Cause Variation: two points outside control limit Downward Pattern: no points outside control limit; however, eight or more points in trend Rule of seven Seven consecutive data points appearing on a control chart on one side of the mean, suggesting that the process is out of statistical control. PROJECT QUALITY MANAGEMENT February 2016
  • 26. Statistical TermsStatistical Terms Average Value obtained by dividing the sum of a set of quantities by the number of quantities in the set (arithmetic mean). Mean Sum of the values divided by the number of values . Median Middle value of a set of values ordered by rank. Mode For lists, the mode is the most common (frequent) value. A list can have more Mode than one mode. Standard Deviation Standard deviation tells how spread out numbers are from the average, calculated by taking the square root of the arithmetic average of the squares of the deviations from the mean in a frequency distribution. 3 Sigma 3 standard deviations. 6 Sigma 6 standard deviations. PROJECT QUALITY MANAGEMENT February 2016
  • 27. Statistical TermsStatistical Terms 1. To calculate the standard deviation, first compute the difference of each data point from the mean, and square the result of each: (15.36-15.40)2= 0.0016, (15.04-15.4)2= 0.1296, …….etc. 2. Next compute the average of these values, and take the square root: √ (0.0016+0.1296+ ……..etc) = 0.36 then Standard deviation is ± 0.36 9 PROJECT QUALITY MANAGEMENT February 2016
  • 28. Statistical TermsStatistical Terms Standard deviation is a statistical calculation used to measure and describe how data is organized. 68.25% of the values will fall within 1σ from the mean. 95.46% of the values will fall within 2σ from the mean. 99.73% of the values will fall within 3σ from the mean. 99.99966% of the values will fall within 6σ from the mean. PROJECT QUALITY MANAGEMENT February 2016
  • 29. Statistical TermsStatistical Terms PROJECT QUALITY MANAGEMENT February 2016
  • 30. Scatter Diagram Scatter diagrams use two variables, one called an independent variable, which is an input, and one called a dependent variable, which is an output. Scatter diagrams display the relationship between these two elements as points on a graph. This relationship is typically analyzed to prove or disprove cause-and-effect relationships. TOOLS AND TECHNIQUESTOOLS AND TECHNIQUES Powerful tool for spotting trends in data. The important point to remember about scatter diagrams is that they plot the dependent and independent variables, and the closer the points resemble a diagonal line, the closer these variables are related. Powerful tool for spotting trends in data. PROJECT QUALITY MANAGEMENT February 2016
  • 31. TOOLS AND TECHNIQUESTOOLS AND TECHNIQUES PROJECT QUALITY MANAGEMENT February 2016
  • 32. TOOLS AND TECHNIQUESTOOLS AND TECHNIQUES 4. Benchmarking (past analysis) Comparing actual or planned project practices to other projects, in order to generate ideas for improvement and to provide a standard against which to measure performance. 5. Design of experiments (what if?) PROJECT QUALITY MANAGEMENT February 2016 Analytical technique that helps identify which variables have the most influence on the overall outcome and helps determine an optimal solution from a relatively limited number of cases.
  • 33. TOOLS AND TECHNIQUESTOOLS AND TECHNIQUES 6. Statistical sampling Statistical sampling involves choosing part of a population of interest for inspection (for example, selecting ten engineering drawings at random from a list of seventy- five). Sample frequency and sizes should be determined during the Plan Quality process so the cost of quality will include the number of tests, expected scrap, etc. PROJECT QUALITY MANAGEMENT February 2016
  • 34. TOOLS AND TECHNIQUESTOOLS AND TECHNIQUES 7. Additional Plan quality tools Other quality planning tools are used to define the quality requirements and to plan effective quality management activities. 1. Brainstorming 2. Force field analysis 3. Nominal group technique 4. Quality management and control tools. 1) Affinity Diagram 2) Process decision program charts (PDPC) 3) Interrelationship digraphs 4) Tree diagrams 5) Prioritization matrices 6) Activity network diagrams 7) Matrix diagrams PROJECT QUALITY MANAGEMENT February 2016
  • 35. TOOLS AND TECHNIQUESTOOLS AND TECHNIQUES 1) Brainstorming ‫العصف‬‫الذھني‬ EQUILIBRIUM RESTRAINING FORCES PROJECT QUALITY MANAGEMENT February 2016 ‫العصف‬‫الذھني‬ DRIVING FORCES 2) Force field analysis ‫تحليل‬‫القوه‬‫الميدانيه‬ 3) Nominal group technique
  • 36. TOOLS AND TECHNIQUESTOOLS AND TECHNIQUES a. Affinity Diagram c. Interrelationship diagramb. Process decision program charts (PDPC) PROJECT QUALITY MANAGEMENT February 2016 e. Prioritization matrices g. Matrix diagramsd. Tree diagrams f. Activity network diagrams
  • 37. TOOLS AND TECHNIQUESTOOLS AND TECHNIQUES 1. Brainstorming A technique used to generate and collect multiple ideas related to project and product requirements. The common principle of brainstorming is to set aside the restrictive thinking processes so that many ideas can be generated. It is a way to reach a consensus of experts on a subject. It helps to expose crucial relationships and patterns in data that may not be initially apparent. PROJECT QUALITY MANAGEMENT February 2016
  • 38. TOOLS AND TECHNIQUESTOOLS AND TECHNIQUES 2. Force field analysis Kurt Lewin (1951) Identifies the forces and factors that may influence the problem or goal. Helps an organization to better understand promoting or driving and restraining or inhibiting forces so that the positives can be EQUILIBRIUM RESTRAININGFORCES inhibiting forces so that the positives can be reinforced and the negatives reduced or eliminated. RESTRAININGFORCES DRIVINGFORCES PROJECT QUALITY MANAGEMENT February 2016
  • 39. TOOLS AND TECHNIQUESTOOLS AND TECHNIQUES Steps: 1. Define the objective. 2. Brainstorm the forces that promote (driving, to be listed on the left) and inhibit (restraining, to be listed on the right) achieving the goal. 3. Score the forces according to their 'magnitude'. 4. Take action to strengthen the promoting forces and weaken the inhibiting forces (The score may well not balance on either side). Restraining forcesDriving forces PROJECT QUALITY MANAGEMENT February 2016 No Change Change Restraining forcesDriving forces Equilibrium Strength Strength Capital investment Fear Lack of incentives Lack of training Increased efficiency Customer demands Executive mandate Trust in unit leader 4 3 5 4 3 7 4 3 16 17
  • 40. TOOLS AND TECHNIQUESTOOLS AND TECHNIQUES 3. Nominal group technique This technique enhances brainstorming with a voting process used to rank the most useful ideas for further brainstorming or for prioritization. Helps eliminate biases and peer-pressure. Encourages participation from all team members. All opinions are heard and weighted equally. Steps: 1. Team members silently write down ideas 2. Ideas are shared and discussed 3. Team members vote PROJECT QUALITY MANAGEMENT February 2016
  • 41. TOOLS AND TECHNIQUESTOOLS AND TECHNIQUES 4. Quality Management and Control Tools: a. Affinity Diagram ‫مخطط‬‫التقارب‬ Jiro Kawakita, anthropologist , 1960 organizing a large number of ideas, opinions, and facts relating to a broad problem or subject area. Steps: 1. State the issue in a full sentence. PROJECT QUALITY MANAGEMENT February 2016 1. State the issue in a full sentence. 2. Brainstorm using short sentences on self-adhesive notes. 3. Post them for the team to see. 4. Sort ideas into logical groups. 5. Create concise descriptive headings for each group. 6. Tidy Up the Affinity Diagram
  • 42. TOOLS AND TECHNIQUESTOOLS AND TECHNIQUES PROJECT QUALITY MANAGEMENT February 2016
  • 43. TOOLS AND TECHNIQUESTOOLS AND TECHNIQUES b. Process Decision Program Charts (PDPC) ‫مخطط‬‫برنامج‬‫اتخاذ‬‫القرار‬ Used to understand a goal in relation to the steps for getting to the goal. The PDPC avoids surprises and identifies possible countermeasures. PDPC is a method for mapping out every conceivable event and contingency that can occur when moving from a problem statement to possible solutions. Steps: 1. The team state the objective. 2. That activity is followed by the first level. 3. In some cases a second level of detailed activities may be used. 4. The team brainstorms to determine what could go wrong with the conference, and these are shown as the “what-if” level. 5. The countermeasures are brainstormed and placed in a balloon in the last level. 6. The last step is to evaluate the countermeasures and select the optimal ones by placing an O underneath. Place an X under those that are rejected. PROJECT QUALITY MANAGEMENT February 2016
  • 44. TOOLS AND TECHNIQUESTOOLS AND TECHNIQUES PROJECT QUALITY MANAGEMENT February 2016
  • 45. TOOLS AND TECHNIQUESTOOLS AND TECHNIQUES c. Interrelationship Digraphs ‫مخطط‬‫العالقات‬‫المتبادلة‬ (ID) Identifies and explores causal relationships among related concepts or ideas. It allows the team to classify the cause-and-effect relationships among all factors so that the key drivers and outcomes can be used to solve the problem. Steps: 1. The team should agree on the issue or problem statement. 2. All of the ideas or issues from other techniques or from brainstorming should be laid out. 3. Start with the first issue. 4. The second iteration is to compare other issues. 5. The entire diagram should be reviewed and revised where necessary. 6. The diagram is completed by tallying the incoming and outgoing arrows and placing this information below the box. PROJECT QUALITY MANAGEMENT February 2016
  • 46. TOOLS AND TECHNIQUESTOOLS AND TECHNIQUES PROJECT QUALITY MANAGEMENT February 2016
  • 47. TOOLS AND TECHNIQUESTOOLS AND TECHNIQUES d. Tree Diagrams ‫المخطط‬‫الشجري‬ Maps out the paths and tasks necessary to complete a specific project or reach a specified goal. Steps: 1. Choose an action-oriented objective statement from the interrelationship diagram, affinity diagram, brainstorming, team mission statement. 2. Using brainstorming, choose the major headings. 3. Generate the next level by analyzing the major headings. 4. Repeat this question at each level. PROJECT QUALITY MANAGEMENT February 2016
  • 48. TOOLS AND TECHNIQUESTOOLS AND TECHNIQUES PROJECT QUALITY MANAGEMENT February 2016
  • 49. TOOLS AND TECHNIQUESTOOLS AND TECHNIQUES e. Prioritization Matrices ‫مصفوفة‬‫تحديد‬‫األولويات‬ Prioritizes issues, tasks, characteristics, based on weighted criteria using a combination of tree and matrix diagram techniques. Once prioritized, effective decision can be made. Prioritization matrices are designed to reduce the team’s options rationally before implementation planning occurs. PROJECT QUALITY MANAGEMENT February 2016
  • 50. TOOLS AND TECHNIQUESTOOLS AND TECHNIQUES Steps: 1. Identify the overall objective 2. Gather the people who are to work on the problem. 3. Produce the list of items to be prioritized. 4. Identify a list of criteria which may be used to judge how well each item on the list from step 3 serves the objective from step 1. 5. Allocate a weighting number to each criterion to show their relative importance in achieving the overall objective.overall objective. 6. Select the actual criteria to use against the list items to be prioritized. 7. Define how the list items from step 3 will be scored against each of the criteria identified in step 6. 8. Score each item against each criterion, using the method identified in step 7. 9. Multiply each score from step 8 by the number allocated to the appropriate criterion in step 5 to get the weighted score for each item against each criterion. 10.For each item, add up all of the weighted scores from step 8. This gives the final prioritizing score for each item, as in the figure below. 11.The final list of prioritized items may be made clearer for communication and decision making by sorting it into priority order and displaying it in a Pareto Chart. PROJECT QUALITY MANAGEMENT February 2016
  • 51. TOOLS AND TECHNIQUESTOOLS AND TECHNIQUES PROJECT QUALITY MANAGEMENT February 2016 Calculating weighting and final score Building the Prioritization Matrix
  • 52. TOOLS AND TECHNIQUESTOOLS AND TECHNIQUES f. Activity Network Diagrams ‫المخطط‬‫الشبكي‬‫لألنشطة‬ Program evaluation and review technique (PERT). Critical path method (CPM). Arrow diagram. Activity on node (AON). The diagram shows completion times, simultaneous tasks, and critical activity path. Steps: 1. The team brainstorms or documents all the task to complete a project. 2. The first task is located and placed on the extreme left of a large view work surface. 3. Any tasks that can be done simultaneously are placed below. 4. Repeat steps 2 and 3 until all tasks are placed in their correct sequence. 5. Number each task and draw connecting arrows. 6. Determine the critical path by completing the four remaining boxes in each task. PROJECT QUALITY MANAGEMENT February 2016
  • 53. TOOLS AND TECHNIQUESTOOLS AND TECHNIQUES PROJECT QUALITY MANAGEMENT February 2016
  • 54. TOOLS AND TECHNIQUESTOOLS AND TECHNIQUES g. Matrix Diagrams ‫مخطط‬‫المصفوفة‬ Display relationships between ideas, activities or other dimensions in such a way as to provide logical connecting points between each item. Data are presented in table form and can be objective or subjective, which can be given symbols with or without numerical values. Steps:Steps: 1. Select the factors affecting a successful plan. 2. Select the appropriate format (depend on the number of variables). 3. Determine the relationship symbols. PROJECT QUALITY MANAGEMENT February 2016
  • 55. TOOLS AND TECHNIQUESTOOLS AND TECHNIQUES PROJECT QUALITY MANAGEMENT February 2016
  • 56. TOOLS AND TECHNIQUESTOOLS AND TECHNIQUES 7. Meetings Project teams may hold planning meetings to develop the quality management plan. Attendees at these meetings may include the project manager; the project sponsor; selected project team members; selected stakeholders; anyone with responsibility for Project Quality Management activities namely Plan Quality Management, Perform Quality Assurance, or Control Quality; and others as needed. PROJECT QUALITY MANAGEMENT February 2016
  • 57. OUTPUTSOUTPUTS 1. Quality management plan (It should be in early stage of project) The purpose of the Plan Quality process is to determine what quality is and to put a plan in place to manage quality. This plan is called the quality management plan. There are many different examples of quality management plans. Most include the following: The quality standards that apply to the project. Who will be involved in managing quality, when, and what their specific duties will be . Review of earlier decisions to make sure those decisions are correct. The meetings to be held addressing quality. The reports that will address quality. What metrics will be used to measure quality. What parts of the project or deliverables will be measured and when additional plan quality tools. PROJECT QUALITY MANAGEMENT February 2016
  • 58. OUTPUTSOUTPUTS 2. Process improvement plan Is a subsidiary of the Project Management Plan that details the steps for analyzing processes that will facilitate the identification of waste and non-value added activity, such as: Process boundaries (purpose, start, end, inputs, outputs, data required, owner and stakeholder processes) Process configuration (flowchart of processes to facilitate analysis with interfacesProcess configuration (flowchart of processes to facilitate analysis with interfaces identified) Process metrics (maintain control over status of processes) Targets for improved performance Deals with how quality activities will be streamlined and improved. 3. Project documents (updates) Stakeholder register. Responsibility Assignment Matrix. PROJECT QUALITY MANAGEMENT February 2016
  • 59. OUTPUTSOUTPUTS 3. Quality Metrics Metric = Operational definition that describes in very specific terms, what something is, and how quality control process measures it. A measurement is an actual value. Examples: Defect density, failure rate, availability, test coverage What is a variable? A characteristic to measure. Example: Size & Shape What is an attribute? The measurement Example: Inches, Meters and Pounds Defect density, failure rate, availability, test coverage It is not adequate for the team to say that the system needs to have a rapid response time. Instead, a quality metric might specify that a system must respond within two seconds to 99% of all requests up to 1,000 simultaneous users. PROJECT QUALITY MANAGEMENT February 2016
  • 60. OUTPUTSOUTPUTS 4. Quality checklists A checklist is a Plan quality output put to ensure that all steps were performed, and that they were performed in the proper sequence. Establish a common reference for quality management execution. Are especially effective when developed and improved over several projects. Checklists are a sample tool that is used to keep from overlooking items of importance.Checklists are a sample tool that is used to keep from overlooking items of importance. A checklist is really just an instruction sheet for an inspector to use. The items in the checklist should be significant items. 5. Project Documents Updates Stakeholder register. Responsibility assignment matrix. WBS and WBS Dictionary. PROJECT QUALITY MANAGEMENT February 2016
  • 61. Perform Quality Assurance Input Tools and Techniques Output 1. Quality management plan 1. Plan quality & quality 1. Change requests The process of auditing the quality requirements and the results from quality control measurements to ensure appropriate quality standards and operational definitions are used. 1. Quality management plan 2. Process improvement plan 3. Quality metrics 4. Quality control measurements 5. Project documents 1. Plan quality & quality control tools 2. Quality auditsaudits 3. Process analysis 1. Change requests 2. Project management plan updates 3. Project documents updates 4. Organizational process asset updates PROJECT QUALITY MANAGEMENT February 2016
  • 62. INPUTSINPUTS 1. Quality management plan Quality management plan: The quality management plan describes how quality assurance will be performed within the project. Process improvement plan: The process improvement plan details the steps for analyzing processes to identify activities which enhance their value. 2. Process improvement plan The project’s quality assurance activities should be supportive of and consistent with the performing organization’s process improvement plans. 3. Quality metrics The quality metrics provide the attributes that should be measured and the allowable variations. PROJECT QUALITY MANAGEMENT February 2016
  • 63. INPUTSINPUTS 4. Quality control measurements. The quality control measurements can be thought of as a feedback loop. As changes are evaluated here in the process of Perform Quality Assurance, they are measured in Perform Quality Control and fed back into this process for evaluation. Are the results of the quality control activities that are feedback to QA process for use in re-evaluating and analyzing the quality standards and processes of the performing organization. 5. Project documents Project documents may influence quality assurance work and should be monitored within the context of a system for configuration management. PROJECT QUALITY MANAGEMENT February 2016
  • 64. TOOLS AND TECHNIQUESTOOLS AND TECHNIQUES 1. Plan quality & quality control tools Tools and techniques from Plan Quality and Perform Quality Control. 2. Quality audits Audits (Key Tool) review the project to evaluate which activities taking place on the project should be improved and which meet quality standards The goal of the audits is both to improve acceptance of the product and theThe goal of the audits is both to improve acceptance of the product and the overall cost of quality Structured, independent review to determine whether the project activities comply with organizational and project policies, processes and procedures Confirm the implementation of approved change requests, corrective actions, defect repairs and preventive actions May be scheduled or at random, may be carried out by in-house or external auditors PROJECT QUALITY MANAGEMENT February 2016
  • 65. 3. Process analysis Follow the steps outlined in the process improvement plan to ensure that it is working efficiently and effectively. Examines problems experienced, constraints and non-value added activities identified during process operation. TOOLS AND TECHNIQUESTOOLS AND TECHNIQUES Include: root cause analysis (specific technique to analyze a situation, determine the underlying causes that lead to it and develop preventive actions for similar problems). PROJECT QUALITY MANAGEMENT February 2016
  • 66. OUTPUTSOUTPUTS 1. Change requests Change requests are created and used as input into the Perform Integrated Change Control process to allow full consideration of the recommended improvements. 2. Project management plan updates Quality management plan, Schedule management plan, and Cost management plan.Cost management plan. 3. Project documents updates Quality audits reports, Training plans, and Process documentation. 4. Organizational process asset updates Elements of the organizational process assets that may be updated include, the quality standards. PROJECT QUALITY MANAGEMENT February 2016
  • 67. Control Quality Input Tools and Techniques Output 1. Quality management plan 2. Quality metrics 1. Seven basic quality tools 2. Statistical sampling 1. Quality Control measurements The process of monitoring and recording results of executing the quality activities to assess performance and recommend necessary changes. 2. Quality metrics 3. Quality checklists 4. Work performance data 5. Approved change requests 6. Deliverables 7. Project documents 8. Organizational process assets 2. Statistical sampling 3. Inspection 4. Approved change request review measurements 2. Validated changes 3. Verified deliverables 4. Work performance information 5. Change requests 6. Project management plan updates 7. Project documents updates 8. Organizational process asset updates PROJECT QUALITY MANAGEMENT February 2016
  • 68. INPUTSINPUTS 1. Quality management plan Quality management plan 2. Quality metrics A quality metric describes a project or product attribute and how it will be measured. Some examples of quality metrics include: function points, mean time between failure (MTBF), and mean time to repair (MTTR).failure (MTBF), and mean time to repair (MTTR). 3. Quality checklists Quality checklists are structured lists that help to verify that the work of the project and its deliverables fulfill a set of requirements 4. Work performance data Planned vs. actual technical performance, Planned vs. actual schedule performance, and Planned vs. actual cost performance. PROJECT QUALITY MANAGEMENT February 2016
  • 69. INPUTSINPUTS 5. Approved change requests Approved change requests can include modifications such as defect repairs, revised work methods and revised schedule. The timely implementation of approved changes needs to be verified. 6. Deliverables A deliverable is any unique and verifiable product, result, or capability that results in a validated deliverable required by the project. 7. Project documents Agreements Quality audit reports and change logs supported with corrective action plans. Training plans and assessments of effectiveness. Process documentation. 8. Organizational process assets Quality standards and policies. Standard work guidelines. Issue and defect reporting procedures and communication policies. PROJECT QUALITY MANAGEMENT February 2016
  • 70. 1. Seven Basic Quality Tools 1. Cause-and-effect diagrams 2. Flowcharts, which 3. Checksheets 4. Pareto diagrams 5. Histograms TOOLS AND TECHNIQUESTOOLS AND TECHNIQUES 6. Control charts 7. Scatter diagrams, PROJECT QUALITY MANAGEMENT February 2016
  • 71. TOOLS AND TECHNIQUESTOOLS AND TECHNIQUES 2. Statistical sampling Statistical sampling involves choosing part of a population of interest for inspection (for example, selecting ten engineering drawings at random from a list of seventy- five). Sample frequency and sizes should be determined during the Plan Quality process so the cost of quality will include the number of tests, expected scrap, etc. 3. Inspection Is the examination of a work product to determine whether it conforms to standardsIs the examination of a work product to determine whether it conforms to standards Includes measuring, examining and testing Performed at various points in the project Intensity level is dependent on the quality plan Also referred to as reviews, peer reviews, audits and walkthroughs 4. Approved change request review All approved change requests should be reviewed to verify that they were implemented as approved. PROJECT QUALITY MANAGEMENT February 2016
  • 72. OUTPUTSOUTPUTS 1. Quality Control measurements The quality control measurements can be thought of as a feedback loop. As changes are evaluated here in the process of Perform Quality Assurance, they are measured in Perform Quality Control and fed back into this process for evaluation. Are the results of the quality control activities that are feedback to QA process for use in re-evaluating and analyzing the quality standards and processes of the performing organizationperforming organization 2. Validated changes Any changed or repaired items are inspected and will be either accepted or rejected before notification of the decision is provided. Rejected items may require rework. 3. Verified deliverables A goal of quality control is to determine the correctness of deliverables. The results of the execution quality control processes are validated deliverables. Validated deliverables are an input to Verify Scope for formalized acceptance. PROJECT QUALITY MANAGEMENT February 2016
  • 73. OUTPUTSOUTPUTS 4. Work Performance Information Work performance information is the performance data collected from various controlling processes, analyzed in context and integrated based on relationships across areas. 5. Change requests If the recommended corrective or preventive actions or a defect repair requires a change to the project management plan, a change request should be initiated in accordance with the defined Perform Integrated Change Control process. 6. Project management plan updates Quality management plan. Process improvement plan. 7. Project documents updates Quality standards. 8. Organizational process asset updates Completed checklists. Lessons learned documentation. PROJECT QUALITY MANAGEMENT February 2016
  • 74. REMEMBERREMEMBER The project manager should recommend improvements to the performing organization's standards, policies, and processes. Such recommendations are expected and welcomed by management. Quality should be considered whenever there is a change to any component of the project constraints. Quality should be checked before an activity or work package is completed. The project manager must spend time trying to improve quality. PROJECT QUALITY MANAGEMENT February 2016 The project manager must spend time trying to improve quality. The project manager must determine metrics to be used to measure quality before the project work begins. The project manager MUST put in place a plan for continually improving processes. The project manager MUST make sure authorized approaches and processes are followed. Some of the quality activities may be done by a quality assurance or quality control department.
  • 75. REMEMBERREMEMBER Action for ensuring Quality 1. Review the project charter and project scope statement 2. Ask customer what is his definition of quality 3. Identify any quality standards that are applicable to the project 4. Identify the desired levels of performance in the product 5. Identify level of control for the project PROJECT QUALITY MANAGEMENT February 2016 6. Set standard to reach to that level of performance 7. Decide what will you to ensure processes are followed and standards are met 8. Meetings, reports, measurements, calculations. 9. Perform QA 10. Perform QC
  • 77. Quality EvolutionQuality Evolution PROJECT QUALITY MANAGEMENT February 2016
  • 78. The basic approach to project quality management described in the PMBOK is intended to be compatible with that of The International Organization for Standardization (ISO). For the PMP Exam you need to know the paradigms and absolutes of the main quality systems and gurus: 1. ISO: it is a quality system standard applicable to any product, service, or process anywhere in the world Quality EvolutionQuality Evolution 2. TQM: Total Quality Management Philosophy encourages companies and their employees to focus on finding ways to continuously improve quality of their business practices and products. 3. Deming: Develop Plan-Do-Check-Act to improve quality, each process should go through these steps to improve the quality. 4. Joseph Juran: “fitness to use” , Cost of quality is cost of conformance and nonconformance 5. Philip Crosby: “conformance to requirement”, “Zero Defects” “Do it right the first time”. PROJECT QUALITY MANAGEMENT February 2016
  • 79. Quality EvolutionQuality Evolution National Standards Institute (ANSI) represents the United States. ISO 9000 is not a set of standards for products or services, nor is it specific to any one industry. Instead, it is a quality system standard applicable to any product, service, or process anywhere in the world. The information included in the ISO 9000 series includes: ISO 9000: This defines the key terms and acts as a road map for the other standards within the series.within the series. ISO 9001: This defines the model for a quality system when a contractor demonstrates the capability to design, produce, and install products or services. ISO 9002: This is a quality system model for quality assurance in production and installation. ISO 9003: This is a quality system model for quality assurance in final inspection and testing. ISO 9004: This provides quality management guidelines for any organization wishing to develop and implement a quality system. Guidelines are also available to determine the extent to which each quality system model is applicable. PROJECT QUALITY MANAGEMENT February 2016
  • 80. Quality EvolutionQuality Evolution 1 2 3 4 5 Becoming 6 Writing a policy Defining Procedures Following them Getting everyone else to follow them Everyone wants to follow them Becoming prevention oriented continuously improving organization ISO 9000 TOTAL QUALITY MANAGEMENT PROJECT QUALITY MANAGEMENT February 2016
  • 81. Quality EvolutionQuality Evolution Principles of TQM Customer-oriented Leadership Strategic planning Employee responsibility Continuous improvement Cooperation Statistical methods Training and education PROJECT QUALITY MANAGEMENT February 2016
  • 82. W. Edwards Deming ““Quality is a management problem” The 14 Points “standard reference for quality transformation” 1. Create a constant purpose toward improvement. 2. Adopt the new philosophy. 3. Stop depending on inspections. 4. Use a single supplier for any one item. 5. Improve constantly and forever. Continuously improve your systems and processes. Deming promoted the Plan-Do- Check-Act approach to process analysis and improvement. Emphasize training and education so everyone can do their jobs better. Use kaizen as a model to reduce waste and to improve productivity, effectiveness, and safety. By improving quality, companies will decrease expenses as well as increase productivity and market share. “Out of Crisis” 1982 safety. 6. Use training on the job. 7. Implement leadership. 8. Eliminate fear. 9. Break down barriers between departments. 10.Get rid of unclear slogans. 11.Eliminate management by objectives. 12.Remove barriers to pride of workmanship. 13.Implement education and self-improvement. 14.Make "transformation" everyone's job. Oct.1900 – Dec. 1993 Quality problem (85% management and 15% worker) PROJECT QUALITY MANAGEMENT February 2016
  • 83. Dr. Joseph M. Juran (The Father of Quality) ““Fitness for Use” Quality begins with who, how, and why these customers will use it, without this information any improvement will be guesswork. In other words, all improvement activities should be customer focused Juran’s five attributes for “fitness for use”: 1. Quality of design 2. Quality of conformance (Dec. 1904 – Feb. 2008) 2. Quality of conformance 3. Availability 4. Safety 5. Field use He development 80/20 principle Quality is fitness for use. 1Quality Control Handbook, 2Managerial Breakthrough, 3Management of Quality Control, 4Quality Planning and Analysis, 5Upper Management and Quality, and 6Juran on Planning for Quality. Needs of the customers and Stakeholders are defined and then attempted to satisfy. “Quality Control Handbook 1951” (Dec. 1904 – Feb. 2008) PROJECT QUALITY MANAGEMENT February 2016
  • 84. Philip Crosby ““Zero defects and prevention or rework results ” Zero defects is a way of thinking and doing that reinforces the notion that defects are not acceptable, and that everyone should "do things right the first time". The idea here is that with a philosophy of zero defects, you can increase profits both by eliminating the cost of failure and increasing revenues through increased customer satisfaction. Defects are not acceptable, and that everyone should "do things right the first time“ “Quality is free 1979” Zero defects is NOT about being perfect. Zero defects is about changing your perspective. It does this by demanding that you: 1. Recognize the high cost of quality issues. 2. Continuously think of the places where flaws may be introduced. 3. Work proactively to address the flaws in your systems and processes, which allow defects to occur. Quality is conformance to requirements. Jun.1926 - Aug. 2001 PROJECT QUALITY MANAGEMENT February 2016
  • 85. Kaizen Philosophy ““Continuous Improvement” Apply continuous small improvements to reduce costs and ensure consistency. Kaizen (Ky’zen) is meaning “change for the better” in Japanese. 改改改改 In united Stated and most of Western Europe, improvements are thought of as big improvements. In Japan, improvements are thought of as small improvements. PROJECT QUALITY MANAGEMENT February 2016 善善善善
  • 86. Quality ResearchesQuality Researches Walter Shewart In 1920s, developed control charts. Introduced the term “quality assurance” . W. Edwards Deming Developed courses during World War II to teach statistical quality-control techniques to engineers and executives of companies that were military suppliers. After the war, began teaching statistical quality control to Japanese companies. Joseph M. Juran Followed Deming to Japan in 1954.Followed Deming to Japan in 1954. Focused on strategic quality planning. Philip Crosby In 1979, emphasized that costs of poor quality far outweigh the cost of preventing poor quality. In 1984, defined absolutes of quality management — conformance to requirements, prevention, and “zero defects”. Kaoru Ishikawa Promoted use of quality circles. Developed “fishbone” diagram. Emphasized importance of internal customer. PROJECT QUALITY MANAGEMENT February 2016
  • 87. Quality ResearchesQuality Researches Deming Juran Crosby Ishikawa PDCA (Plan, Do, Check, Act) Quality is a management problem TQM “Total Quality Management” Quality is free Cause and Effect Fishbone Diagram (Flowchart) problem Poor quality: 85% Management 15% Worker Fitness for Use Zero defects Design Statistics Don’t confuse with 80/20 Conformance to requirements PROJECT QUALITY MANAGEMENT February 2016
  • 88. PrecisionAccuracy A very accurate measurement is not necessarily precise. Precise measurements are not necessarily accurate. Precise and AccuratePrecise and Accurate Precision Accuracy Consistency that the value of repeated measurements are clustered and have little scatter Correctness that the measured value is very close to the true value Precision or Accuracy which one is more important to be determined by the project management team? PROJECT QUALITY MANAGEMENT February 2016
  • 89. Refreshments Q1: When a product or service completely meets a customer's requirements: A. Quality is achieved. B. The cost of quality is high. C. The cost of quality is low. D. The customer pays the minimum price. Q2: To what does the following sentence refer? "The point where the benefits or revenue toQ2: To what does the following sentence refer? "The point where the benefits or revenue to be received from improving quality equals the incremental cost to achieve that quality." A. Quality control analysis B. Marginal analysis C. Standard quality analysis D. Conformance analysis PROJECT QUALITY MANAGEMENT February 2016
  • 90. Refreshments Q3: A project manager and team from a firm that designs railroad equipment are tasked to design a machine to load stone onto railroad cars. The design allows for two percent spillage, amounting to over two tons of spilled rock per day. In which of the following does the project manager document quality control, quality assurance, and quality improvements for this project?project? A. Quality management plan B. Quality policy C. Control charts D. Project management plan PROJECT QUALITY MANAGEMENT February 2016
  • 91. Refreshments Q4: You are managing a project in a just-in-time environment. This will require more attention, because the amount of inventory in such an environmental is generally: A. 45 percent. B. 10 percent. C. 12 percent.C. 12 percent. D. 0 percent. PROJECT QUALITY MANAGEMENT February 2016
  • 92. Refreshments Q5: Work on a project is ongoing when the project manager overhears two workers arguing over what a set of instructions mean. The project manager investigates and discovers that the instructions for the construction of the concrete footings currently being poured were poorly translated between the different languages in use on the project. Which of the following is the BEST thing for the project manager to do FIRST?project. Which of the following is the BEST thing for the project manager to do FIRST? A. Get the instructions translated by a more experienced party. B. Look for quality impacts of the poor translation of the instructions for the footings. C. Bring the issue to the attention of the team and ask them to look for other translation problems. D. Inform the sponsor of the problem in the next project report. PROJECT QUALITY MANAGEMENT February 2016
  • 93. THANK YOU PROJECT QUALITY MANAGEMENT February 2016