The document discusses different ways to represent relations, including:
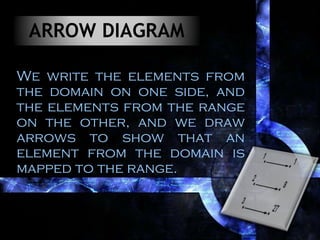
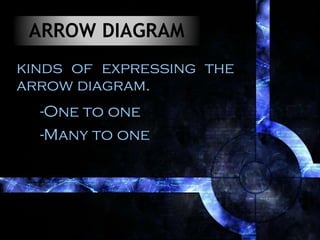
1) Arrow diagrams, which show mappings between elements of a domain and range using arrows. Relations can be one-to-one or many-to-one.
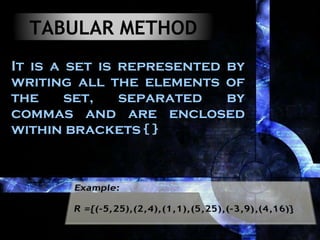
2) Tabular methods, which list the domain and range elements.
3) Graphical representations, where the domain and range elements are plotted on a graph. For a relation to be a function, a vertical line cannot pass through more than one point.