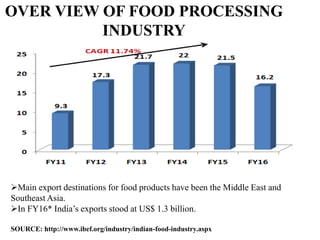
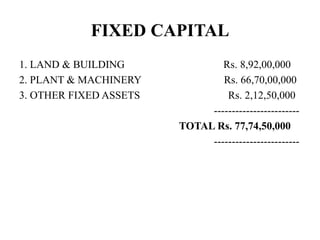
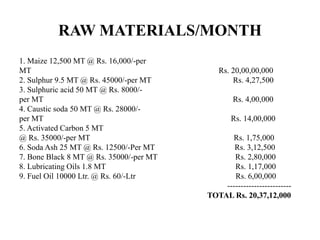
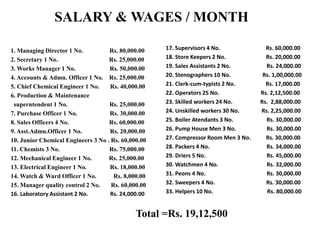
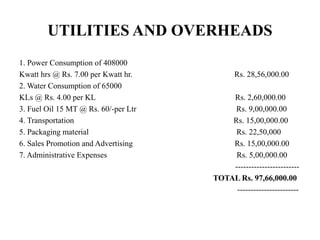
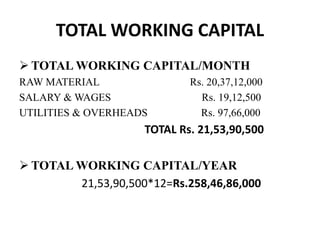
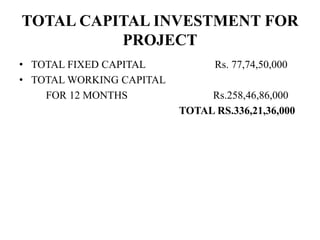
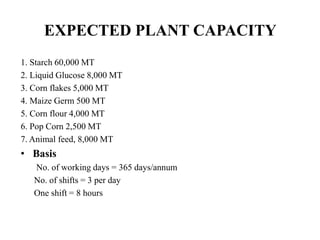
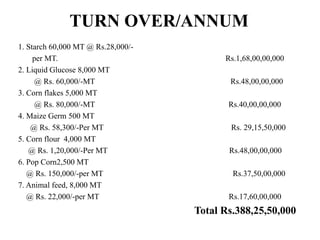
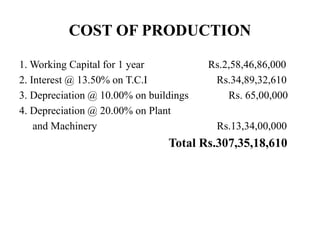
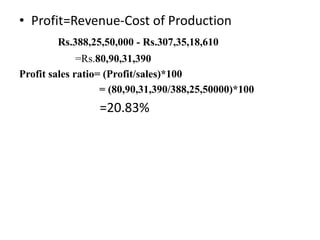
A PROJECT FEASIBILITY REPORT
FOR A FOOD PROCESSING
COMPANY
Prepared by
ANIL KUMAR
OVER VIEW OF FOOD PROCESSING
INDUSTRY
Main export destinations for food products have been the Middle East and
Southeast Asia.
In FY16* India’s exports stood at US$ 1.3 billion.
SOURCE: http://www.ibef.org/industry/indian-food-industry.aspx
FOOD PROCESSING INDUSTRY’S
CONTRIBUTION TO GDP
India ranks fifth in terms of production, consumption and exports. As per
the latest data available, food processing sector is expected to reach US$ 258
billion in FY15.
It constituted 14 per cent to India’s GDP through manufacturing.
Source:http://www.ibef.org/industry/indian-food-industry.aspx
MAJOR SEGMENTS OF FOOD
PROCESSING INDUSTRIES
India is the world’s 2nd largest producer
of fruits and vegetables.
produces 86.283 million tonnes of fruits,
167.058 million tonnes of
vegetables during 2014 - 15
India is the largest producer of milk in the
world, with the production
estimated at 146.3 MT in FY15
India is the second largest producer of goat
meat (0.91 MT in 2015). It is world’s 2nd largest
egg producer (78.4 bn) & 3rd largest producer of
broiler meat (3.8 MT)
Total fish production is expected to reach 10.06
MT with Andhra Pradesh being the largest
producer in the country estimated 1.9 MT
during 2014-2015
India produces more than 200 mn Tonnes of
different food grains. Total food grains
production reached 252.68 MT in FY15.
Source:Indiabusiness.nic.in, Ministry of Agriculture, Directorate of
Statistics, APEDA, Indiastat, Meat & Poultry Processing Board
PROJECT FEASIBILTY REPORT ON
MAIZE PROCESSING INDUSTRY
..?
GLOBAL MAIZE PRODUCTION
SOURCE: USDA, Directorate of Economics and Statistics,
Department of Agriculture and Cooperation, 2015
IMPORTING AND EXPORTING
TOP MAIZE EXPORTING COUNTRIES TOP MAIZE IMPORTING COUNTRIES
SOURCE: USDA, Directorate of Economics and Statistics,
Department of Agriculture and Cooperation, 2015
MAIZE PRODUCTION INDIA
Maize production is dominated by Andhra Pradesh and Karnataka, producing ~38 per cent of India’s
maize in 2013-14
SOURCE: USDA, Directorate of Economics and Statistics,
Department of Agriculture and Cooperation, 2015
MAIZE PRODUCTION STATES
SOURCE: KPMG, cutting through complexity,2014
MAIZE PROCESSING INDUSTRY
BY PRODUCTS
Corn flour
Pop corn
Corn flakes
Corn germ oil
Corn starch
Integrated Project Analysis Model
MARKET ANALYSIS
Technical
analysis
Environmental
impact assessment
Social impact
assessment
Financial
analysis
Economic
analysis
PROJECT SELECTION
FEASIBILITY REPORT
Project approval Statutory approval
Preliminary
design
Survey
Source: Impact Assessment and Project Appraisal 2001, Dr.P.K.De
TECHNICAL ANALYSIS
• Materials and inputs
• Production Technology
• Production Mix
• Plant Capacity
• Location and site
• Machinery and Equipment
• Project charts and Layouts
FINANCIAL ANALYSIS
Cost of the project.
 Means of financing.
 Estimate of sales and production.
 Cost of production.
 Working capital requirement.
 Estimates of working results.
 Breakeven analysis.
 Projected cash flow statements.
A.PLANT & MACHINERY
EQUIPMENT QUANTITY
Steeping tanks 8
Centrifugal Pumps 120M^3/H=8,50M^3/H=8
Heat Exchangers 8
Fluming System. 2
Compressor with Air Receiver 3
Sulphur Burner with all Accessories 1
Rotary Valve 1
Grind Mill 1
TANKS 18
Fibre washing screens 2
Agitator 4
A = Approximate. Cost of the maize processing machinery and equipments
TOTAL COST=Rs.60,00,00,000
B. HANDLING/HOLDING &
STORAGE EQUIPMENTS
• 1. M.S Storage Silo
Cap: 50 tons 15 No. Rs. 1,25,00,000.00
• 2. Vibro-screen (Automatic) with 25 HP
motor and accessories
Cap: 30-50 tons/hour 2 No. Rs. 1,80,00,000.00
• 3. Automatic weighing, filling, & bags
sealing machine 1 No. Rs. 1,50,00,000.00
• 4. Pipes, pumps, motors Airlock,
structures & others Rs. 90,00,000.00
• 5. Electrical fittings, switchgear,
MCB, cables, & others Rs. 50,00,000.00
Total cost =Rs.5,95,00,000.00
B = Approximate. Cost of the HANDLING/HOLDING & STORAGE
EQUIPMENTS
C. Lab Testing Equipment
 Refractometer 1
 TDS meter 1
 PH meter 1
 Water Distillation Unit 1
 Laboratory Oven with Air Circulation 1
 Scientific Balance 1
 Heating menthal 1
 Muffle Furnace 1
 Electric Heating Plate 1
 Thermometer 1
 Bursting Strength Tester 1
 Water Bath 1
(Microbiological Testing)
 Rotary Shakers 1
 Airflow Oven Drier 1
 Laminar Airflow cabinet 1
 Fat Extraction Unit
 Spirit Lamp
 Reagent Bottles
 Glass Rod
 Beakers
 Volumetric Flask
 Conical Flask
 Pippete Stand
 Measuring Cylinder
 Burette
 Pippete
 Glass Funnel
 Clamps & Stand
 Pipetter(suction for pipette)
 Silica beads
 Sampling Probe
 Burette Stand With Clamp
 Tripod Stand
 Funnel
 Petri Plate
 Silica Crucible
 Glass beads
 Protein Estimation unit
C = Approximate. Cost of the lab equipments Total Cost Rs. 75,00,000.00
Total cost of machinery and
equipments
Grand Total A+B+C = Rs. 60,00,00,000+ Rs. 5,95,00,000+
Rs.75,00,000
= Rs. 66,70,00,000
So, Total Rs.66,70,00,000
LOCATION AND SITE
1.Telangana, Medak district(cost of one
sq.yard=Rs250) it is located 95km from
Hyderabad
2.Karnataka, Tumkuru district (1 sq.yard=Rs.550)
It is located 85km from Bengaluru
Source: Registration & Stamp Department
Government Telangana and karnataka
LAND AND BUILDING COST
1. Land 20 Acre @ 12,10,000/ACRE Rs.2,42,00,000
2. Site Development charges Rs. 20,00,000
3. Maize/Corn storage Silos 1000
Sq.mtr @ Rs. 7500/-per sq.mtrs. Rs. 75,00,000
4. Maize Steeping section 2500 sq.mtr
@ Rs. 7500/-per sq.mtrs. Rs. 1,87,50,000
5. Wet Milling Section 2000 sq.mtrs.
Rs. 7500/-sq.mtrs. Rs. 1,50,00,000
6.Raw Material Storage area 1000
sq.mtrs. @ Rs. 7500/- Rs. 75,00,000
7. Packaging material storage 800
sq.mtrs. @ Rs. 7500/-per sq.mtrs. Rs. 60,00,000
8.Truck Scale Weight bridge 500 sq.mt
@ Rs. 6500/-per sq.mtrs. Rs. 32,50,000
9.Administrative office 500 sq.mtrs.
@ Rs. 10000/-per sq.mtrs. Rs. 50,00,000
TOTAL=Rs,8,92,00,000
OTHER FIXED COSTS
1. Water Electricity connection Rs. 12,50,000
2. Site fabrication work Rs. 15,00,000
3. Erection & Commissioning Rs. 25,00,000
4. Preliminary & Preoperative
expenses Rs. 20,00,000
5. Office Furniture and equipment Rs. 20,00,000
6. DG Generator with accessories Rs. 1,20,00,000
------------------------
TOTAL Rs. 2,12,50,000
------------------------
FIXED CAPITAL
1. LAND & BUILDING Rs. 8,92,00,000
2. PLANT & MACHINERY Rs. 66,70,00,000
3. OTHER FIXED ASSETS Rs. 2,12,50,000
------------------------
TOTAL Rs. 77,74,50,000
------------------------
RAW MATERIALS/MONTH
1. Maize 12,500 MT @ Rs. 16,000/-per
MT Rs. 20,00,00,000
2. Sulphur 9.5 MT @ Rs. 45000/-per MT Rs. 4,27,500
3. Sulphuric acid 50 MT @ Rs. 8000/-
per MT Rs. 4,00,000
4. Caustic soda 50 MT @ Rs. 28000/-
per MT Rs. 14,00,000
5. Activated Carbon 5 MT
@ Rs. 35000/-per MT Rs. 1,75,000
6. Soda Ash 25 MT @ Rs. 12500/-Per MT Rs. 3,12,500
7. Bone Black 8 MT @ Rs. 35000/-per MT Rs. 2,80,000
8. Lubricating Oils 1.8 MT Rs. 1,17,000
9. Fuel Oil 10000 Ltr. @ Rs. 60/-Ltr Rs. 6,00,000
------------------------
TOTAL Rs. 20,37,12,000
SALARY & WAGES / MONTH
1. Managing Director 1 No. Rs. 80,000.00
2. Secretary 1 No. Rs. 25,000.00
3. Works Manager 1 No. Rs. 50,000.00
4. Accounts & Admn. Officer 1 No. Rs. 25,000.00
5. Chief Chemical Engineer 1 No. Rs. 40,000.00
6. Production & Maintenance
superntendent 1 No. Rs. 25,000.00
7. Purchase Officer 1 No. Rs. 30,000.00
8. Sales Officers 4 No. Rs. 60,000.00
9. Asst.Admn.Officer 1 No. Rs. 20,000.00
10. Junior Chemical Engineers 3 No . Rs. 60,000.00
11. Chemists 3 No. Rs. 75,000.00
12. Mechanical Engineer 1 No. Rs. 25,000.00
13. Electrical Engineer 1 No. Rs. 18,000.00
14. Watch & Ward Officer 1 No. Rs. 8,000.00
15. Manager quality control 2 No. Rs. 60,000.00
16. Laboratory Assistant 2 No. Rs. 24,000.00
17. Supervisors 4 No. Rs. 60,000.00
18. Store Keepers 2 No. Rs. 20,000.00
19. Sales Assistants 2 No. Rs. 24,000.00
20. Stenographers 10 No. Rs. 1,00,000.00
21. Clerk-cum-typists 2 No. Rs. 17,000.00
22. Operators 25 No. Rs. 2,12,500.00
23. Skilled workers 24 No. Rs. 2,88,000.00
24. Unskilled workers 30 No. Rs. 2,25,000.00
25. Boiler Atendants 3 No. Rs. 30,000.00
26. Pump House Men 3 No. Rs. 30,000.00
27. Compressor Room Men 3 No. Rs. 30,000.00
28. Packers 4 No. Rs. 34,000.00
29. Driers 5 No. Rs. 45,000.00
30. Watchmen 4 No. Rs. 32,000.00
31. Peons 4 No. Rs. 30,000.00
32. Sweepers 4 No. Rs. 30,000.00
33. Helpers 10 No. Rs. 80,000.00
Total =Rs. 19,12,500
UTILITIES AND OVERHEADS
1. Power Consumption of 408000
Kwatt hrs @ Rs. 7.00 per Kwatt hr. Rs. 28,56,000.00
2. Water Consumption of 65000
KLs @ Rs. 4.00 per KL Rs. 2,60,000.00
3. Fuel Oil 15 MT @ Rs. 60/-per Ltr Rs. 9,00,000.00
4. Transportation Rs. 15,00,000.00
5. Packaging material Rs. 22,50,000
6. Sales Promotion and Advertising Rs. 15,00,000.00
7. Administrative Expenses Rs. 5,00,000.00
------------------------
TOTAL Rs. 97,66,000.00
-----------------------
TOTAL WORKING CAPITAL
 TOTAL WORKING CAPITAL/MONTH
RAW MATERIAL Rs. 20,37,12,000
SALARY & WAGES Rs. 19,12,500
UTILITIES & OVERHEADS Rs. 97,66,000
TOTAL Rs. 21,53,90,500
 TOTAL WORKING CAPITAL/YEAR
21,53,90,500*12=Rs.258,46,86,000
TOTAL CAPITAL INVESTMENT FOR
PROJECT
• TOTAL FIXED CAPITAL Rs. 77,74,50,000
• TOTAL WORKING CAPITAL
FOR 12 MONTHS Rs.258,46,86,000
TOTAL RS.336,21,36,000
EXPECTED PLANT CAPACITY
1. Starch 60,000 MT
2. Liquid Glucose 8,000 MT
3. Corn flakes 5,000 MT
4. Maize Germ 500 MT
5. Corn flour 4,000 MT
6. Pop Corn 2,500 MT
7. Animal feed, 8,000 MT
• Basis
No. of working days = 365 days/annum
No. of shifts = 3 per day
One shift = 8 hours
TURN OVER/ANNUM
1. Starch 60,000 MT @ Rs.28,000/-
per MT. Rs.1,68,00,00,000
2. Liquid Glucose 8,000 MT
@ Rs. 60,000/-MT Rs.48,00,00,000
3. Corn flakes 5,000 MT
@ Rs. 80,000/-MT Rs.40,00,00,000
4. Maize Germ 500 MT
@ Rs. 58,300/-Per MT Rs. 29,15,50,000
5. Corn flour 4,000 MT
@ Rs. 1,20,000/-Per MT Rs.48,00,00,000
6. Pop Corn2,500 MT
@ Rs. 150,000/-per MT Rs.37,50,00,000
7. Animal feed, 8,000 MT
@ Rs. 22,000/-per MT Rs.17,60,00,000
Total Rs.388,25,50,000
COST OF PRODUCTION
1. Working Capital for 1 year Rs.2,58,46,86,000
2. Interest @ 13.50% on T.C.I Rs.34,89,32,610
3. Depreciation @ 10.00% on buildings Rs. 65,00,000
4. Depreciation @ 20.00% on Plant
and Machinery Rs.13,34,00,000
Total Rs.307,35,18,610
• Profit=Revenue-Cost of Production
Rs.388,25,50,000 - Rs.307,35,18,610
=Rs.80,90,31,390
Profit sales ratio= (Profit/sales)*100
= (80,90,31,390/388,25,50000)*100
=20.83%
THANK YOU
REFERENCES
• http://www.ibef.org/industry/indian-food-industry.aspx
• Indiabusiness.nic.in, Ministry of Agriculture
• USDA, Directorate of Economics and
Statistics,Department of Agriculture and Cooperation,
2015
• Impact Assessment and Project Appraisal 2001, Dr.P.K.De
• WWW.INDIASTAT.COM
• : Registration & Stamp Department
Government Telangana and karnataka

Project Feasibility Report

  • 1.
    A PROJECT FEASIBILITYREPORT FOR A FOOD PROCESSING COMPANY Prepared by ANIL KUMAR
  • 2.
    OVER VIEW OFFOOD PROCESSING INDUSTRY Main export destinations for food products have been the Middle East and Southeast Asia. In FY16* India’s exports stood at US$ 1.3 billion. SOURCE: http://www.ibef.org/industry/indian-food-industry.aspx
  • 3.
    FOOD PROCESSING INDUSTRY’S CONTRIBUTIONTO GDP India ranks fifth in terms of production, consumption and exports. As per the latest data available, food processing sector is expected to reach US$ 258 billion in FY15. It constituted 14 per cent to India’s GDP through manufacturing. Source:http://www.ibef.org/industry/indian-food-industry.aspx
  • 4.
    MAJOR SEGMENTS OFFOOD PROCESSING INDUSTRIES India is the world’s 2nd largest producer of fruits and vegetables. produces 86.283 million tonnes of fruits, 167.058 million tonnes of vegetables during 2014 - 15 India is the largest producer of milk in the world, with the production estimated at 146.3 MT in FY15 India is the second largest producer of goat meat (0.91 MT in 2015). It is world’s 2nd largest egg producer (78.4 bn) & 3rd largest producer of broiler meat (3.8 MT) Total fish production is expected to reach 10.06 MT with Andhra Pradesh being the largest producer in the country estimated 1.9 MT during 2014-2015 India produces more than 200 mn Tonnes of different food grains. Total food grains production reached 252.68 MT in FY15. Source:Indiabusiness.nic.in, Ministry of Agriculture, Directorate of Statistics, APEDA, Indiastat, Meat & Poultry Processing Board
  • 5.
    PROJECT FEASIBILTY REPORTON MAIZE PROCESSING INDUSTRY ..?
  • 6.
    GLOBAL MAIZE PRODUCTION SOURCE:USDA, Directorate of Economics and Statistics, Department of Agriculture and Cooperation, 2015
  • 7.
    IMPORTING AND EXPORTING TOPMAIZE EXPORTING COUNTRIES TOP MAIZE IMPORTING COUNTRIES SOURCE: USDA, Directorate of Economics and Statistics, Department of Agriculture and Cooperation, 2015
  • 8.
    MAIZE PRODUCTION INDIA Maizeproduction is dominated by Andhra Pradesh and Karnataka, producing ~38 per cent of India’s maize in 2013-14 SOURCE: USDA, Directorate of Economics and Statistics, Department of Agriculture and Cooperation, 2015
  • 9.
    MAIZE PRODUCTION STATES SOURCE:KPMG, cutting through complexity,2014
  • 10.
    MAIZE PROCESSING INDUSTRY BYPRODUCTS Corn flour Pop corn Corn flakes Corn germ oil Corn starch
  • 11.
    Integrated Project AnalysisModel MARKET ANALYSIS Technical analysis Environmental impact assessment Social impact assessment Financial analysis Economic analysis PROJECT SELECTION FEASIBILITY REPORT Project approval Statutory approval Preliminary design Survey Source: Impact Assessment and Project Appraisal 2001, Dr.P.K.De
  • 12.
    TECHNICAL ANALYSIS • Materialsand inputs • Production Technology • Production Mix • Plant Capacity • Location and site • Machinery and Equipment • Project charts and Layouts
  • 13.
    FINANCIAL ANALYSIS Cost ofthe project.  Means of financing.  Estimate of sales and production.  Cost of production.  Working capital requirement.  Estimates of working results.  Breakeven analysis.  Projected cash flow statements.
  • 14.
    A.PLANT & MACHINERY EQUIPMENTQUANTITY Steeping tanks 8 Centrifugal Pumps 120M^3/H=8,50M^3/H=8 Heat Exchangers 8 Fluming System. 2 Compressor with Air Receiver 3 Sulphur Burner with all Accessories 1 Rotary Valve 1 Grind Mill 1 TANKS 18 Fibre washing screens 2 Agitator 4 A = Approximate. Cost of the maize processing machinery and equipments TOTAL COST=Rs.60,00,00,000
  • 15.
    B. HANDLING/HOLDING & STORAGEEQUIPMENTS • 1. M.S Storage Silo Cap: 50 tons 15 No. Rs. 1,25,00,000.00 • 2. Vibro-screen (Automatic) with 25 HP motor and accessories Cap: 30-50 tons/hour 2 No. Rs. 1,80,00,000.00 • 3. Automatic weighing, filling, & bags sealing machine 1 No. Rs. 1,50,00,000.00 • 4. Pipes, pumps, motors Airlock, structures & others Rs. 90,00,000.00 • 5. Electrical fittings, switchgear, MCB, cables, & others Rs. 50,00,000.00 Total cost =Rs.5,95,00,000.00 B = Approximate. Cost of the HANDLING/HOLDING & STORAGE EQUIPMENTS
  • 16.
    C. Lab TestingEquipment  Refractometer 1  TDS meter 1  PH meter 1  Water Distillation Unit 1  Laboratory Oven with Air Circulation 1  Scientific Balance 1  Heating menthal 1  Muffle Furnace 1  Electric Heating Plate 1  Thermometer 1  Bursting Strength Tester 1  Water Bath 1 (Microbiological Testing)  Rotary Shakers 1  Airflow Oven Drier 1  Laminar Airflow cabinet 1  Fat Extraction Unit  Spirit Lamp  Reagent Bottles  Glass Rod  Beakers  Volumetric Flask  Conical Flask  Pippete Stand  Measuring Cylinder  Burette  Pippete  Glass Funnel  Clamps & Stand  Pipetter(suction for pipette)  Silica beads  Sampling Probe  Burette Stand With Clamp  Tripod Stand  Funnel  Petri Plate  Silica Crucible  Glass beads  Protein Estimation unit C = Approximate. Cost of the lab equipments Total Cost Rs. 75,00,000.00
  • 17.
    Total cost ofmachinery and equipments Grand Total A+B+C = Rs. 60,00,00,000+ Rs. 5,95,00,000+ Rs.75,00,000 = Rs. 66,70,00,000 So, Total Rs.66,70,00,000
  • 18.
    LOCATION AND SITE 1.Telangana,Medak district(cost of one sq.yard=Rs250) it is located 95km from Hyderabad 2.Karnataka, Tumkuru district (1 sq.yard=Rs.550) It is located 85km from Bengaluru Source: Registration & Stamp Department Government Telangana and karnataka
  • 19.
    LAND AND BUILDINGCOST 1. Land 20 Acre @ 12,10,000/ACRE Rs.2,42,00,000 2. Site Development charges Rs. 20,00,000 3. Maize/Corn storage Silos 1000 Sq.mtr @ Rs. 7500/-per sq.mtrs. Rs. 75,00,000 4. Maize Steeping section 2500 sq.mtr @ Rs. 7500/-per sq.mtrs. Rs. 1,87,50,000 5. Wet Milling Section 2000 sq.mtrs. Rs. 7500/-sq.mtrs. Rs. 1,50,00,000 6.Raw Material Storage area 1000 sq.mtrs. @ Rs. 7500/- Rs. 75,00,000 7. Packaging material storage 800 sq.mtrs. @ Rs. 7500/-per sq.mtrs. Rs. 60,00,000 8.Truck Scale Weight bridge 500 sq.mt @ Rs. 6500/-per sq.mtrs. Rs. 32,50,000 9.Administrative office 500 sq.mtrs. @ Rs. 10000/-per sq.mtrs. Rs. 50,00,000 TOTAL=Rs,8,92,00,000
  • 20.
    OTHER FIXED COSTS 1.Water Electricity connection Rs. 12,50,000 2. Site fabrication work Rs. 15,00,000 3. Erection & Commissioning Rs. 25,00,000 4. Preliminary & Preoperative expenses Rs. 20,00,000 5. Office Furniture and equipment Rs. 20,00,000 6. DG Generator with accessories Rs. 1,20,00,000 ------------------------ TOTAL Rs. 2,12,50,000 ------------------------
  • 21.
    FIXED CAPITAL 1. LAND& BUILDING Rs. 8,92,00,000 2. PLANT & MACHINERY Rs. 66,70,00,000 3. OTHER FIXED ASSETS Rs. 2,12,50,000 ------------------------ TOTAL Rs. 77,74,50,000 ------------------------
  • 22.
    RAW MATERIALS/MONTH 1. Maize12,500 MT @ Rs. 16,000/-per MT Rs. 20,00,00,000 2. Sulphur 9.5 MT @ Rs. 45000/-per MT Rs. 4,27,500 3. Sulphuric acid 50 MT @ Rs. 8000/- per MT Rs. 4,00,000 4. Caustic soda 50 MT @ Rs. 28000/- per MT Rs. 14,00,000 5. Activated Carbon 5 MT @ Rs. 35000/-per MT Rs. 1,75,000 6. Soda Ash 25 MT @ Rs. 12500/-Per MT Rs. 3,12,500 7. Bone Black 8 MT @ Rs. 35000/-per MT Rs. 2,80,000 8. Lubricating Oils 1.8 MT Rs. 1,17,000 9. Fuel Oil 10000 Ltr. @ Rs. 60/-Ltr Rs. 6,00,000 ------------------------ TOTAL Rs. 20,37,12,000
  • 23.
    SALARY & WAGES/ MONTH 1. Managing Director 1 No. Rs. 80,000.00 2. Secretary 1 No. Rs. 25,000.00 3. Works Manager 1 No. Rs. 50,000.00 4. Accounts & Admn. Officer 1 No. Rs. 25,000.00 5. Chief Chemical Engineer 1 No. Rs. 40,000.00 6. Production & Maintenance superntendent 1 No. Rs. 25,000.00 7. Purchase Officer 1 No. Rs. 30,000.00 8. Sales Officers 4 No. Rs. 60,000.00 9. Asst.Admn.Officer 1 No. Rs. 20,000.00 10. Junior Chemical Engineers 3 No . Rs. 60,000.00 11. Chemists 3 No. Rs. 75,000.00 12. Mechanical Engineer 1 No. Rs. 25,000.00 13. Electrical Engineer 1 No. Rs. 18,000.00 14. Watch & Ward Officer 1 No. Rs. 8,000.00 15. Manager quality control 2 No. Rs. 60,000.00 16. Laboratory Assistant 2 No. Rs. 24,000.00 17. Supervisors 4 No. Rs. 60,000.00 18. Store Keepers 2 No. Rs. 20,000.00 19. Sales Assistants 2 No. Rs. 24,000.00 20. Stenographers 10 No. Rs. 1,00,000.00 21. Clerk-cum-typists 2 No. Rs. 17,000.00 22. Operators 25 No. Rs. 2,12,500.00 23. Skilled workers 24 No. Rs. 2,88,000.00 24. Unskilled workers 30 No. Rs. 2,25,000.00 25. Boiler Atendants 3 No. Rs. 30,000.00 26. Pump House Men 3 No. Rs. 30,000.00 27. Compressor Room Men 3 No. Rs. 30,000.00 28. Packers 4 No. Rs. 34,000.00 29. Driers 5 No. Rs. 45,000.00 30. Watchmen 4 No. Rs. 32,000.00 31. Peons 4 No. Rs. 30,000.00 32. Sweepers 4 No. Rs. 30,000.00 33. Helpers 10 No. Rs. 80,000.00 Total =Rs. 19,12,500
  • 24.
    UTILITIES AND OVERHEADS 1.Power Consumption of 408000 Kwatt hrs @ Rs. 7.00 per Kwatt hr. Rs. 28,56,000.00 2. Water Consumption of 65000 KLs @ Rs. 4.00 per KL Rs. 2,60,000.00 3. Fuel Oil 15 MT @ Rs. 60/-per Ltr Rs. 9,00,000.00 4. Transportation Rs. 15,00,000.00 5. Packaging material Rs. 22,50,000 6. Sales Promotion and Advertising Rs. 15,00,000.00 7. Administrative Expenses Rs. 5,00,000.00 ------------------------ TOTAL Rs. 97,66,000.00 -----------------------
  • 25.
    TOTAL WORKING CAPITAL TOTAL WORKING CAPITAL/MONTH RAW MATERIAL Rs. 20,37,12,000 SALARY & WAGES Rs. 19,12,500 UTILITIES & OVERHEADS Rs. 97,66,000 TOTAL Rs. 21,53,90,500  TOTAL WORKING CAPITAL/YEAR 21,53,90,500*12=Rs.258,46,86,000
  • 26.
    TOTAL CAPITAL INVESTMENTFOR PROJECT • TOTAL FIXED CAPITAL Rs. 77,74,50,000 • TOTAL WORKING CAPITAL FOR 12 MONTHS Rs.258,46,86,000 TOTAL RS.336,21,36,000
  • 27.
    EXPECTED PLANT CAPACITY 1.Starch 60,000 MT 2. Liquid Glucose 8,000 MT 3. Corn flakes 5,000 MT 4. Maize Germ 500 MT 5. Corn flour 4,000 MT 6. Pop Corn 2,500 MT 7. Animal feed, 8,000 MT • Basis No. of working days = 365 days/annum No. of shifts = 3 per day One shift = 8 hours
  • 28.
    TURN OVER/ANNUM 1. Starch60,000 MT @ Rs.28,000/- per MT. Rs.1,68,00,00,000 2. Liquid Glucose 8,000 MT @ Rs. 60,000/-MT Rs.48,00,00,000 3. Corn flakes 5,000 MT @ Rs. 80,000/-MT Rs.40,00,00,000 4. Maize Germ 500 MT @ Rs. 58,300/-Per MT Rs. 29,15,50,000 5. Corn flour 4,000 MT @ Rs. 1,20,000/-Per MT Rs.48,00,00,000 6. Pop Corn2,500 MT @ Rs. 150,000/-per MT Rs.37,50,00,000 7. Animal feed, 8,000 MT @ Rs. 22,000/-per MT Rs.17,60,00,000 Total Rs.388,25,50,000
  • 29.
    COST OF PRODUCTION 1.Working Capital for 1 year Rs.2,58,46,86,000 2. Interest @ 13.50% on T.C.I Rs.34,89,32,610 3. Depreciation @ 10.00% on buildings Rs. 65,00,000 4. Depreciation @ 20.00% on Plant and Machinery Rs.13,34,00,000 Total Rs.307,35,18,610
  • 30.
    • Profit=Revenue-Cost ofProduction Rs.388,25,50,000 - Rs.307,35,18,610 =Rs.80,90,31,390 Profit sales ratio= (Profit/sales)*100 = (80,90,31,390/388,25,50000)*100 =20.83%
  • 31.
  • 32.
    REFERENCES • http://www.ibef.org/industry/indian-food-industry.aspx • Indiabusiness.nic.in,Ministry of Agriculture • USDA, Directorate of Economics and Statistics,Department of Agriculture and Cooperation, 2015 • Impact Assessment and Project Appraisal 2001, Dr.P.K.De • WWW.INDIASTAT.COM • : Registration & Stamp Department Government Telangana and karnataka