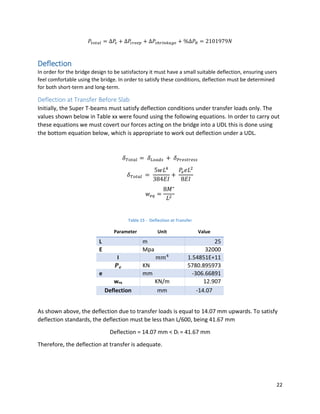
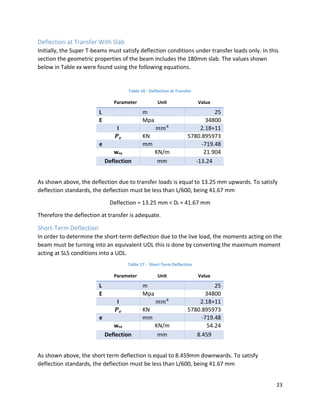
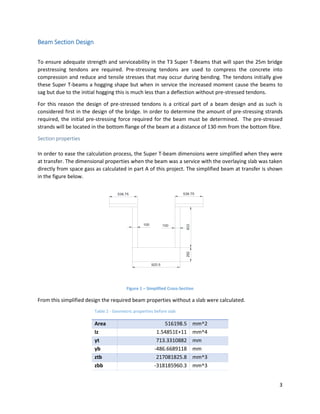
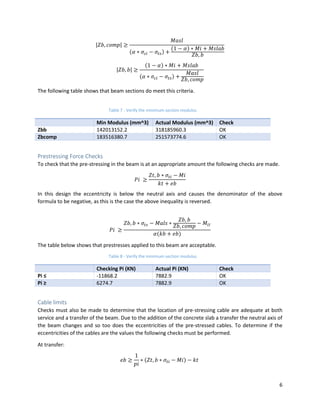
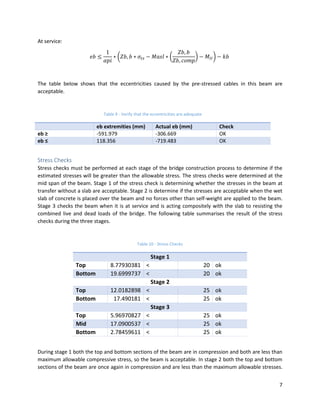
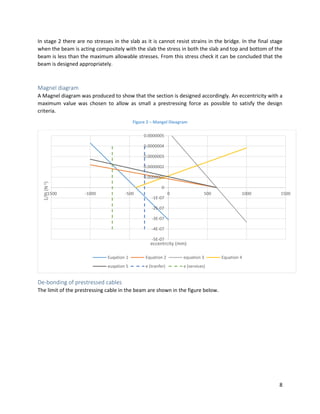
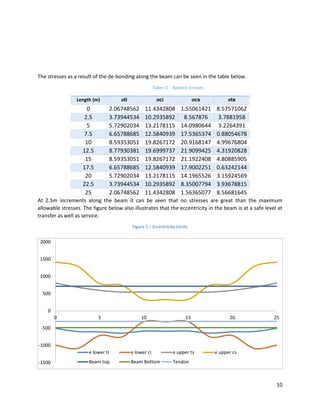
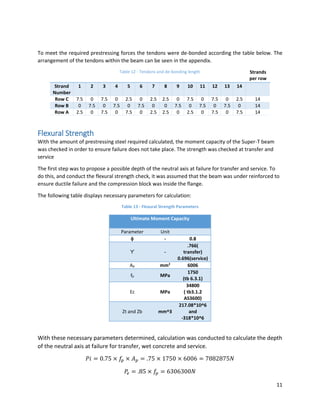
The beam section was designed with 42 prestressing strands located 130mm from the soffit. Section properties were calculated. Stress checks were performed at three stages to ensure stresses did not exceed allowable limits. A Magnel diagram showed the section satisfied design criteria with prestressing. Stirrup spacing of 150mm was chosen to resist shear. Total prestress losses were estimated at 26.67%. Deflections were calculated at various stages. A concrete slab was designed with reinforcement to span between beams.


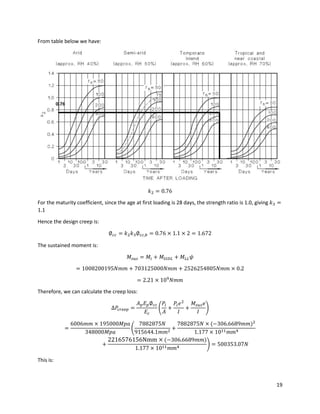
![16
Where v is the shear stress at the section centroid. This if found by knowing the principle tensile
stress.
𝜎1 = 0.33 ∗ √𝑓𝑐
′ = 2.33
𝜎 =
𝑃
𝐴 𝑔
= 8.61
And solving for v in the following equation;
𝑣 → 𝜎1 = √(
𝜎
2
)
2
+ 𝑣2 −
𝜎
2
→ 𝑣 = 5.05
Where the normal stress is equal:
Our capacity is then determined by the following equation:
𝜙𝑉𝑢𝑐 = 𝜙(𝑉𝑡 + 𝑃𝑣) = .7 × 1078.11 = 754.7𝑘𝑛
NOT OK
Flexural and web shear cracking checks have failed but smallest capacity governs.
Shear Reinforcement addition
Since our previous checks have failed, we must input shear reinforcements. We can first check if
minimum shear reinforcement is sufficient.
𝜙𝑉𝑢𝑚𝑖𝑛 = 0.7(𝑉𝑢𝑐 + 0.6 ∗ 𝑏 𝑣 ∗ 𝑑 𝑜) = 0.7 × (293.11 + .6 × 200 × 1550) = 310.175𝑘𝑛
𝜙𝑉𝑢𝑚𝑖𝑛 < 𝑉∗
, 𝑀𝑜𝑟𝑒 𝑡ℎ𝑎𝑛 𝑚𝑖𝑛𝑖𝑚𝑢𝑚 𝑟𝑒𝑖𝑛𝑓𝑜𝑟𝑐𝑒𝑚𝑒𝑛𝑡 𝑖𝑠 𝑟𝑒𝑞𝑢𝑖𝑟𝑒𝑑.
𝑉∗
= 𝜙𝑉𝑢 = 𝜙(𝑉𝑢𝑐 + 𝑉𝑢𝑠) → 𝑉𝑢𝑠 =
𝑉∗
𝜙
−
𝑉𝑢𝑐
𝜙
=
1125.38
0.7
+
293.11
. 7
= 1314.58𝑘𝑛
𝜃𝑣 = 𝜃 𝑣 = 30 + 15 [
𝑉∗
− 𝜙𝑉 𝑢𝑚𝑖𝑛
𝜙𝑉 𝑢𝑚𝑎𝑥 − 𝜙𝑉 𝑢𝑚𝑖𝑛
] = 45.085
Use 2 legs of R20 stirrups, resulting in an area of
𝐴 𝑠𝑣 = 628.32](https://image.slidesharecdn.com/f57acc25-8151-413e-9ba5-783e0628e093-150223174335-conversion-gate02/85/Project-2b-1-2-20-320.jpg)
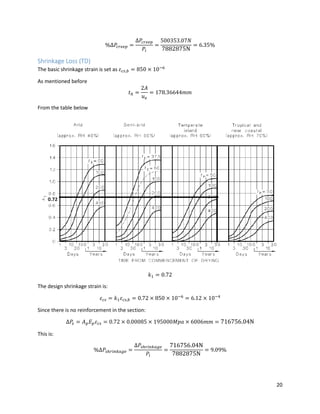
![21
Relaxation Loss (TD)
For typical strand:
𝑅 𝑏 = 2%
𝑘4 = 𝑙𝑜𝑔 [5.4𝑗
1
6⁄
] = 𝑙𝑜𝑔 [5.4 × 30 × 365
1
6⁄
] = 1.4056
Since 𝑓𝑝 = 0.75
𝑘5 = 1.25
𝑘6 = 1
Hence:
𝑅 = 𝑘4 𝑘5 𝑘6 𝑅 𝑏 = 1.4056 × 1.25 × 1 × 2% = 3.51%
%∆𝑃𝑅 = 𝑅 (1 −
∆𝜎𝑐+𝑠ℎ
𝜎 𝑝𝑖
) = 𝑅𝑃𝑖 = 3.51% × 8772875𝑁 = 277010.031N
Total loss
Total losses are thus:
%∆𝑃𝑡𝑜𝑡𝑎𝑙 = %∆𝑃𝜀 + 𝑅 + %∆𝑃𝑠ℎ𝑟𝑖𝑛𝑘𝑎𝑔𝑒 + %∆𝑃𝑐𝑟𝑒𝑒𝑝
= 7.71% + 6.35% + 9.09% + 3.51% = 26.76%
And the total loss is:](https://image.slidesharecdn.com/f57acc25-8151-413e-9ba5-783e0628e093-150223174335-conversion-gate02/85/Project-2b-1-2-25-320.jpg)