Download as PDF, PPTX


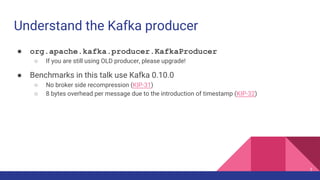
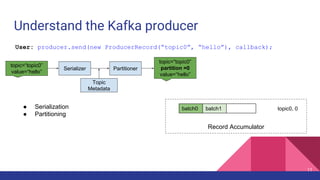
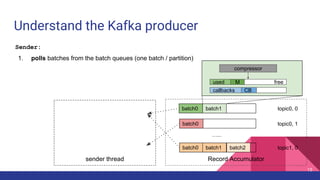
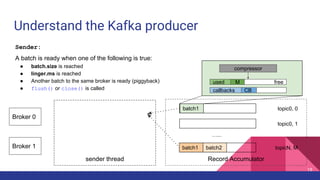

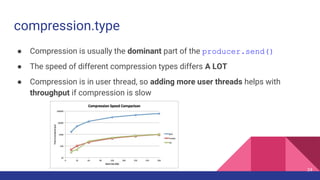
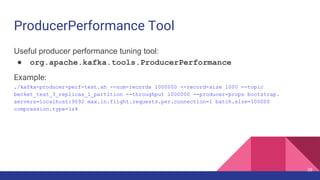
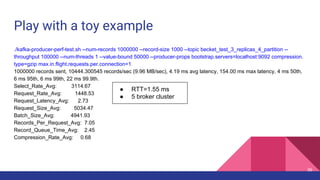
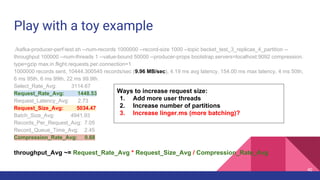
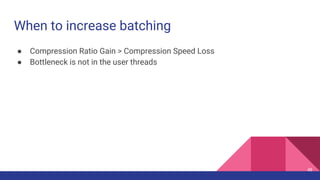
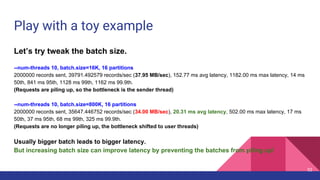
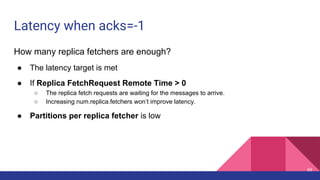
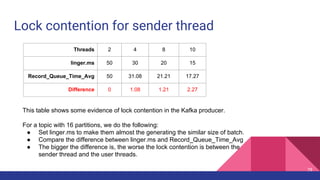
![Latency when acks=-1
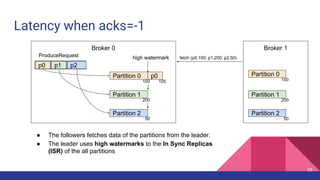
Broker 0 Broker 1
Partition 0
Partition 1
Partition 2
p0 p1 p2
ProduceRequest
Partition 0
Partition 1
Partition 2
1
2
Producer 3
4
ProduceResponse
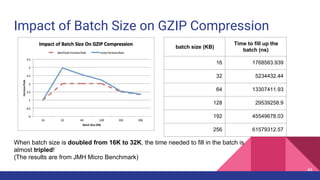
5
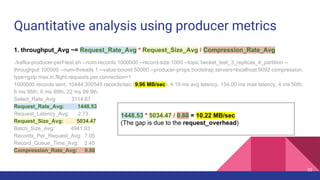
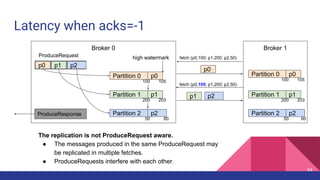
1. [Network] ProduceRequest Send Time
2. [Broker] ProduceRequest Queue Time
3. [Broker] ProduceRequest Local Time
4. [Broker] ProduceRequest Remote Time
5. [Broker] ProduceResponse Queue Time
6. [Broker] ProduceResponse Send Time
6
56](https://image.slidesharecdn.com/producerperformancetuningforapachekafka-160616173409/85/Producer-Performance-Tuning-for-Apache-Kafka-56-320.jpg)
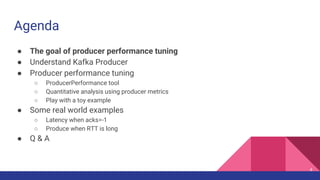
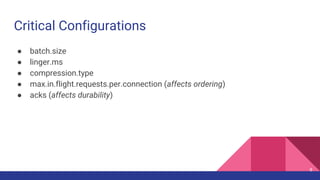
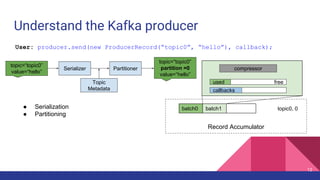
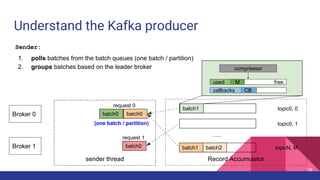
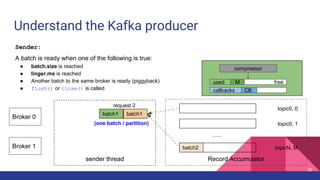
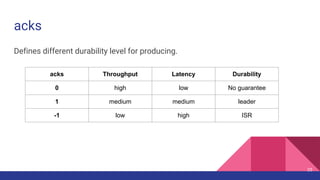
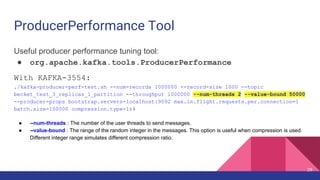
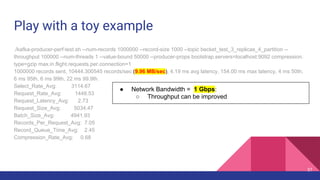
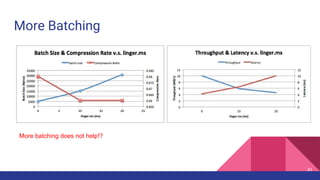
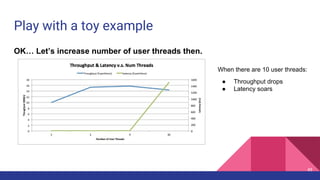
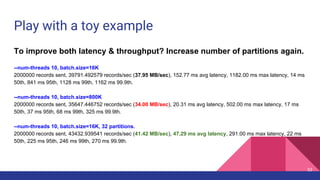
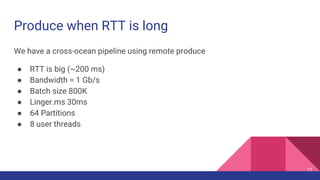
![Latency when acks=-1
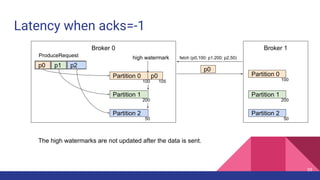
Broker 0 Broker 1
Partition 0
Partition 1
Partition 2
p0 p1 p2
ProduceRequest
Partition 0
Partition 1
Partition 2
1
2
Producer 3
4
ProduceResponse
5
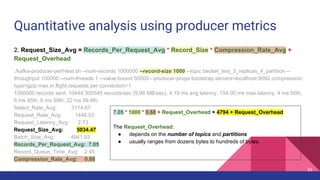
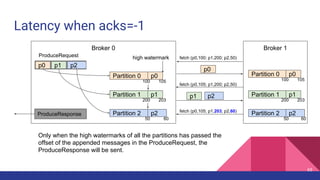
1. [Network] ProduceRequest Send Time
2. [Broker] ProduceRequest Queue Time
3. [Broker] ProduceRequest Local Time
4. [Broker] ProduceRequest Remote Time (Replication Time)
5. [Broker] ProduceResponse Queue Time
6. [Broker] ProduceResponse Send Time
6
57](https://image.slidesharecdn.com/producerperformancetuningforapachekafka-160616173409/85/Producer-Performance-Tuning-for-Apache-Kafka-57-320.jpg)


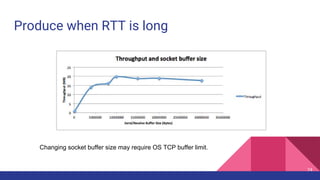


This document provides a comprehensive overview of producer performance tuning for Apache Kafka, emphasizing key tuning objectives to achieve desired throughput and latency while ensuring durability and ordering. It discusses various performance metrics, configuration parameters, and techniques for analyzing and optimizing producer performance through real-world examples and quantitative analysis. Additionally, it introduces a performance testing tool for Kafka producers to evaluate and measure their effectiveness.


![[WSO2Con EU 2017] Keynote: Mobile Identity in the Digital Economy](https://cdn.slidesharecdn.com/ss_thumbnails/20171108wso2conferencemarieaustenaagsma-171108073649-thumbnail.jpg?width=640&height=640&fit=bounds)


![[WSO2Con EU 2017] The Win-Win-Win of Water Authority HHNK](https://cdn.slidesharecdn.com/ss_thumbnails/wso2con2017-hhnk-171108114725-thumbnail.jpg?width=640&height=640&fit=bounds)