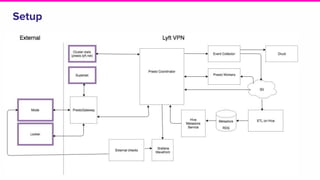
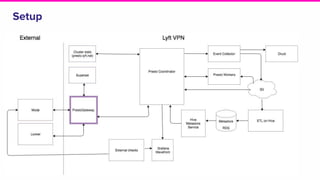
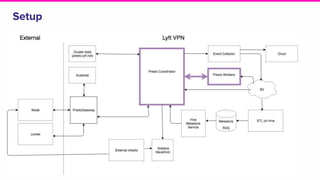
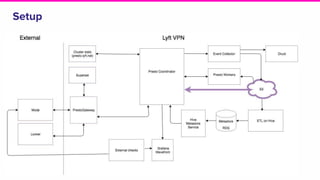
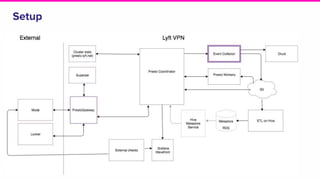
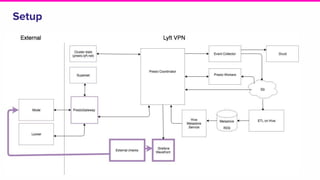
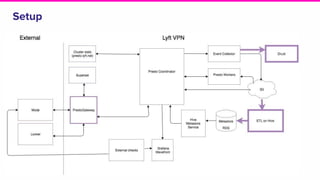
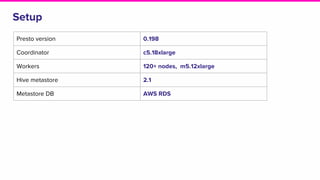
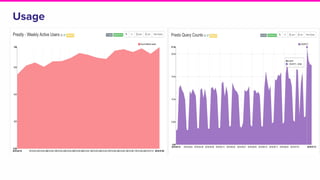
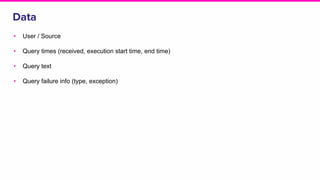
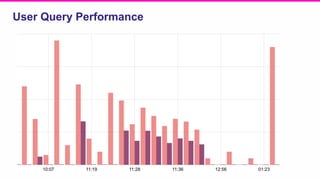
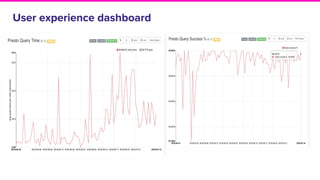
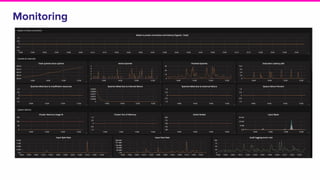
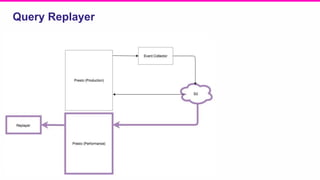
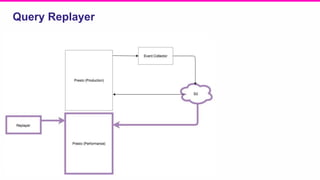
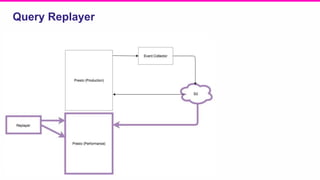
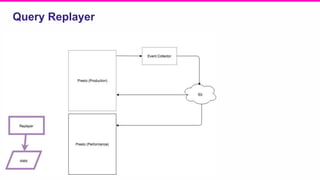
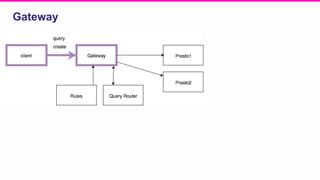
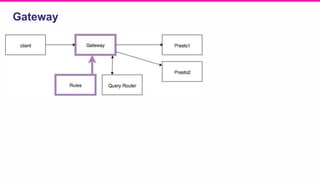
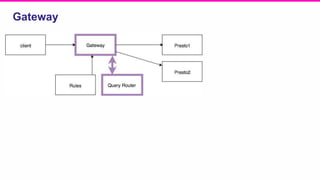
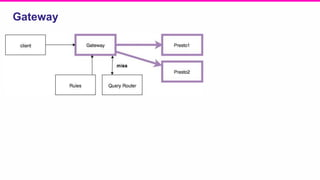
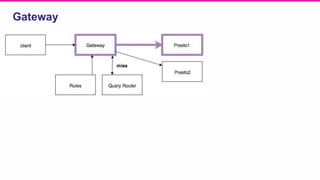
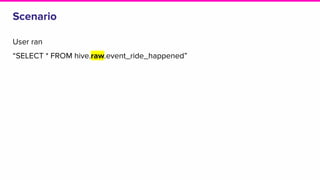
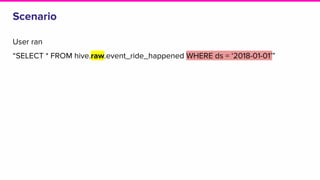
Nishant Rayan
Analytics Infra Team
Presto @ Lyft
Agenda
4
History
Usage
Setup
Eventing & Monitoring
Replayer
Gateway
Query protection
Future work
Q&A
1
2
3
4
5
6
7
8
9
History
6
History
Redshift
(Interactive &
Batch)
2013
7
History
Redshift
2013
Redshift
(Interactive &
Batch)
Hive (Batch)
2016
8
History
Redshift
2013
Redshift
Hive
2016
Redshift (Batch /
Interactive)
Hive (Batch)
Presto (Interactive)
2017
9
History
Redshift
2013
Redshift
Hive
2016
Redshift
Hive
Presto
2017
Redshift (Batch)
Hive (Batch)
Presto (Interactive)
Druid (Interactive)
2018
Presto Setup
Setup
Setup
Setup
Setup
Setup
Setup
Setup
Setup
Setup
Presto version 0.198
Coordinator c5.18xlarge
Workers 120+ nodes, m5.12xlarge
Hive metastore 2.1
Metastore DB AWS RDS
Setup
Data
● Data store - S3 - >> 10 PB
● Parquet format
● Data Partitioned by date
● 50K+ tables
Usage
Traffic patterns
• Readonly
• Mostly Adhoc queries (95%)
• Peak during business hours
• Scheduled reports
Event Collection
Scenario
Why are my presto queries very slow today?
Causes
● Maxed out resources
● Bad query
Resource utilization
Maxed out resources -> High query queue time
Requirement
Graph that shows user’s query queue time
Data
• User / Source
• Query times (received, execution start time, end time)
• Query text
• Query failure info (type, exception)
Event Collection
Mechanism
• Leverage presto plugin
• Collect rich presto query events
• Sent to s3 as json
• Generate usage / failure report
User Query Performance
User experience dashboard
More use cases...
• Most popular presto query tool (mode vs looker vs superset vs cmd line)
• Queries affected during downtime and cluster restarts
• Most popular table users like to query using presto
• Most expensive query
• Top users of presto
Monitoring
System Metrics
• Host level metrics (CPU, mem)
Cluster Metrics
• Active nodes
• Cluster memory
Query metrics
• Failures (internal, external, IRE)
• Active, finished query counts
• Beacon query status
Monitoring
Replayer
Scenario
A lot of presto queries timed out . What happened ? and How to fix it ?
Causes
● Long running queries
● Coordinator busy
Requirement
● Play queries in the exact same order
● Mimic actual users firing queries
Query Replayer
Query Replayer
Query Replayer
Query Replayer
Query Replayer
More use cases
● Shadow mode for upgrade confidence
● Perf testing resource group policies
Benchmarking
Other tools
• Presto – Verifier
• Compare perf of 2 clusters
• Upgrade version testing
• Benchto
• Run set of queries
• Save performance numbers and compare
Gateway
Scenario
Scheduled queries don’t require the same SLA as adhoc queries
Scenario
…. but they do affect adhoc query experience
Solution
Use separate cluster for adhoc and scheduled queries
Problem
But not all clients support transparent query routing
Requirement
Route queries based on rules
Route query status checks to right cluster
Gateway
Gateway
Gateway
Gateway
Gateway
Gateway
Gateway
Gateway
Gateway
Gateway
Query Protection
Scenario
User ran
“SELECT * FROM hive.raw.event_ride_happened”
Scenario
User ran
“SELECT * FROM hive.raw.event_ride_happened”
Scenario
User ran
“SELECT * FROM hive.raw.event_ride_happened WHERE ds = ‘2018-01-01’”
Problem
● Scans large volumes of data
● Starves other queries
● Times out
Requirement
● Stop bad queries early
● Pluggable rule set
Query Protection
● Leverage presto plugin
● Presto parser to extract info from query
● Apply heuristic rules to block
● Query on table without partition
● Query did not specify partition
● Non-standard query access (CLI etc..)
● Previously known bad queries
Gateway Replayer
Query
Protection
Single point of entry for
multiple presto clusters
Reproduce issues in
performance
Block bad queries
Takeaways
Future work
• Improve Gateway
• Caching
• Benchmark infra
• Presto K8s
• Open source replayer, audit framework, gateway
Q & A
Team
Thank You
eng.lyft.net
contact-nishant@lyft.com

Presto Summit 2018 - 07 - Lyft