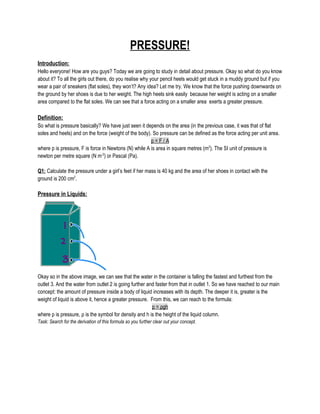
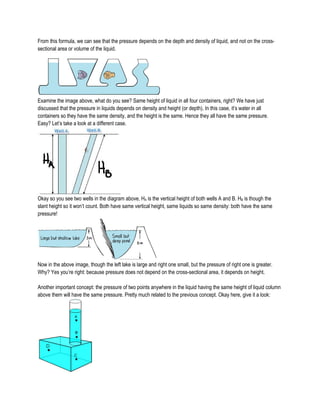
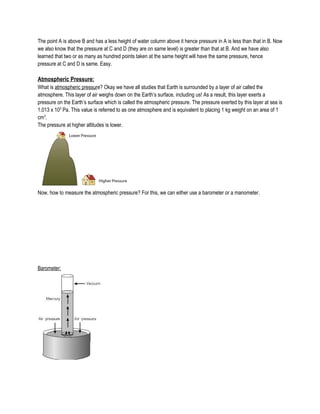
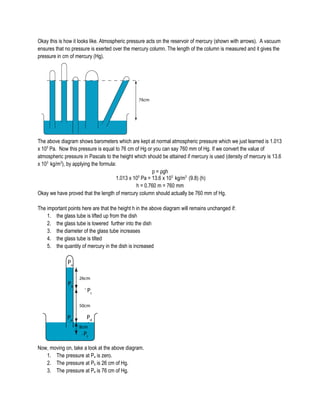
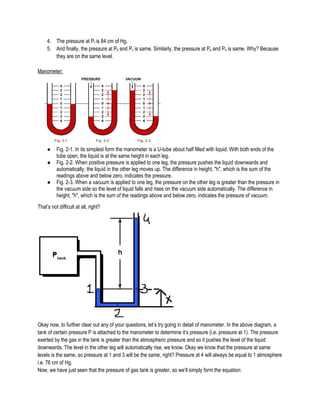
This presentation is all about how to calculate the acceleration due to gravity with formulae and pictures. the whole procedure is explained to you in a very elegant manner. Hope this is helpful to you. for any further details and information wait for my next upload.
PLEASE NOTE THIS IS PART-1
By Referring or said Learning This Presentation You Can Clear Your Basics Fundamental Doubts about Fluid Mechanics. In this Presentation You Will Learn about Fluid Pressure, Pressure at Point, Pascal's Law, Types Of Pressure and Pressure Measurements.
The ability to recreate computational results with minimal effort and actionable metrics provides a solid foundation for scientific research and software development. When people can replicate an analysis at the touch of a button using open-source software, open data, and methods to assess and compare proposals, it significantly eases verification of results, engagement with a diverse range of contributors, and progress. However, we have yet to fully achieve this; there are still many sociotechnical frictions.
Inspired by David Donoho's vision, this talk aims to revisit the three crucial pillars of frictionless reproducibility (data sharing, code sharing, and competitive challenges) with the perspective of deep software variability.
Our observation is that multiple layers — hardware, operating systems, third-party libraries, software versions, input data, compile-time options, and parameters — are subject to variability that exacerbates frictions but is also essential for achieving robust, generalizable results and fostering innovation. I will first review the literature, providing evidence of how the complex variability interactions across these layers affect qualitative and quantitative software properties, thereby complicating the reproduction and replication of scientific studies in various fields.
I will then present some software engineering and AI techniques that can support the strategic exploration of variability spaces. These include the use of abstractions and models (e.g., feature models), sampling strategies (e.g., uniform, random), cost-effective measurements (e.g., incremental build of software configurations), and dimensionality reduction methods (e.g., transfer learning, feature selection, software debloating).
I will finally argue that deep variability is both the problem and solution of frictionless reproducibility, calling the software science community to develop new methods and tools to manage variability and foster reproducibility in software systems.
Exposé invité Journées Nationales du GDR GPL 2024
(May 29th, 2024) Advancements in Intravital Microscopy- Insights for Preclini...Scintica Instrumentation
Intravital microscopy (IVM) is a powerful tool utilized to study cellular behavior over time and space in vivo. Much of our understanding of cell biology has been accomplished using various in vitro and ex vivo methods; however, these studies do not necessarily reflect the natural dynamics of biological processes. Unlike traditional cell culture or fixed tissue imaging, IVM allows for the ultra-fast high-resolution imaging of cellular processes over time and space and were studied in its natural environment. Real-time visualization of biological processes in the context of an intact organism helps maintain physiological relevance and provide insights into the progression of disease, response to treatments or developmental processes.
In this webinar we give an overview of advanced applications of the IVM system in preclinical research. IVIM technology is a provider of all-in-one intravital microscopy systems and solutions optimized for in vivo imaging of live animal models at sub-micron resolution. The system’s unique features and user-friendly software enables researchers to probe fast dynamic biological processes such as immune cell tracking, cell-cell interaction as well as vascularization and tumor metastasis with exceptional detail. This webinar will also give an overview of IVM being utilized in drug development, offering a view into the intricate interaction between drugs/nanoparticles and tissues in vivo and allows for the evaluation of therapeutic intervention in a variety of tissues and organs. This interdisciplinary collaboration continues to drive the advancements of novel therapeutic strategies.
Seminar of U.V. Spectroscopy by SAMIR PANDASAMIR PANDA
Spectroscopy is a branch of science dealing the study of interaction of electromagnetic radiation with matter.
Ultraviolet-visible spectroscopy refers to absorption spectroscopy or reflect spectroscopy in the UV-VIS spectral region.
Ultraviolet-visible spectroscopy is an analytical method that can measure the amount of light received by the analyte.
Observation of Io’s Resurfacing via Plume Deposition Using Ground-based Adapt...Sérgio Sacani
Since volcanic activity was first discovered on Io from Voyager images in 1979, changes
on Io’s surface have been monitored from both spacecraft and ground-based telescopes.
Here, we present the highest spatial resolution images of Io ever obtained from a groundbased telescope. These images, acquired by the SHARK-VIS instrument on the Large
Binocular Telescope, show evidence of a major resurfacing event on Io’s trailing hemisphere. When compared to the most recent spacecraft images, the SHARK-VIS images
show that a plume deposit from a powerful eruption at Pillan Patera has covered part
of the long-lived Pele plume deposit. Although this type of resurfacing event may be common on Io, few have been detected due to the rarity of spacecraft visits and the previously low spatial resolution available from Earth-based telescopes. The SHARK-VIS instrument ushers in a new era of high resolution imaging of Io’s surface using adaptive
optics at visible wavelengths.
Professional air quality monitoring systems provide immediate, on-site data for analysis, compliance, and decision-making.
Monitor common gases, weather parameters, particulates.
Salas, V. (2024) "John of St. Thomas (Poinsot) on the Science of Sacred Theol...Studia Poinsotiana
I Introduction
II Subalternation and Theology
III Theology and Dogmatic Declarations
IV The Mixed Principles of Theology
V Virtual Revelation: The Unity of Theology
VI Theology as a Natural Science
VII Theology’s Certitude
VIII Conclusion
Notes
Bibliography
All the contents are fully attributable to the author, Doctor Victor Salas. Should you wish to get this text republished, get in touch with the author or the editorial committee of the Studia Poinsotiana. Insofar as possible, we will be happy to broker your contact.
This presentation explores a brief idea about the structural and functional attributes of nucleotides, the structure and function of genetic materials along with the impact of UV rays and pH upon them.
Nucleic Acid-its structural and functional complexity.
Pressure
1. PRESSURE!
Introduction:
Hello everyone! How are you guys? Today we are going to study in detail about pressure. Okay so what do you know
about it? To all the girls out there, do you realise why your pencil heels would get stuck in a muddy ground but if you
wear a pair of sneakers (flat soles), they won’t? Any idea? Let me try. We know that the force pushing downwards on
the ground by her shoes is due to her weight. The high heels sink easily because her weight is acting on a smaller
area compared to the flat soles. We can see that a force acting on a smaller area exerts a greater pressure.
Definition:
So what is pressure basically? We have just seen it depends on the area (in the previous case, it was that of flat
soles and heels) and on the force (weight of the body). So pressure can be defined as the force acting per unit area.
p = F / A
where p is pressure, F is force in Newtons (N) while A is area in square metres (m2
). The SI unit of pressure is
newton per metre square (N m-2
) or Pascal (Pa).
Q1: Calculate the pressure under a girl’s feet if her mass is 40 kg and the area of her shoes in contact with the
ground is 200 cm2
.
Pressure in Liquids:
Okay so in the above image, we can see that the water in the container is falling the fastest and furthest from the
outlet 3. And the water from outlet 2 is going further and faster from that in outlet 1. So we have reached to our main
concept: the amount of pressure inside a body of liquid increases with its depth. The deeper it is, greater is the
weight of liquid is above it, hence a greater pressure. From this, we can reach to the formula:
p = ρgh
where p is pressure, ρ is the symbol for density and h is the height of the liquid column.
Task: Search for the derivation of this formula so you further clear out your concept.
2. From this formula, we can see that the pressure depends on the depth and density of liquid, and not on the cross-
sectional area or volume of the liquid.
ts.
Examine the image above, what do you see? Same height of liquid in all four containers, right? We have just
discussed that the pressure in liquids depends on density and height (or depth). In this case, it’s water in all
containers so they have the same density, and the height is the same. Hence they all have the same pressure.
Easy? Let’s take a look at a different case.
Okay so you see two wells in the diagram above, HA is the vertical height of both wells A and B. HB is though the
slant height so it won’t count. Both have same vertical height, same liquids so same density: both have the same
pressure!
Now in the above image, though the left lake is large and right one small, but the pressure of right one is greater.
Why? Yes you’re right: because pressure does not depend on the cross-sectional area, it depends on height.
Another important concept: the pressure of two points anywhere in the liquid having the same height of liquid column
above them will have the same pressure. Pretty much related to the previous concept. Okay here, give it a look:
3. The point A is above B and has a less height of water column above it hence pressure in A is less than that in B. Now
we also know that the pressure at C and D (they are on same level) is greater than that at B. And we have also
learned that two or as many as hundred points taken at the same height will have the same pressure, hence
pressure at C and D is same. Easy.
Atmospheric Pressure:
What is atmospheric pressure? Okay we have all studies that Earth is surrounded by a layer of air called the
atmosphere. This layer of air weighs down on the Earth’s surface, including us! As a result, this layer exerts a
pressure on the Earth’s surface which is called the atmospheric pressure. The pressure exerted by this layer at sea is
1.013 x 10⁵
Pa. This value is referred to as one atmosphere and is equivalent to placing 1 kg weight on an area of 1
cm3
.
The pressure at higher altitudes is lower.
Now, how to measure the atmospheric pressure? For this, we can either use a barometer or a manometer.
Barometer:
4. Okay this is how it looks like. Atmospheric pressure acts on the reservoir of mercury (shown with arrows). A vacuum
ensures that no pressure is exerted over the mercury column. The length of the column is measured and it gives the
pressure in cm of mercury (Hg).
The above diagram shows barometers which are kept at normal atmospheric pressure which we just learned is 1.013
x 105
Pa. Now this pressure is equal to 76 cm of Hg or you can say 760 mm of Hg. If we convert the value of
atmospheric pressure in Pascals to the height which should be attained if mercury is used (density of mercury is 13.6
x 103
kg/m3
), by applying the formula:
p = ρgh
1.013 x 10⁵
Pa = 13.6 x 10³
kg/m3
(9.8) (h)
h = 0.760 m = 760 mm
Okay we have proved that the length of mercury column should actually be 760 mm of Hg.
The important points here are that the height h in the above diagram will remains unchanged if:
1. the glass tube is lifted up from the dish
2. the glass tube is lowered further into the dish
3. the diameter of the glass tube increases
4. the glass tube is tilted
5. the quantity of mercury in the dish is increased
Now, moving on, take a look at the above diagram.
1. The pressure at Pa is zero.
2. The pressure at Pb is 26 cm of Hg.
3. The pressure at Pe is 76 cm of Hg.
5. 4. The pressure at Pf is 84 cm of Hg.
5. And finally, the pressure at Pb and Pc is same. Similarly, the pressure at Pe and Pd is same. Why? Because
they are on the same level.
Manometer:
● Fig. 2-1. In its simplest form the manometer is a U-tube about half filled with liquid. With both ends of the
tube open, the liquid is at the same height in each leg.
● Fig. 2-2. When positive pressure is applied to one leg, the pressure pushes the liquid downwards and
automatically, the liquid in the other leg moves up. The difference in height, "h", which is the sum of the
readings above and below zero, indicates the pressure.
● Fig. 2-3. When a vacuum is applied to one leg, the pressure on the other leg is greater than the pressure in
the vacuum side so the level of liquid falls and rises on the vacuum side automatically. The difference in
height, "h", which is the sum of the readings above and below zero, indicates the pressure of vacuum.
That’s not difficult at all, right?
Okay now, to further clear out any of your questions, let’s try going in detail of manometer. In the above diagram, a
tank of certain pressure P is attached to the manometer to determine it’s pressure (i.e. pressure at 1). The pressure
exerted by the gas in the tank is greater than the atmospheric pressure and so it pushes the level of the liquid
downwards. The level in the other leg will automatically rise, we know. Okay we know that the pressure at same
levels is the same, so pressure at 1 and 3 will be the same, right? Pressure at 4 will always be equal to 1 atmosphere
i.e. 76 cm of Hg.
Now, we have just seen that the pressure of gas tank is greater, so we’ll simply form the equation:
6. Ptank i.e. at 1 = (P at 4 i.e. atmospheric pressure) + (ρgh using height “h”)
While using ρgh, we’ll apply the density of the liquid used, g is constant and height h. Notw that it is if you want the
pressure in Pascals. If you simply want it in cm of Hg then add the height h in cm to 76 cm of Hg at 4.
One other thing, the pressure at 2, what would that be? It has the same concept: it has a greatest pressure due to
greatest depth, so it’s be the pressure at 3 (or 1) plus the height x. Note the pressure will be in cm of Hg.
Q1. Calculate the pressure of the trapped gas in cm of Hg given that the atmospheric pressure is 76 cm of Hg.
Answers:
Q1. 80.7 cm of Hg
7. Ptank i.e. at 1 = (P at 4 i.e. atmospheric pressure) + (ρgh using height “h”)
While using ρgh, we’ll apply the density of the liquid used, g is constant and height h. Notw that it is if you want the
pressure in Pascals. If you simply want it in cm of Hg then add the height h in cm to 76 cm of Hg at 4.
One other thing, the pressure at 2, what would that be? It has the same concept: it has a greatest pressure due to
greatest depth, so it’s be the pressure at 3 (or 1) plus the height x. Note the pressure will be in cm of Hg.
Q1. Calculate the pressure of the trapped gas in cm of Hg given that the atmospheric pressure is 76 cm of Hg.
Answers:
Q1. 80.7 cm of Hg