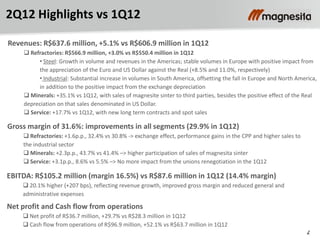
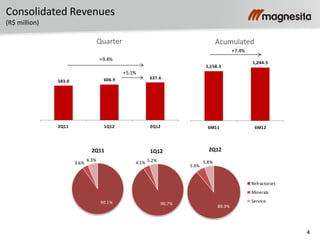
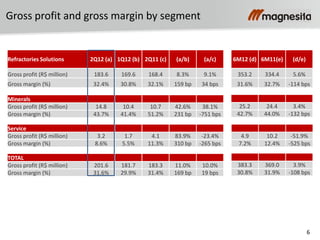
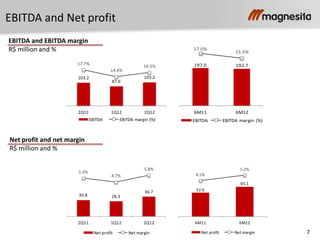
1
Earnings call – 2Q12
August 10, 2012
2
2Q12 Highlights vs 1Q12
Revenues: R$637.6 million, +5.1% vs R$606.9 million in 1Q12
 Refractories: R$566.9 million, +3.0% vs R$550.4 million in 1Q12
• Steel: Growth in volume and revenues in the Americas; stable volumes in Europe with positive impact from
the appreciation of the Euro and US Dollar against the Real (+8.5% and 11.0%, respectively)
• Industrial: Substantial increase in volumes in South America, offsetting the fall in Europe and North America,
in addition to the positive impact from the exchange depreciation
 Minerals: +35.1% vs 1Q12, with sales of magnesite sinter to third parties, besides the positive effect of the Real
depreciation on that sales denominated in US Dollar.
 Service: +17.7% vs 1Q12, with new long term contracts and spot sales
Gross margin of 31.6%: improvements in all segments (29.9% in 1Q12)
 Refractories: +1.6p.p., 32.4% vs 30.8% -> exchange effect, performance gains in the CPP and higher sales to
the industrial sector
 Minerals: +2.3p.p., 43.7% vs 41.4% –> higher participation of sales of magnesita sinter
 Service: +3.1p.p., 8.6% vs 5.5% –> No more impact from the unions renegotiation in the 1Q12
EBITDA: R$105.2 million (margin 16.5%) vs R$87.6 million in 1Q12 (14.4% margin)
 20.1% higher (+207 bps), reflecting revenue growth, improved gross margin and reduced general and
administrative expenses
Net profit and Cash flow from operations
 Net profit of R$36.7 million, +29.7% vs R$28.3 million in 1Q12
 Cash flow from operations of R$96.9 million, +52.1% vs R$63.7 million in 1Q12
3
2Q12 Highlights vs 2Q11
Revenues: R$637.6 million, +9.4% vs R$583.0 million in 2Q11
 Refractories: R$566.9 million, +7.9% vs R$525.3 million in 2Q11
• Steel: Fall in volumes due primarily to drop of steel production in Europe (-5.5%) and Brazil (-7.2%), offset
by the appreciation of the Euro and US Dollar against the Real (+9.5% and 23.0%, respectively)
• Industrial: Substantial increase in volumes in South America, mainly cement, in addition to the impact of
the currency, which offset the fall in volumes in Europe and North America
 Minerals: +61.9% vs 2Q11, with sales of magnesite sinter to third parties, besides the effect of the Real
depreciation on that sales denominated in US Dollar.
 Service: +0.2% vs 2Q11
Gross margin of 31.6%: 19 bps higher than 2Q11
 Refractories: +34 bps, 32.4% vs 32.1% -> exchange effect, performance gains in the CPP and higher sales to the
industrial offset higher raw material prices
 Minerals: -7.5% p.p., 43.7% vs 51.2% –> spot sales of high margin dolomite sinter in 2Q11
 Service: -2.65p.p., 8.6% vs 11.3% –> Reduction of scope of contracts with higher profitability
EBITDA: R$105.2 million (margin 16.5%) vs R$103.2 million in 2Q11 (margin 17.7%)
 2Q11 positively impacted by a reversal of provision for expenses with health insurance plans in U.S. (R$10.8
million)
Net profit and Cash flow from operations
 Net profit of R$36.7 million, +19.4% vs R$30.8 million in 2Q11
 Cash flow from operations of R$96.9 million, +12.9% vs R$85.8 million in 2Q11
4
1,158.3
1,244.5
6M11 6M12
+7.4%
Consolidated Revenues
(R$ million)
Quarter Acumulated
583.0 606.9 637.6
2Q11 1Q12 2Q12
+9.4%
+5.1%
88.9%
5.3%
5.8%
2Q12
Refractories
Minerals
Service
90.7%
4.1% 5.2%
1Q12
90.1%
3.6%
6.3%
2Q11
5
Revenues – Refractories Solutions
(R$ million)
Steel Industrial
Quarter Acumulated
86.3% 82.3% 83.7%
13.7% 17.7% 16.3%
2Q11 1Q12 2Q12
Steel Industrial
525.3 550.4 566.9
3.0%
7.9%
86.3% 82.3%
13.7%
17.7%
6M11 6M12
Steel Industrial
1,021.1
1,117.3
9.4%
453.3 453.2 474.5
2Q11 1Q12 2Q12
4.7%
4.7%
872.8
927.7
6M11 6M12
6.3%
71.9
97.2 92.4
2Q11 1Q12 2Q12
28,4%
-5,0%
148.2
189.6
6M11 6M12
27,9%
6
Gross profit and gross margin by segment
Minerals
Gross profit (R$ million) 14.8 10.4 10.7 42.6% 38.1%
Gross margin (%) 43.7% 41.4% 51.2% 231 bp -751 bps
Service
Gross profit (R$ million) 3.2 1.7 4.1 83.9% -23.4%
Gross margin (%) 8.6% 5.5% 11.3% 310 bp -265 bps
TOTAL
Gross profit (R$ million) 201.6 181.7 183.3 11.0% 10.0%
Gross margin (%) 31.6% 29.9% 31.4% 169 bp 19 bps
Refractories Solutions 2Q12 (a) 1Q12 (b) 2Q11 (c) (a/b) (a/c)
Gross profit (R$ million) 183.6 169.6 168.4 8.3% 9.1%
Gross margin (%) 32.4% 30.8% 32.1% 159 bp 34 bps
6M12 (d) 6M11(e) (d/e)
353.2 334.4 5.6%
31.6% 32.7% -114 bps
25.2 24.4 3.4%
42.7% 44.0% -132 bps
4.9 10.2 -51.9%
7.2% 12.4% -525 bps
383.3 369.0 3.9%
30.8% 31.9% -108 bps
7
EBITDA and Net profit
EBITDA and EBITDA margin
R$ million and %
Net profit and net margin
R$ million and %
197.0 192.7
17.0%
15.5%
6M11 6M12
EBITDA EBITDA margin (%)
30.8 28.3
36.7
5.3%
4.7%
5.8%
2Q11 1Q12 2Q12
Net profit Net margin
52.6
65.1
4.5%
5.2%
6M11 6M12
Net profit Net margin
103.2
87.6
105.2
17.7%
14.4%
16.5%
2Q11 1Q12 2Q12
EBITDA EBITDA margin (%)
8
Cash flow from operations, CAPEX and Cash cycle
Cash flow and CAPEX
R$ million
Cash conversion cycle
Days
85.8
63.7
96.9
25.7
55.7
62.5
2Q11 1Q12 2Q12
Cash flow from operations CAPEX
272.2
160.6
47.3
118.2
6M11 6M12
Cash flow from operations CAPEX
146 146
138 143 143
65
76 79
67 69
129
144
138
131 131
81 78 80 79 82
2Q11 3Q11 4Q11 1Q12 2Q12
Cash conversion cycle Suppliers Inventories Clients
9
Debt and leverage
Net debt and leverage
R$ million
Debt profile
854.0 900.2 957.3 968.0
1,060.0
790.6 787.7 761.2 791.8 819.1
2.1 x 2.1 x
2.2 x 2.3 x
2.5 x
2Q11 3Q11 4Q11 1Q12 2Q12
Net debt Workingcapital Net debt/EBITDA
3.5%
96.5%
Shortterm Longterm
20.9%
79.1%
Local currency (R$) Foreign currencies
10
Investor Relations contacts:
Flávio Rezende Barbosa
CFO and Investor Relations Officer
Daniel Domiciano Silva
Investor Relations
Phone: +55 11 3152-3202/3241
ri@magnesita.com
www.magnesita.com

2 q12 presentation_en

  • 1.
    1 Earnings call –2Q12 August 10, 2012
  • 2.
    2 2Q12 Highlights vs1Q12 Revenues: R$637.6 million, +5.1% vs R$606.9 million in 1Q12  Refractories: R$566.9 million, +3.0% vs R$550.4 million in 1Q12 • Steel: Growth in volume and revenues in the Americas; stable volumes in Europe with positive impact from the appreciation of the Euro and US Dollar against the Real (+8.5% and 11.0%, respectively) • Industrial: Substantial increase in volumes in South America, offsetting the fall in Europe and North America, in addition to the positive impact from the exchange depreciation  Minerals: +35.1% vs 1Q12, with sales of magnesite sinter to third parties, besides the positive effect of the Real depreciation on that sales denominated in US Dollar.  Service: +17.7% vs 1Q12, with new long term contracts and spot sales Gross margin of 31.6%: improvements in all segments (29.9% in 1Q12)  Refractories: +1.6p.p., 32.4% vs 30.8% -> exchange effect, performance gains in the CPP and higher sales to the industrial sector  Minerals: +2.3p.p., 43.7% vs 41.4% –> higher participation of sales of magnesita sinter  Service: +3.1p.p., 8.6% vs 5.5% –> No more impact from the unions renegotiation in the 1Q12 EBITDA: R$105.2 million (margin 16.5%) vs R$87.6 million in 1Q12 (14.4% margin)  20.1% higher (+207 bps), reflecting revenue growth, improved gross margin and reduced general and administrative expenses Net profit and Cash flow from operations  Net profit of R$36.7 million, +29.7% vs R$28.3 million in 1Q12  Cash flow from operations of R$96.9 million, +52.1% vs R$63.7 million in 1Q12
  • 3.
    3 2Q12 Highlights vs2Q11 Revenues: R$637.6 million, +9.4% vs R$583.0 million in 2Q11  Refractories: R$566.9 million, +7.9% vs R$525.3 million in 2Q11 • Steel: Fall in volumes due primarily to drop of steel production in Europe (-5.5%) and Brazil (-7.2%), offset by the appreciation of the Euro and US Dollar against the Real (+9.5% and 23.0%, respectively) • Industrial: Substantial increase in volumes in South America, mainly cement, in addition to the impact of the currency, which offset the fall in volumes in Europe and North America  Minerals: +61.9% vs 2Q11, with sales of magnesite sinter to third parties, besides the effect of the Real depreciation on that sales denominated in US Dollar.  Service: +0.2% vs 2Q11 Gross margin of 31.6%: 19 bps higher than 2Q11  Refractories: +34 bps, 32.4% vs 32.1% -> exchange effect, performance gains in the CPP and higher sales to the industrial offset higher raw material prices  Minerals: -7.5% p.p., 43.7% vs 51.2% –> spot sales of high margin dolomite sinter in 2Q11  Service: -2.65p.p., 8.6% vs 11.3% –> Reduction of scope of contracts with higher profitability EBITDA: R$105.2 million (margin 16.5%) vs R$103.2 million in 2Q11 (margin 17.7%)  2Q11 positively impacted by a reversal of provision for expenses with health insurance plans in U.S. (R$10.8 million) Net profit and Cash flow from operations  Net profit of R$36.7 million, +19.4% vs R$30.8 million in 2Q11  Cash flow from operations of R$96.9 million, +12.9% vs R$85.8 million in 2Q11
  • 4.
    4 1,158.3 1,244.5 6M11 6M12 +7.4% Consolidated Revenues (R$million) Quarter Acumulated 583.0 606.9 637.6 2Q11 1Q12 2Q12 +9.4% +5.1% 88.9% 5.3% 5.8% 2Q12 Refractories Minerals Service 90.7% 4.1% 5.2% 1Q12 90.1% 3.6% 6.3% 2Q11
  • 5.
    5 Revenues – RefractoriesSolutions (R$ million) Steel Industrial Quarter Acumulated 86.3% 82.3% 83.7% 13.7% 17.7% 16.3% 2Q11 1Q12 2Q12 Steel Industrial 525.3 550.4 566.9 3.0% 7.9% 86.3% 82.3% 13.7% 17.7% 6M11 6M12 Steel Industrial 1,021.1 1,117.3 9.4% 453.3 453.2 474.5 2Q11 1Q12 2Q12 4.7% 4.7% 872.8 927.7 6M11 6M12 6.3% 71.9 97.2 92.4 2Q11 1Q12 2Q12 28,4% -5,0% 148.2 189.6 6M11 6M12 27,9%
  • 6.
    6 Gross profit andgross margin by segment Minerals Gross profit (R$ million) 14.8 10.4 10.7 42.6% 38.1% Gross margin (%) 43.7% 41.4% 51.2% 231 bp -751 bps Service Gross profit (R$ million) 3.2 1.7 4.1 83.9% -23.4% Gross margin (%) 8.6% 5.5% 11.3% 310 bp -265 bps TOTAL Gross profit (R$ million) 201.6 181.7 183.3 11.0% 10.0% Gross margin (%) 31.6% 29.9% 31.4% 169 bp 19 bps Refractories Solutions 2Q12 (a) 1Q12 (b) 2Q11 (c) (a/b) (a/c) Gross profit (R$ million) 183.6 169.6 168.4 8.3% 9.1% Gross margin (%) 32.4% 30.8% 32.1% 159 bp 34 bps 6M12 (d) 6M11(e) (d/e) 353.2 334.4 5.6% 31.6% 32.7% -114 bps 25.2 24.4 3.4% 42.7% 44.0% -132 bps 4.9 10.2 -51.9% 7.2% 12.4% -525 bps 383.3 369.0 3.9% 30.8% 31.9% -108 bps
  • 7.
    7 EBITDA and Netprofit EBITDA and EBITDA margin R$ million and % Net profit and net margin R$ million and % 197.0 192.7 17.0% 15.5% 6M11 6M12 EBITDA EBITDA margin (%) 30.8 28.3 36.7 5.3% 4.7% 5.8% 2Q11 1Q12 2Q12 Net profit Net margin 52.6 65.1 4.5% 5.2% 6M11 6M12 Net profit Net margin 103.2 87.6 105.2 17.7% 14.4% 16.5% 2Q11 1Q12 2Q12 EBITDA EBITDA margin (%)
  • 8.
    8 Cash flow fromoperations, CAPEX and Cash cycle Cash flow and CAPEX R$ million Cash conversion cycle Days 85.8 63.7 96.9 25.7 55.7 62.5 2Q11 1Q12 2Q12 Cash flow from operations CAPEX 272.2 160.6 47.3 118.2 6M11 6M12 Cash flow from operations CAPEX 146 146 138 143 143 65 76 79 67 69 129 144 138 131 131 81 78 80 79 82 2Q11 3Q11 4Q11 1Q12 2Q12 Cash conversion cycle Suppliers Inventories Clients
  • 9.
    9 Debt and leverage Netdebt and leverage R$ million Debt profile 854.0 900.2 957.3 968.0 1,060.0 790.6 787.7 761.2 791.8 819.1 2.1 x 2.1 x 2.2 x 2.3 x 2.5 x 2Q11 3Q11 4Q11 1Q12 2Q12 Net debt Workingcapital Net debt/EBITDA 3.5% 96.5% Shortterm Longterm 20.9% 79.1% Local currency (R$) Foreign currencies
  • 10.
    10 Investor Relations contacts: FlávioRezende Barbosa CFO and Investor Relations Officer Daniel Domiciano Silva Investor Relations Phone: +55 11 3152-3202/3241 ri@magnesita.com www.magnesita.com