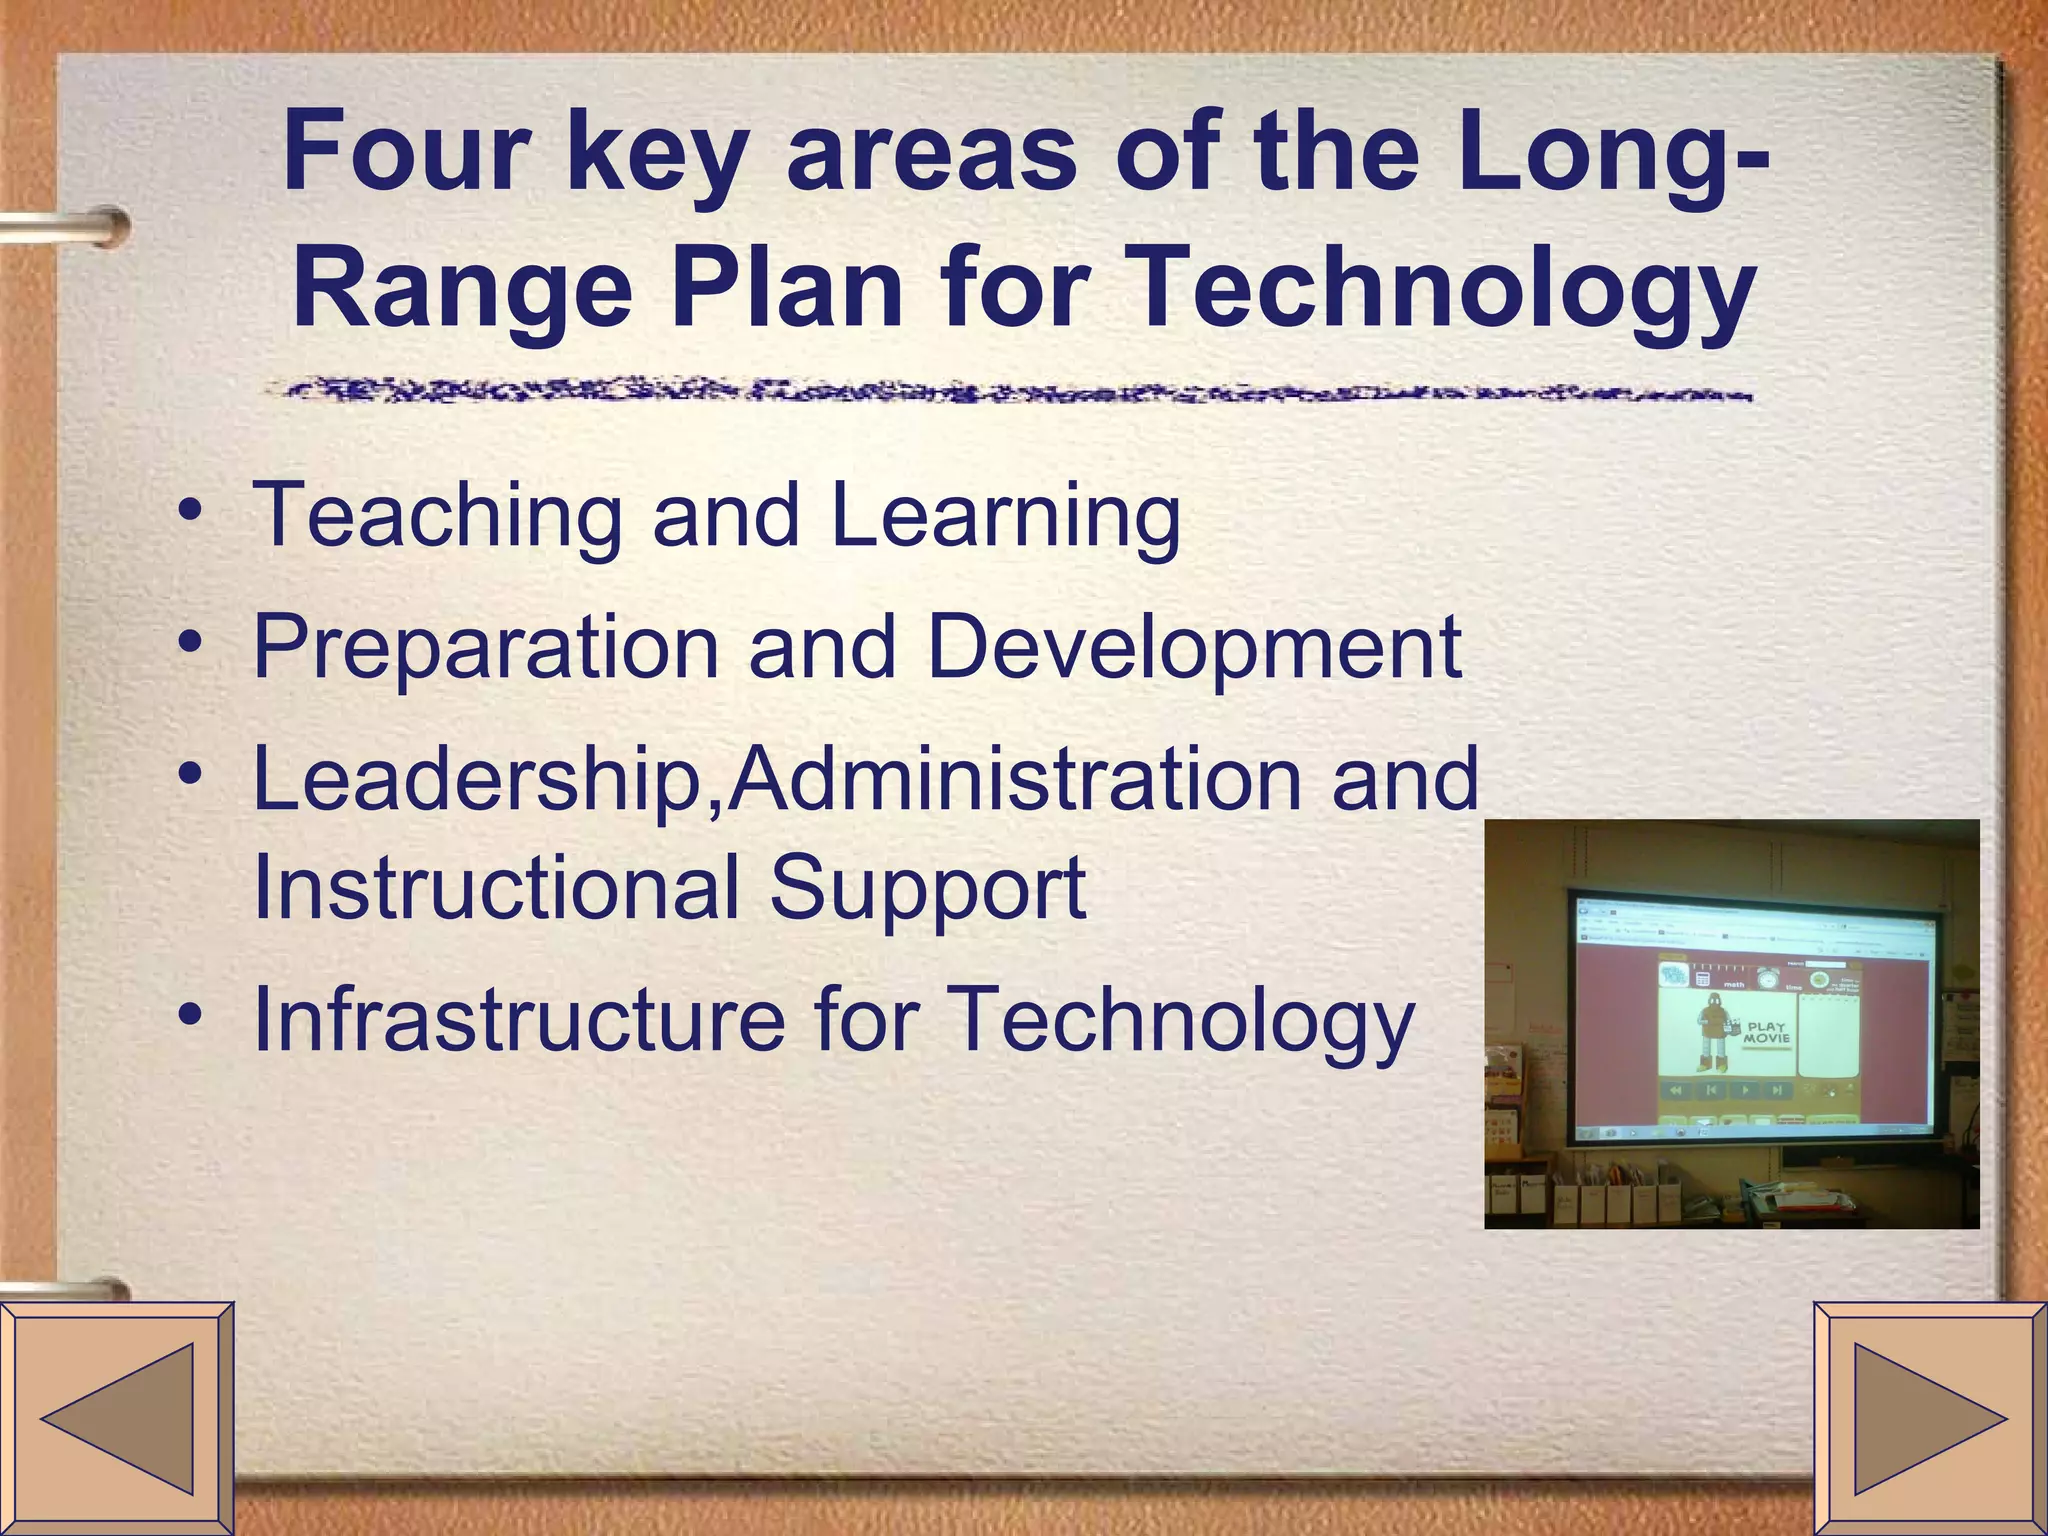
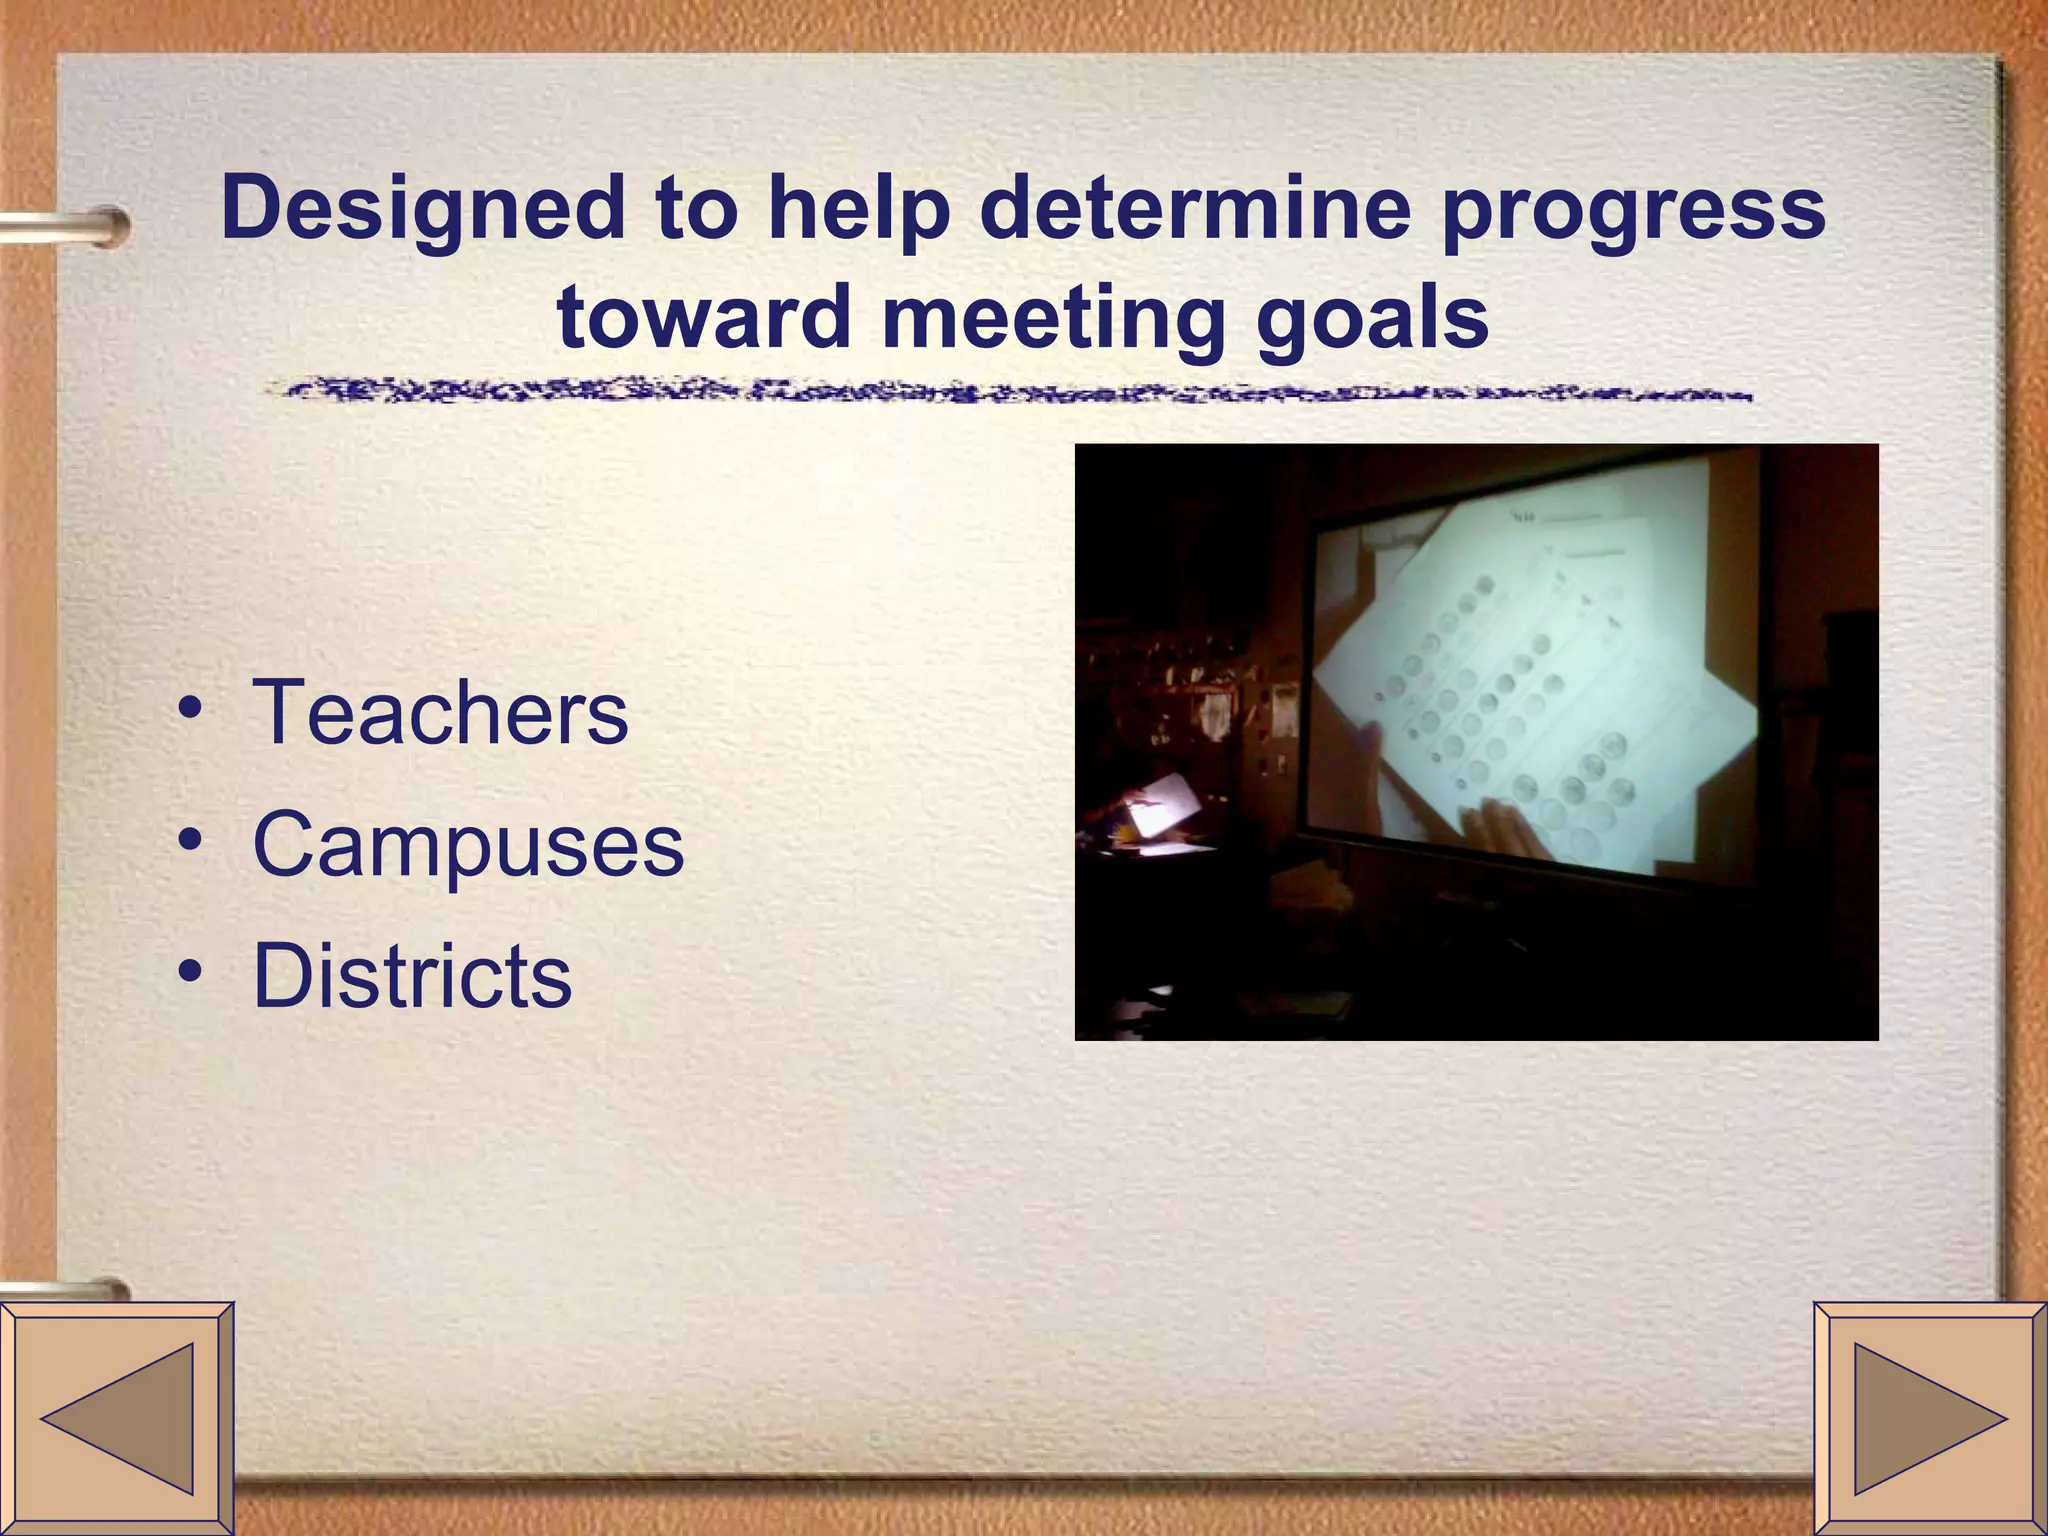
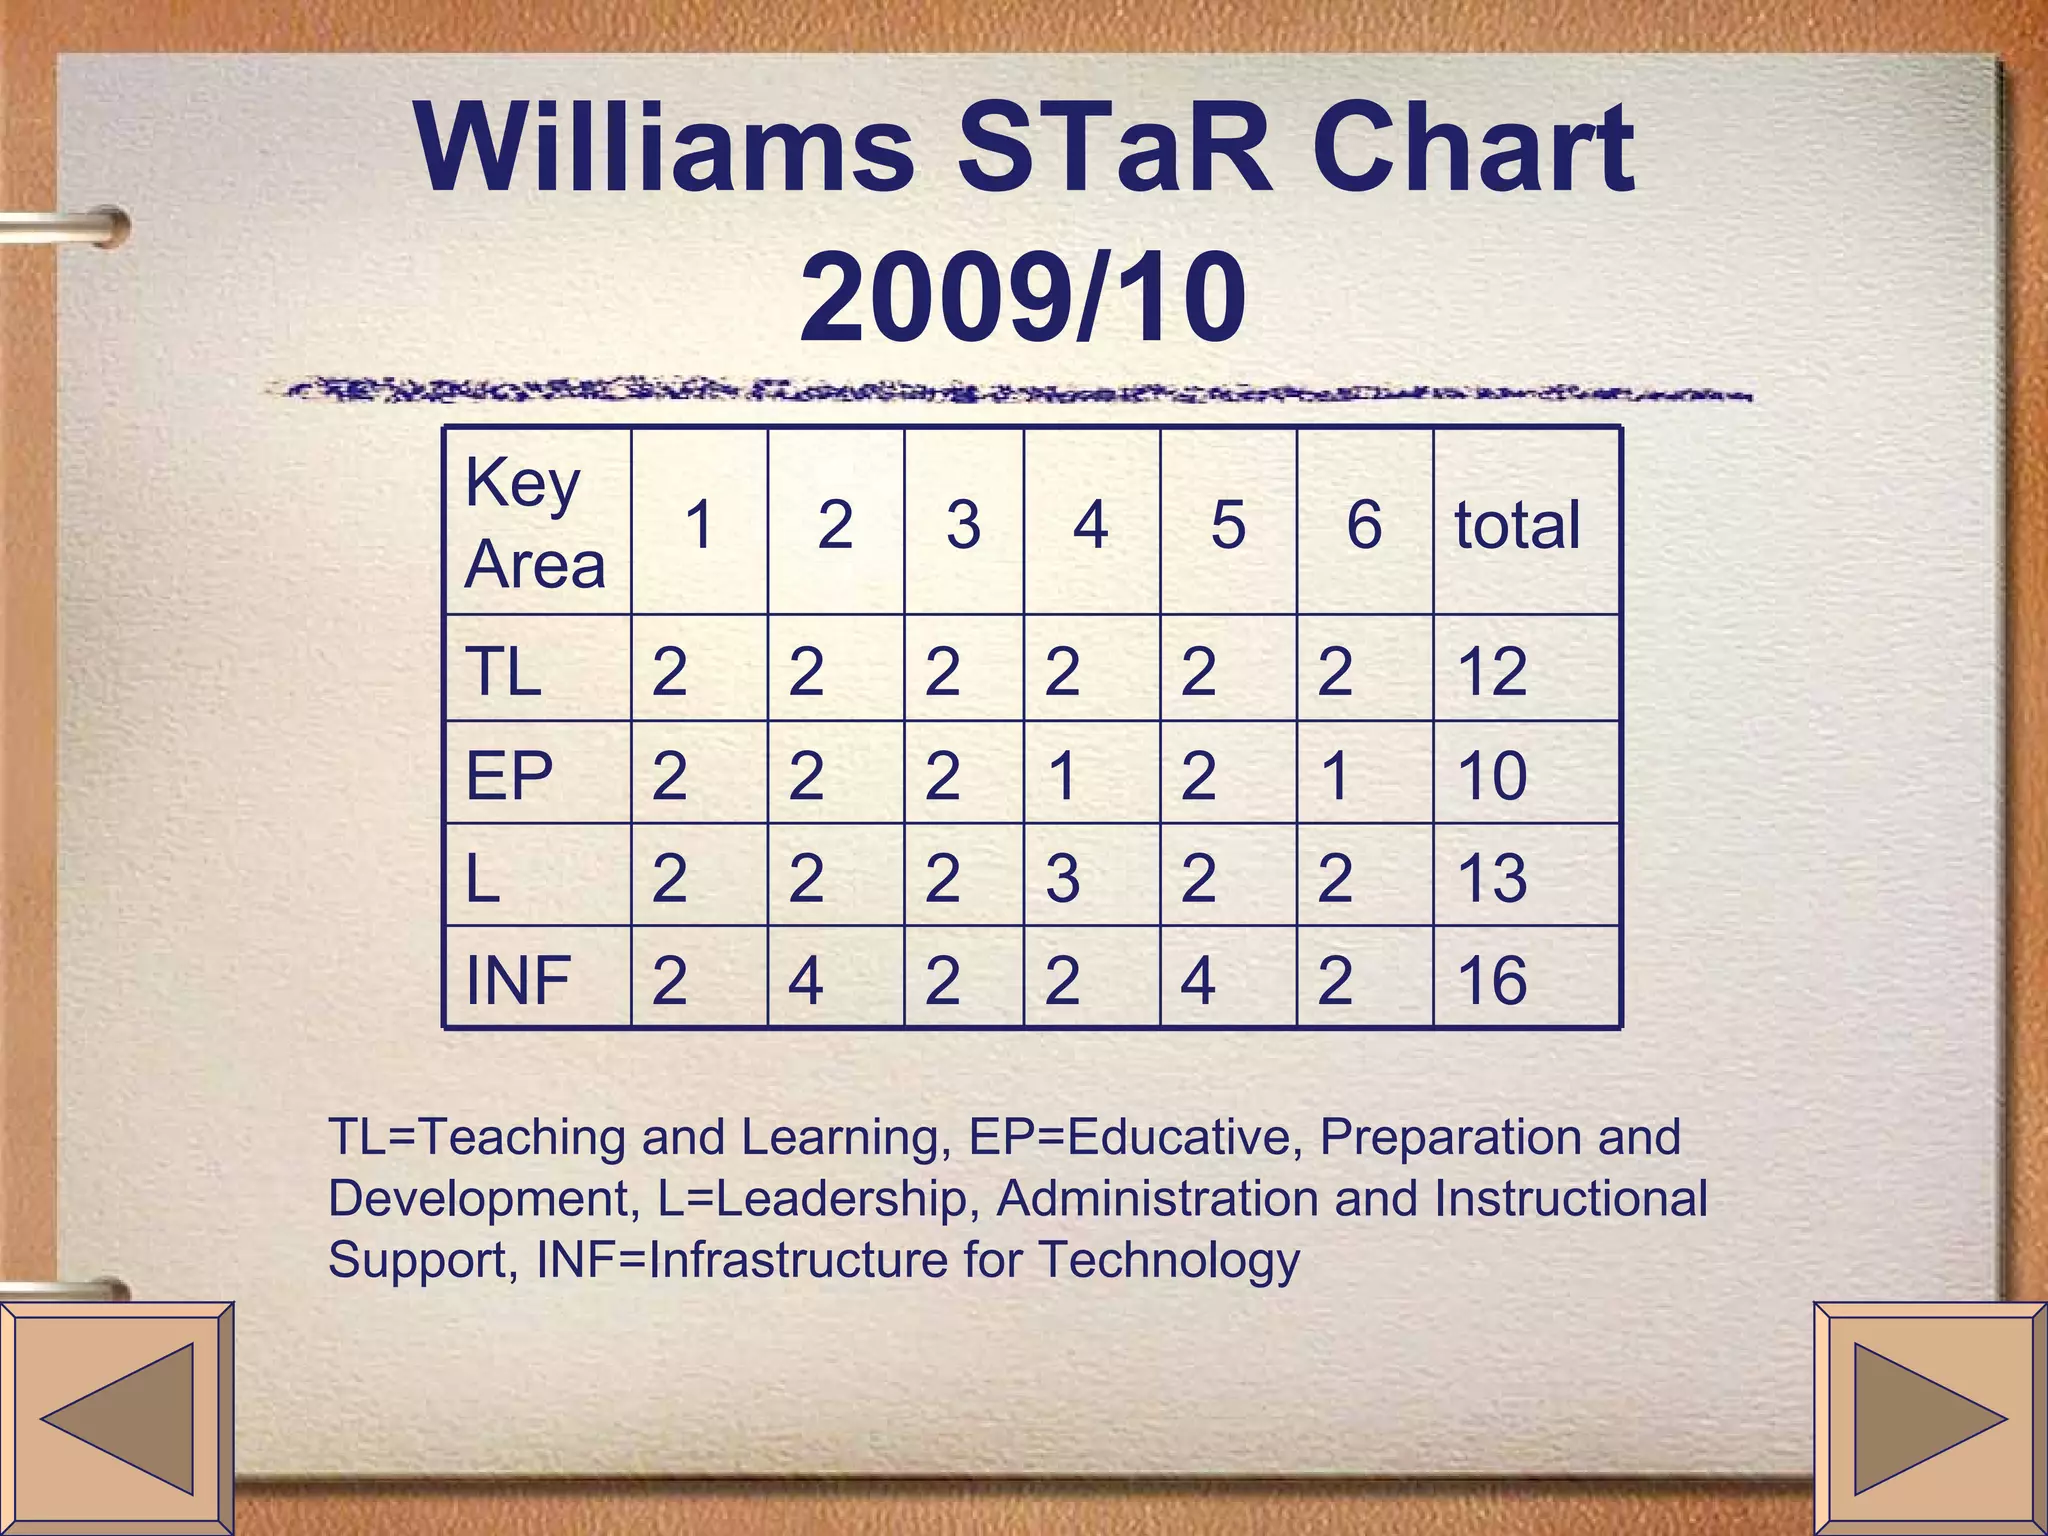
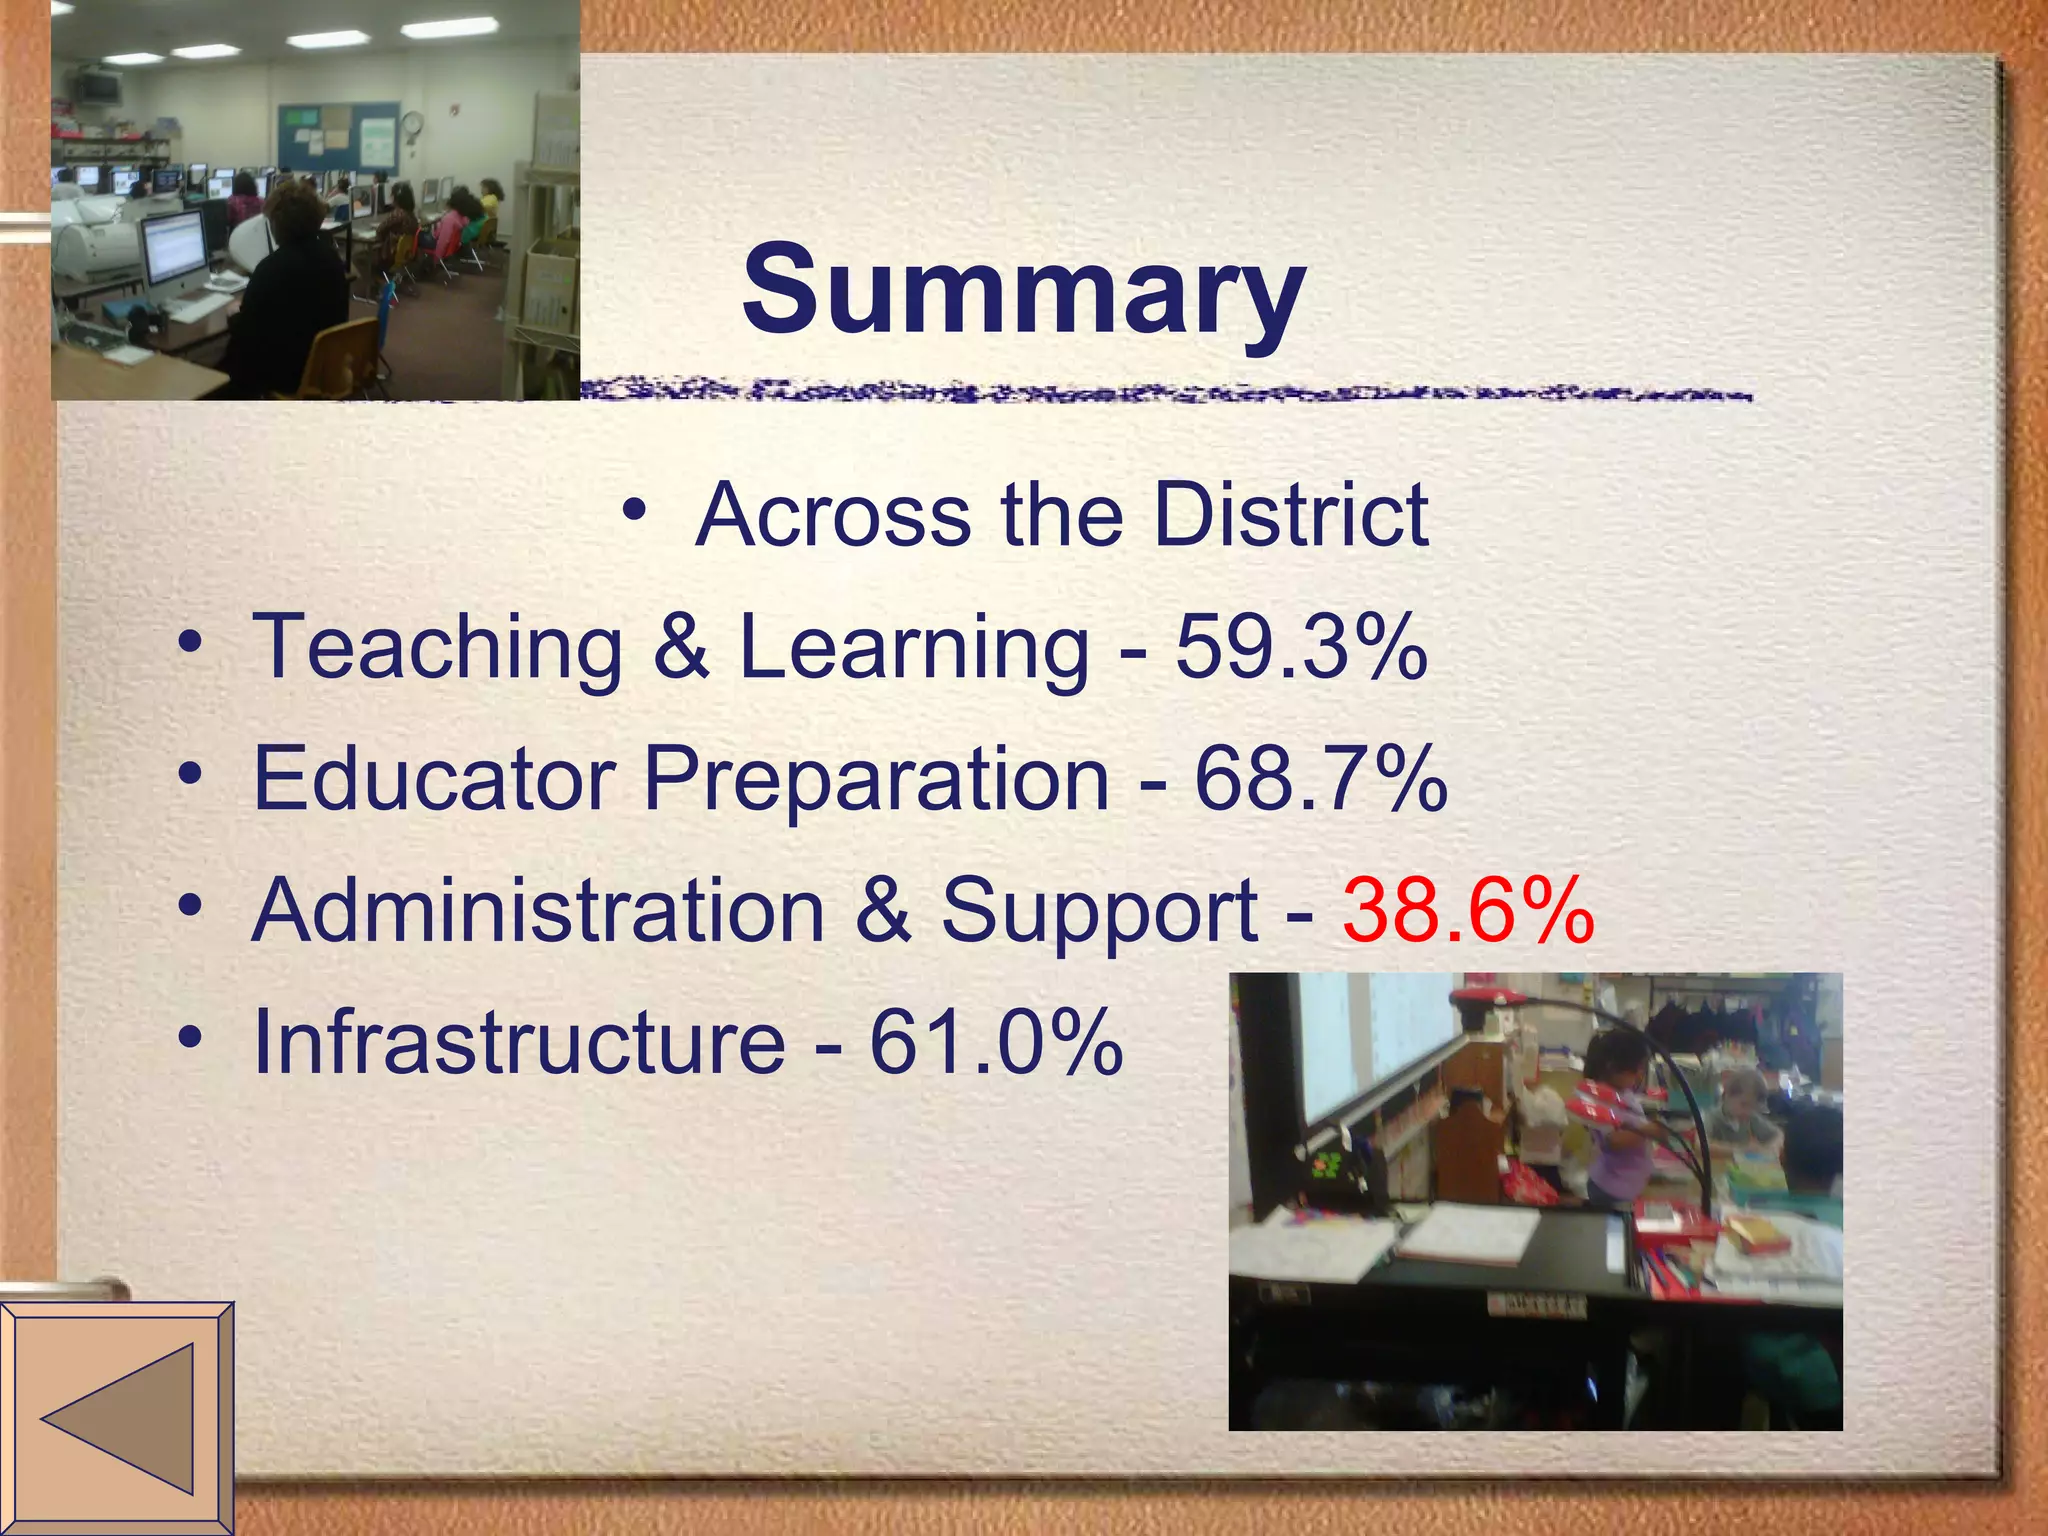
Texas STaR Chart S chool  T echnology  a nd  R eadiness A Teacher Tool for Planning and Self-Assessing aligned with the Long-Range Plan for Technology, 2006-2020
Introduction Texas Teacher STaR Chart   A teacher tool for planning and self-assessing Developed around four key areas of the Long-Range Plan for Technology, 2006-2020 Designed to help determine progress toward meeting goals
A teacher tool for planning and self-assessing Professional development needs Gauge progress http://www.sbec.state.tx.us/SBECOnline/standtest/standards/techapp.pdf
Four key areas of the Long-Range Plan for Technology Teaching and Learning Preparation and Development Leadership,Administration and Instructional Support Infrastructure for Technology
Designed to help determine progress toward meeting goals Teachers Campuses Districts
Williams STaR Chart 2009/10 TL=Teaching and Learning, EP=Educative, Preparation and Development, L=Leadership, Administration and Instructional Support, INF=Infrastructure for Technology 16 2 4 2 2 4 2 INF 13 2 2 3 2 2 2 L 10 1 2 1 2 2 2 EP 12 2 2 2 2 2 2 TL total 6 5 4 3 2 1 Key Area
Summary Across the District Teaching & Learning - 59.3% Educator Preparation - 68.7% Administration & Support -  38.6% Infrastructure - 61.0%

Presentation1

  • 1.
    Texas STaR ChartS chool T echnology a nd R eadiness A Teacher Tool for Planning and Self-Assessing aligned with the Long-Range Plan for Technology, 2006-2020
  • 2.
    Introduction Texas TeacherSTaR Chart A teacher tool for planning and self-assessing Developed around four key areas of the Long-Range Plan for Technology, 2006-2020 Designed to help determine progress toward meeting goals
  • 3.
    A teacher toolfor planning and self-assessing Professional development needs Gauge progress http://www.sbec.state.tx.us/SBECOnline/standtest/standards/techapp.pdf
  • 4.
    Four key areasof the Long-Range Plan for Technology Teaching and Learning Preparation and Development Leadership,Administration and Instructional Support Infrastructure for Technology
  • 5.
    Designed to helpdetermine progress toward meeting goals Teachers Campuses Districts
  • 6.
    Williams STaR Chart2009/10 TL=Teaching and Learning, EP=Educative, Preparation and Development, L=Leadership, Administration and Instructional Support, INF=Infrastructure for Technology 16 2 4 2 2 4 2 INF 13 2 2 3 2 2 2 L 10 1 2 1 2 2 2 EP 12 2 2 2 2 2 2 TL total 6 5 4 3 2 1 Key Area
  • 7.
    Summary Across theDistrict Teaching & Learning - 59.3% Educator Preparation - 68.7% Administration & Support - 38.6% Infrastructure - 61.0%