{
Thermo Analytical
Methods
Ku. Kanchan V. Kumbhalkar
Assistant Professor
Shri Shivaji College of Arts ,Commerce And
Science , Akola.
Welcome you All
{
Syllabus
Unit-I : Thermal methods of Analysis:
Introduction of different thermal methods,
Thermogravimetry TG and DTG, Static thermogravimetry,
quasistatic Thermogravimetry and dynamic
thermogravimetry, Instrumentation, Factors affecting
thermograms, Applications of thermogravimetry,
Differential thermal analysis (DTA), DTA curves, Factors
affecting DTA curves, instrumentation, applications of
DTA. Simple numerical problems.
Differential Scanning Colorimetry(DSC): Introduction,
Instrumentation, DSC-curves, factors affecting DSC curves
and applications. Thermometric Titrations; Introduction,
apparatus, theory and applications.
{
Thermogravimetry (TG)
Thermo analytical methods may be defined as those
techniques in which changes in physical and/or
chemical properties of a substance are measured as a
function temperature. The property studied can be the
weight or the enthalpy change in a system
Thermogravimetry (TG) is a technique in which a
change in the weight of substance is recorded as a
function of temperature.
{
Differential Thermal Analysis (DTA)
Differential Thermal Analysis (DTA) is a method
for recording the difference in temperature
between a substance and an inert reference
material as a function of temperature.
{
THERMOGRAVIMETRY (TG)
In a thermogravimetric analysis (TGA) the weight
of a sample is continuously recorded as a function
of temperature. The result is expressed in the form
of a thermogram, which is a plot of weight versus
temperature.
{
Characteristic Features of the
Thermogram (TG Curve)
A typical thermogram that of AgNO3, is shown in Fig. 1.1.
{
The curve exhibits two plateaus (AB and CD) and
one inflection (BC). The region AB in which the
weight remains constant is the region in which
AgNO3 is stable. At 473°C the following reaction
takes place.
AgNO3(s) — Ag(s) + NO2(g) +1/2 O2 (g)
Due to the loss of NO2 and O2,the weight
decreases from B to C. In the region CD i.e. at
temperatures above 608°C, metallic silver alone
can exist and there is no further change in the
weight. From the thermogram we infer that
AgNO3 is stable up to 473°C.
{
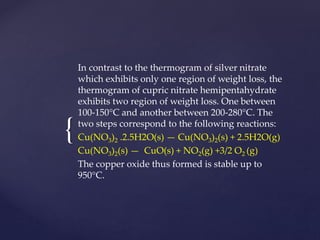
It is possible that there can be more than one step in
which weight losses can occur. The thermogram (Fig.
1.2) of cupric nitrate hemipentahydrate [Cu(NO3)2
2.5H2O] illustrates this point.
Fig. 1.2 TGA of cupric nitrate hemipentahydrate
{
In contrast to the thermogram of silver nitrate
which exhibits only one region of weight loss, the
thermogram of cupric nitrate hemipentahydrate
exhibits two region of weight loss. One between
100-150°C and another between 200-280°C. The
two steps correspond to the following reactions:
Cu(NO3)2 .2.5H2O(s) — Cu(NO3)2(s) + 2.5H2O(g)
Cu(NO3)2(s) — CuO(s) + NO2(g) +3/2 O2 (g)
The copper oxide thus formed is stable up to
950°C.
{
In Next lecture We will Start With
Instrumentation for Thermogravimetry
Factors Affecting TGA
{
Thank You.
Stay Safe……

Presentation thermogravimetry

  • 1.
    { Thermo Analytical Methods Ku. KanchanV. Kumbhalkar Assistant Professor Shri Shivaji College of Arts ,Commerce And Science , Akola.
  • 2.
  • 3.
    { Syllabus Unit-I : Thermalmethods of Analysis: Introduction of different thermal methods, Thermogravimetry TG and DTG, Static thermogravimetry, quasistatic Thermogravimetry and dynamic thermogravimetry, Instrumentation, Factors affecting thermograms, Applications of thermogravimetry, Differential thermal analysis (DTA), DTA curves, Factors affecting DTA curves, instrumentation, applications of DTA. Simple numerical problems. Differential Scanning Colorimetry(DSC): Introduction, Instrumentation, DSC-curves, factors affecting DSC curves and applications. Thermometric Titrations; Introduction, apparatus, theory and applications.
  • 4.
    { Thermogravimetry (TG) Thermo analyticalmethods may be defined as those techniques in which changes in physical and/or chemical properties of a substance are measured as a function temperature. The property studied can be the weight or the enthalpy change in a system Thermogravimetry (TG) is a technique in which a change in the weight of substance is recorded as a function of temperature.
  • 5.
    { Differential Thermal Analysis(DTA) Differential Thermal Analysis (DTA) is a method for recording the difference in temperature between a substance and an inert reference material as a function of temperature.
  • 6.
    { THERMOGRAVIMETRY (TG) In athermogravimetric analysis (TGA) the weight of a sample is continuously recorded as a function of temperature. The result is expressed in the form of a thermogram, which is a plot of weight versus temperature.
  • 7.
    { Characteristic Features ofthe Thermogram (TG Curve) A typical thermogram that of AgNO3, is shown in Fig. 1.1.
  • 8.
    { The curve exhibitstwo plateaus (AB and CD) and one inflection (BC). The region AB in which the weight remains constant is the region in which AgNO3 is stable. At 473°C the following reaction takes place. AgNO3(s) — Ag(s) + NO2(g) +1/2 O2 (g) Due to the loss of NO2 and O2,the weight decreases from B to C. In the region CD i.e. at temperatures above 608°C, metallic silver alone can exist and there is no further change in the weight. From the thermogram we infer that AgNO3 is stable up to 473°C.
  • 9.
    { It is possiblethat there can be more than one step in which weight losses can occur. The thermogram (Fig. 1.2) of cupric nitrate hemipentahydrate [Cu(NO3)2 2.5H2O] illustrates this point. Fig. 1.2 TGA of cupric nitrate hemipentahydrate
  • 10.
    { In contrast tothe thermogram of silver nitrate which exhibits only one region of weight loss, the thermogram of cupric nitrate hemipentahydrate exhibits two region of weight loss. One between 100-150°C and another between 200-280°C. The two steps correspond to the following reactions: Cu(NO3)2 .2.5H2O(s) — Cu(NO3)2(s) + 2.5H2O(g) Cu(NO3)2(s) — CuO(s) + NO2(g) +3/2 O2 (g) The copper oxide thus formed is stable up to 950°C.
  • 11.
    { In Next lectureWe will Start With Instrumentation for Thermogravimetry Factors Affecting TGA
  • 12.