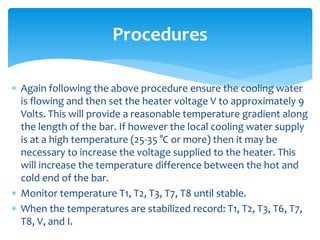
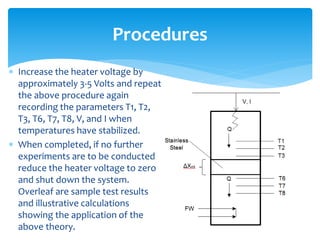
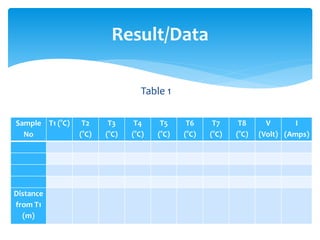
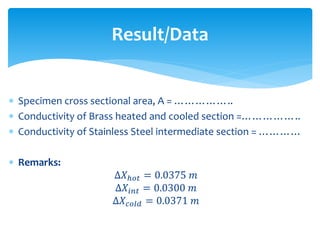
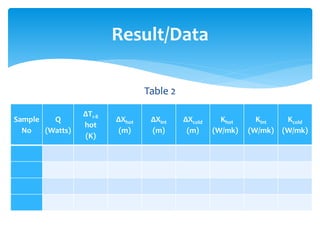
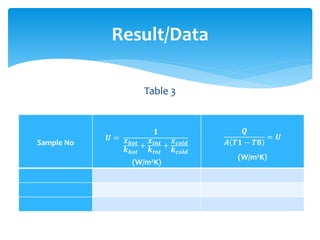
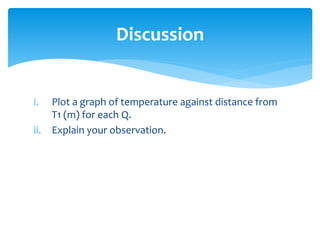
JJ508
ENGINEERING
LABORATORY 3
THERMODYNAMICS 2
EXPERIMENT 2
HEAT TRANSFER 2
At the end of the lab session students should be able:
To measure the temperature distribution for
steady state conduction of energy through a
composite plane wall and determine the Overall
Heat Transfer Coefficient for the flow of heat
through a combination of different materials in
use.
Experiment Outcome
i. Unit H110A
ii. Material Stainless Steel Intermediate Specimen
Apparatus/Equipment
 Again following the above procedure ensure the cooling water
is flowing and then set the heater voltage V to approximately 9
Volts. This will provide a reasonable temperature gradient along
the length of the bar. If however the local cooling water supply
is at a high temperature (25-35 °C or more) then it may be
necessary to increase the voltage supplied to the heater. This
will increase the temperature difference between the hot and
cold end of the bar.
 Monitor temperature T1, T2, T3, T7, T8 until stable.
 When the temperatures are stabilized record: T1, T2, T3, T6, T7,
T8, V, and I.
Procedures
 Increase the heater voltage by
approximately 3-5 Volts and repeat
the above procedure again
recording the parameters T1, T2,
T3, T6, T7, T8, V, and I when
temperatures have stabilized.
 When completed, if no further
experiments are to be conducted
reduce the heater voltage to zero
and shut down the system.
Overleaf are sample test results
and illustrative calculations
showing the application of the
above theory.
Procedures
Table 1
Result/Data
Sample
No
T1 (°C) T2
(°C)
T3
(°C)
T4
(°C)
T5
(°C)
T6
(°C)
T7
(°C)
T8
(°C)
V
(Volt)
I
(Amps)
Distance
from T1
(m)
 Specimen cross sectional area, A = ……………..
 Conductivity of Brass heated and cooled section =……………..
 Conductivity of Stainless Steel intermediate section = …………
 Remarks:
∆𝑋ℎ𝑜𝑡 = 0.0375 𝑚
∆𝑋𝑖𝑛𝑡 = 0.0300 𝑚
∆𝑋𝑐𝑜𝑙𝑑 = 0.0371 𝑚
Result/Data
Table 2
Result/Data
Sample
No
Q
(Watts)
ΔT1-8
hot
(K)
ΔXhot
(m)
ΔXint
(m)
ΔXcold
(m)
Khot
(W/mk)
Kint
(W/mk)
Kcold
(W/mk)
Table 3
Result/Data
Sample No
𝑼 =
𝟏
𝒙 𝒉𝒐𝒕
𝒌 𝒉𝒐𝒕
+
𝒙𝒊𝒏𝒕
𝒌𝒊𝒏𝒕
+
𝒙 𝒄𝒐𝒍𝒅
𝒌 𝒄𝒐𝒍𝒅
(W/m2K)
𝑸
𝑨 𝑻𝟏 − 𝑻𝟖
= 𝑼
(W/m2K)
i. Plot a graph of temperature against distance from
T1 (m) for each Q.
ii. Explain your observation.
Discussion
 Your conclusion should be related to your practical
and theoretical understanding on the related topic.
Conclusion and Recommendation

Thermodynamics - Experiment 2

  • 1.
  • 2.
    At the endof the lab session students should be able: To measure the temperature distribution for steady state conduction of energy through a composite plane wall and determine the Overall Heat Transfer Coefficient for the flow of heat through a combination of different materials in use. Experiment Outcome
  • 3.
    i. Unit H110A ii.Material Stainless Steel Intermediate Specimen Apparatus/Equipment
  • 4.
     Again followingthe above procedure ensure the cooling water is flowing and then set the heater voltage V to approximately 9 Volts. This will provide a reasonable temperature gradient along the length of the bar. If however the local cooling water supply is at a high temperature (25-35 °C or more) then it may be necessary to increase the voltage supplied to the heater. This will increase the temperature difference between the hot and cold end of the bar.  Monitor temperature T1, T2, T3, T7, T8 until stable.  When the temperatures are stabilized record: T1, T2, T3, T6, T7, T8, V, and I. Procedures
  • 5.
     Increase theheater voltage by approximately 3-5 Volts and repeat the above procedure again recording the parameters T1, T2, T3, T6, T7, T8, V, and I when temperatures have stabilized.  When completed, if no further experiments are to be conducted reduce the heater voltage to zero and shut down the system. Overleaf are sample test results and illustrative calculations showing the application of the above theory. Procedures
  • 6.
    Table 1 Result/Data Sample No T1 (°C)T2 (°C) T3 (°C) T4 (°C) T5 (°C) T6 (°C) T7 (°C) T8 (°C) V (Volt) I (Amps) Distance from T1 (m)
  • 7.
     Specimen crosssectional area, A = ……………..  Conductivity of Brass heated and cooled section =……………..  Conductivity of Stainless Steel intermediate section = …………  Remarks: ∆𝑋ℎ𝑜𝑡 = 0.0375 𝑚 ∆𝑋𝑖𝑛𝑡 = 0.0300 𝑚 ∆𝑋𝑐𝑜𝑙𝑑 = 0.0371 𝑚 Result/Data
  • 8.
  • 9.
    Table 3 Result/Data Sample No 𝑼= 𝟏 𝒙 𝒉𝒐𝒕 𝒌 𝒉𝒐𝒕 + 𝒙𝒊𝒏𝒕 𝒌𝒊𝒏𝒕 + 𝒙 𝒄𝒐𝒍𝒅 𝒌 𝒄𝒐𝒍𝒅 (W/m2K) 𝑸 𝑨 𝑻𝟏 − 𝑻𝟖 = 𝑼 (W/m2K)
  • 10.
    i. Plot agraph of temperature against distance from T1 (m) for each Q. ii. Explain your observation. Discussion
  • 11.
     Your conclusionshould be related to your practical and theoretical understanding on the related topic. Conclusion and Recommendation