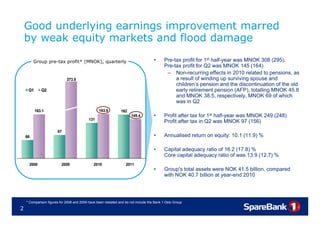
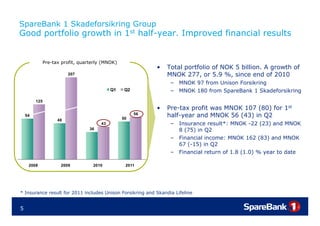
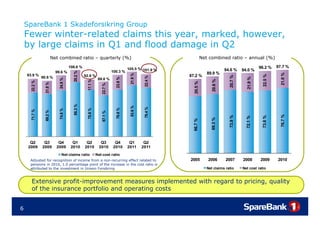
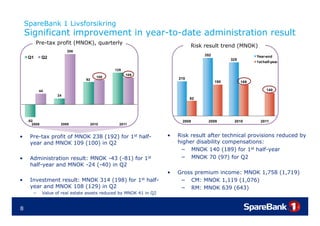
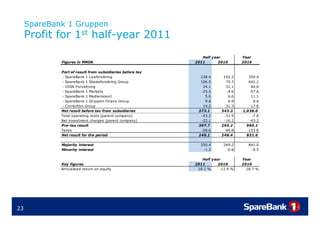
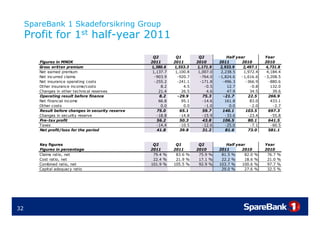
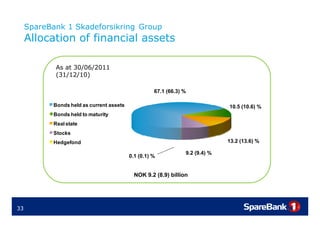
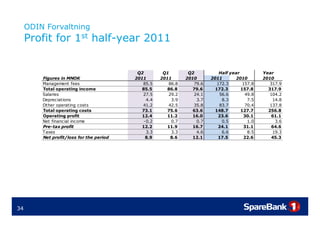
1st half-year and 2nd quarter
2011
                                     Q2
Presentation of results
From SpareBank 1 Gruppen

Kirsten Idebøen, CEO


                                August 10th 2011
Good underlying earnings improvement marred
    by weak equity markets and flood damage

         Group pre-tax profit* (MNOK) quarterly
                               (MNOK),                                              •     Pre-tax profit for 1st half-year was MNOK 308 (295).
                                                                                          Pre tax                half year
                                                                                          Pre-tax profit for Q2 was MNOK 145 (164)
                                                                                           – Non-recurring effects in 2010 related to pensions, as
                             373.8                                                             a result of winding up surviving spouse and
                                                                                               children’s pension and the discontinuation of the old
     Q1      Q2                                                                                early retirement pension (AFP), totalling MNOK 45.8
                                                                                               and MNOK 38.5, respectively, MNOK 69 of which
                                                                                               was in Q2
          163.1                                  163.9         162
                                                                      145.4         •     Profit after tax for 1st half-year was MNOK 249 (248)
                                           131
                                                                                          Profit after tax in Q2 was MNOK 97 (156)
                       87
    68                                                                              •     Annualised return on equity: 10.1 (11.9) %

                                                                                    •     Capital adequacy ratio of 16.2 (17.8) %
                                                                                          Core capital adequacy ratio of was 13.9 (12.7) %
     2008                 2009                2010                2011
                                                                                    •     Group's total assets were NOK 41.5 billion, compared
                                                                                          with NOK 40.7 billion at year-end 2010


    * Comparison figures for 2008 and 2009 have been restated and do not include the Bank 1 Oslo Group
2
Improved profit in life and P&C insurance companies

                  Pre-tax profit by subsidiary (MNOK)                                                           •   Significantly improved administration result
                                                                                                                    and good investment result for life insurance
                238

                                                                                                                •   Good portfolio growth provides increased
192                                                                                                                 premium income for P&C insurance.
                                                                                                                    Improved financial result, but weaker
                                                              1H2010                 1H 2011                        insurance result

                                       107                                                                      •   High non-recurring costs in ODIN
                                                                                                                    Forvaltning. T t l assets under management
                                                                                                                    F     lt i   Total     t    d            t
                                                                                                                    declined by NOK 2.2 billion
                      80


                                             31          24                                                     •   Factoring and the debt recovery business
                                                              7                 10     -5                 -26       performed well, but marred by increasing
                                                                                                                    pressure on margins
                                                                                                     ts
      SB1 Liv


                           SB1 Skade


                                                                  SB1G Finans


                                                                                                                •   Higher
                                                                                                                    Hi h costs i SB1 M k t as a
                                                                                                                             t in      Markets
                                                                                            SB1 Market
                                                  ODIN


                                                                                                                    consequence of planned new recruitment
                                                                  S


3
SpareBank 1
    Skadeforsikring Group
         Good portfolio growth in 1st half-year.
                    Improved financial results


4
SpareBank 1 Skadeforsikring Group
Good po t o o g o t in 1st half-year. Improved financial results
     portfolio growth       a yea       p o ed    a c a esu ts


            Pre-tax profit
            Pre tax profit, quarterly (MNOK)
                                                           •   Total portfolio of NOK 5 billion. A growth of
                       207                                     MNOK 277, or 5.9 %, since end of 2010
                                                                 – MNOK 97 from Unison Forsikring
                                          Q11 k Q2 2 k
                                            1.kv 2.kv            – MNOK 180 from SpareBank 1 Skadeforsikring
         125
                                                           •   Pre-tax profit was MNOK 107 (80) for 1st
    54
                                               50
                                                    56         half-year and MNOK 56 (43) i Q2
                                                               h lf        d              in
                  48
                                     43                          – Insurance result*: MNOK -22 (23) and MNOK
                                36                                 8 (75) in Q2
                                                                 – Financial income: MNOK 162 (83) and MNOK
                                                                   67 (-15) in Q2
                                                                 – Financial return of 1.8 (1.0) % year to date

     2008          2009          2010           2011


* Insurance result for 2011 includes Unison Forsikring and Skandia Lifeline


5
SpareBank 1 Skadeforsikring Group
    Fewer winter-related claims this year, marked, however,
           winter related
    by large claims in Q1 and flood damage in Q2
                          Net combined ratio – quarterly (%)                                                       Net combined ratio – annual (%)
                                       108.6 %
                                                                                    105.5 % 101.9 %                                                     96.2 %     97.7 %
                            99.6 %                                       100.3 %                                                  94.6 %     94.0 %
                                         20.2 %
                                                                                                                      89.9 %


                                                                                                                                                                     21.0 %
                                                                                     21.9 %
    93.9 %


                                                                                                                                                          22.5 %
                                                  92.9 %                                                87.2 %


                                                                                                                                    20.7 %
                                                                                               22.4 %
               90.9 %


                                                                                                                                               21.9 %
                                                                           23.8 %
                              24.8 %


                                                              89.8 %


                                                                                                                         20.6 %
                                                    17 %
      22.2 %


                                                                                                          20.5 %
                 21.8 %


                                                                22.7 %
                                                     7.1


                                                                                                                                    2
                                                                                                             5
                                                                           2
                    8


                              2


                                                                                                                                               2
                                         88 %


                                                                                     83 %


                                                                                               79.4 %
                                                                           76.6 %
                                                    75.9 %
                              74.8 %


                                          8.3
      71.7 %


                                                                                      3.6
                 69.2 %


                                                                67.1 %


                                                                                                  4
                                                                              6
                                                       9
                                 8


                                                                                                                                                                     76.7 %
                                                                                                                                    73.9 %


                                                                                                                                                         73.8 %
                                                                                                                                               72.1 %
                                                                                                                         69.3 %
                                                                                                          66.7 %
      Q2        Q3           Q4          Q1        Q2           Q3        Q4         Q1        Q2
     2009      2009         2009        2010      2010         2010      2010       2011      2011
                                Net claims ratio             Net cost ratio
     Adjusted for recognition of income from a non-recurring effect related to                          2005          2006        2007       2008       2009       2010
     pensions in 2010, 1.0 percentage point of the increase in the cost ratio is
                  2010 1 0
     attributed to the investment in Unison Forsikring                                                                Net claims ratio       Net cost ratio


      Extensive profit-improvement measures implemented with regard to pricing, quality
      of the insurance portfolio and operating costs


6
SpareBank 1
                            p
                          Livsforsikring
    Significant improvement in the administration result


7
SpareBank 1 Livsforsikring
    Significant improvement in y
      g           p            year-to-date administration result
          Pre-tax profit (MNOK), quarterly
                                                                               Risk result trend (MNOK)
                          206
                                                                                    352                     Year-end
     Q1       Q2                                                                                325
                                                                                                            1st half year
                                                                                                                half-year

                                                129
                                                      109
                                          100                            210
                                  92
                                                                                          190         189

           44                                                                                                    140
                     24
                                                                               92


     -52                                                                  2008       2009        2010         2011
       2008           2009             2010       2011


•     Pre-tax profit of MNOK 238 (
              p                  (192) for 1st half-
                                     )                               •   Risk result after technical provisions reduced by
      year and MNOK 109 (100) in Q2                                      higher disability compensations:
                                                                          − MNOK 140 (189) for 1st half-year
•     Administration result: MNOK -43 (-81) for 1st                       − MNOK 70 (97) for Q2
      half-year
      half year and MNOK -24 ( 40) in Q2
                            24 (-40)
                                                                     •   Gross premium income: MNOK 1,758 (1,719)
•     Investment result: MNOK 314 (198) for 1st half-                     − CM: MNOK 1,119 (1,076)
      year and MNOK 108 (129) in Q2                                       − RM: MNOK 639 (643)
                                                                                            (   )
       –      Value of real estate assets reduced by MNOK 41 in Q2


8
SpareBank 1 Livsforsikring
    Solid buffers
             Buffer capital trend, quarterly (%)
                       16.1 %
                                                                                Securities adjustment reserve, annual (MNOK)
        15.4 %                      14.6 %         15.2 %
                                                                 14.0 %
                                                                                                     617


                                                                                     327                             326


         Q2            Q3            Q4             Q1             Q2
        2010          2010          2010           2011           2011
                                                                                     2009           2010           1H2011
     Core capital in excess of minimum     Interim profit
     Additional provisions                 Securities adjustment reserve

                                                                           •   Capital adequacy ratio: 17 1 (22.1) %
                                                                                                       17.1 (22 1)
•     Buffer capital including quarterly profit: 14.0                           − Term subordinated loan capital of
      (15.4) %                                                                      MNOK 200 was redeemed in June
                                                                                − The net liable capital consists of
•     Total assets: NOK 26.2 billion, NOK 0.3 billion                               core capital
      lower than at the end of 2010
                                                                           •   Estimated solvency margin: 268 (322) %
•     Securities adjustment reserve: MNOK 326
      (221)

9
SpareBank 1 Forsikring
  Allocation of financial assets by portfolio as at 30/06/11 ( / / )
                                  yp                  / /    (31/12/10)

     SB 1 Livsforsikring                                                                                SB 1 Skadeforsikring Group

            Group portfolio                                    Company portfolio
                                                                                                             0.1 (0.1) %
                                                                                 -3.3 (-1.6) %
                        14.7 (14.8) %                            0.1 (0.1) %                            9.2 (9.4) %      13.2 (13.6) %
                                                                                                                                         10.5 (10.6) %
34.9 (34.8)
34 9 (34 8) %                           0.9 (0.9)
                                        0 9 (0 9) %
                                                                                       24.3 (21.0) %


           27.9 (28.0) %             21.6 (21.5) %      59.8 (48.4) %                19.0 (28.8) %                    67.1 (66.3) %

 Stocks                      Other                    Stocks                   Other                     Stocks                  Other
 Real estate                 Bonds - amortized cost   Real estate              Bonds - amortized cost    Real estate             Bonds - amortized cost
 Bonds - market value                                 Bonds - market value                               Bonds - market value

      NOK 15.6 (16.0) billion                                NOK 2.6 (2.8) billion                                 NOK 9.2 (8.9) billion


10
SpareBank 1 Forsikring
 Market unrest - consequences
 SB 1 Livsforsikring                                        SB 1 Skadeforsikring Group

 •   The fall in prices and rates up to now is          •    The insurance company's investment
     completely covered by the securities                    strategy has been stable in recent years. The
     adjustment reserve, and the fall will only have         share percentage was 9.2 %, or MNOK 844,
     a limited effect on the results in the financial        as at 30 June 2011
     statements. The share percentage was 14.7 %
     or NOK 2.3 billion as at 30 June 2011              •    No changes to the insurance company's
                                                             investment strategy have been considered,
 •   No adjustments have y been made to the
           j             yet                                 and the company has therefore not made
                                                                          p y
     portfolio                                               any special adjustments after the recent
                                                             turbulence in the market
 •   The company's buffer capital situation is still
     good, and the company can withstand a fall in
     share prices of around 50 % before the
     additional provisions, which can be used in the
     accounts for 2011, are fully exploited

 •   Whether th
     Wh th the portfolio should be adjusted is
                      tf li h ld b     dj t d i
     assessed on an ongoing basis. Taking the
     owner's profit and equity into account is a key
     component of these assessments


11
ODIN Forvaltning
                    g
     Good new sales of combination funds


12
ODIN Forvaltning
     Good new sales of combination funds

                                                       •   Pre-tax profit for 1st h lf
                                                           P t        fit f     t half-year: MNOK 24 (30)

            Pre-tax profit (MNOK), quarterly                –   Results are still affected by high non-recurring
 30                                                             costs, most of which were recognised in Q1
        29                              Q1        Q2

                                                       •   Profit in Q2 of MNOK 12 (17)
                                   17
                              14
                                             12   12   •   Total assets of NOK 30 1 billion
                                                                               30.1
                       10
                                                            - Down NOK 2.2 billion since the end of 2010

                                                       •   Equity fund market share of 9 9 % as of June,
                                                                                       9.9         June
                                                           compared with 10.7 % at the end of 2010
                  -7
     2008          2009         2010           2011
                                                       •   Combination fund market share of 3.5 % for
                                                                                            35
                                                           1 st half-year


13
SpareBank 1 Gruppen
      p             pp
     Finans Group
     Growth in factoring and the debt recovery business, but
     pressure on the margins


14
SpareBank 1 Gruppen Finans Group
      Growth in factoring and the debt recovery business, but pressure on
      the margins
                 Pre-tax profit year to date (MNOK)
                                                                                                            •   Pre tax
                                                                                                                Pre-tax profit for 1st half-year: MNOK 9.8
                                                                                                                                       half year:
                                                                                                                (6.9)*

                                                                                                                 ― Reduced losses in 1st half-year have contributed
                                                                                                                   to improved profit in BA Factoring, but the
                                                                                                                                            Factoring
                                                                             12.2                                  company is experiencing pressure on the
                                                                                                                   margins
                                                   9.4                                                9.8
         1H2010              1H2011
                                                                                                                 ― BA Portfolio had a total portfolio volume of
                                                                                      6.9                          MNOK 964 as of June, compared with MNOK 620
                                                                                                                   at the end of 2010. Book value of MNOK 55
                     4.9
   3.7
                                                                                                                 ― Conecto AS s volume of business has shown a
                                                                                                                             AS's
                                             1.6                                                                   slightly rising trend over the past 12 months
                           1.0
                                                                               ery)


                                                                                                p**
                ng


                                                                                            SB1G F
                                        io


                                                               o*
                                                         Conecto
         Factorin


                                                                    (debt recove
                                 Portfoli


                                                                                            Group


 *Conecto was acquired with accounting effect from 10 September 2010 The profit up until the acquisition date has been entered directly against the Group s equity.
  Conecto                                                         2010.                                                                             Group’s equity
**Pre-tax profit for SpareBank 1 Gruppen Finans Group also includes overhead costs and excess value amortisation.


 15
SpareBank 1 Markets
     Building up a leading capital market environment is progressing
     according to plan


16
SpareBank 1 Markets
     Reason for this initiative
 Income as a percentage of total assets                                   Composition of DnB NOR Markets'
 from the capital market in 2010:                                         income for 2010:*
                                                                                                    Other market 
                   DnB Nor                                     0.29
                                                              0,29    %          7%           72%   making/trading revenues
                    Nordea                               0.26
                                                        0,26     %                                  Income from the liquidity 

                                                                           17%          25%         p
                                                                                                    portfolio
           Handelsbanken                              0.22
                                                     0,22    %                                      FX, interest rate and 
                                                                                                    commodity derivatives
              Danske bank                             0.21
                                                     0,21    %            4%                        Securities service
      p
     SpareBank 1 Alliance              0,07 %
                                        0.07%        0.25 %
                                                                                        22%         Corporate Finance
     - Potential for over NOK 1 billion given the                              25%
     level of Nordic peers                                                                          Investment products

                                                                           - Mi i
                                                                             Minimum of 72 % of the income can be
                                                                                         f       f th i         b
                                                                           attributed to the bank's comparative
       ”
      The SpareBank 1 Alliance, which is
                                                                           advantages; use of its balance sheet

      Norway's second largest financial                                    ”
                                                                          A bank balance sheet has a comparative
      group, has a significant earnings
                                                                          advantage, which may entail a restruc-
      potential in the capital market area
                                                                          turing of the broker industry over time
                                                                 ”                                                       ”
17         * Source: Annual Accounts 2010, DnB NOR
SpareBank 1 Markets
 Building up a leading capital market environment is p g
        g p          g p                             progressing
                                                               g
 according to plan
          Operative matters
     • A go Sec ities changed its name to
       Argo Securities
       SpareBank 1 Markets
     • The recruitment work has basically been completed
       and the organisation will be operative in 2011
             –   The acquisition of UB Securities in London provides
                 access to international investment environments


          Results
     •   Pre-tax loss for 1st half-year: MNOK -26 (-5)
     •   Pre-tax loss in Q2: MNOK -22 (-2)
     •   Revenue:
         R
     - Commission income on stocks and derivatives: MNOK 21 (20)
     - Debt capital markets: MNOK 8 (9)
     - Corporate Finance: MNOK 22 (15)


 A leading capital market environment is strategically important - and has a significant
 earnings potential for the SpareBank 1 Alliance


18
Future outlook
           SPAREBANK 1 GRUPPEN


       • A ti i t continued good growth for the most important companies in
         Anticipates  ti  d    d     th f th       ti     t t        i i
         SpareBank 1 Gruppen

       • Growth increases the costs in the short term, but it also provides a good
                                                     ,             p          g
         foundation for increased future earnings

       • Increased volatility in the financial markets entails greater uncertainty for the
         financial results, which represent a significant part of SpareBank 1 G ppen's
                    es lts   hich ep esent                pa t    Spa eBank Gruppen's
         value creation

       • SpareBank 1 Gruppen is well equipped to meet the new capital requirements
          p               pp            q pp                    p       q
         with regard to the introduction of Solvency II

       • There will be an increased focus on interaction across the companies in order to
         realise efficiency gains on both cost and income


19
Norway s
          Norway's savings bank
     20
20
Appendix
     A    di


21
SpareBank 1 Alliance
         SpareBank 1             SpareBank 1       SpareBank 1           Sparebanken         Samarbeidende
                                                                                                                  LO (Trade Union)
           SR-Bank                   SMN           Nord-Norge              Hedmark            Sparebanker
                                                                                                                       (10%)
           (19.5%)                 (19.5%)           (19.5%)                (12%)               (19.5%)


                                                    SpareBank 1 Gruppen AS


                                  SpareBank 1             ODIN
     SpareBank 1 Markets
                                  Livsforsikring       Forvaltning
          (96.1%)
                                     (100%)             (100%)
                                                                                        Alliance Cooperation

        SpareBank 1               SpareBank 1          SpareBank 1
        Medlemskort              Gruppen Finans       Skadeforsikring        Broad cooperation
          (100%)                    (100%)               (100%)
                                                                              - Technology
                                                                              - Brand/communication
                                                                              - Expertise
                                                                              - Common processes and application of best practices
                                                     Unison Forsikring        - Purchasing
                                     Conecto
                                     (100 %)
                                                         (100%)
                                                                             Regional competence centres
                                                                              - Payment services: Trondheim
                (Bank-owned companies)                                        - Credit: Stavanger
                                                                              -T i i
                                                                                Training: T
                                                                                          Tromsø
               SpareBank 1 Boligkreditt
                  EiendomsMegler 1
                       BNbank
             SpareBank 1 Oslo og Akershus


22
SpareBank 1 Gruppen
     Profit for 1st half-year 2011
                    half year
                                                              Half year          Year
             Figures in MNOK                               2011       2010       2010

             Part of result from subsidiaries before tax
              - SpareBank 1 Livsforsikring                   238.4      192.2       350.4
              - SpareBank 1 Skadeforsikring Group            106.5       79.7       641.1
              - ODIN Forvaltning                              24.1
                                                              24 1       31.1
                                                                         31 1        64.6
                                                                                     64 6
              - SpareBank 1 Markets                          -25.5       -4.6       -57.6
              - SpareBank 1 Medlemskort                        5.6        6.6        11.1
              - SpareBank 1 Gruppen Finans Group               9.8        6.9         8.6
              - Correction Group                              14.2       31.3        17.6
             Net result before tax from subsidiaries        373.1      343.3     1,036.0
             Total operating costs (parent company)          -43.2      -31.9        -7.6
             Net investment charges (parent company)         -22.1      -16.2       -43.2
             Pre- tax result                                307.7      295.2       985.1
             Taxes                                           -58.6      -46.8      -153.6
             Net result for the period                      249.1      248.4       831.6

             Majority interest                               250.4      249.2       841.0
             Minority interest                                -1.3       -0.8        -9.5

                                                              Half year          Year
             Key figures                                   2011       2010       2010
             Annualised return on equity                    10.1 %      11.9 %     18.7 %


23
SpareBank 1 Gruppen
     Quarterly profits

                                               Q2        Q1        Q4        Q3        Q2        Q1        Q4        Q3        Q2
Figures in MNOK                               2011      2011      2010      2010      2010      2010      2009      2009      2009

Part of result from subsidiaries before tax
 - SpareBank 1 Livsforsikring                   109.0
                                                109 0     129.4
                                                          129 4      72.5
                                                                     72 5      85.8
                                                                               85 8     100.3
                                                                                        100 3      91.9
                                                                                                   91 9      81.0
                                                                                                             81 0      81.2
                                                                                                                       81 2     205.6
                                                                                                                                205 6
 - SpareBank 1 Skadeforsikring Group             56.2      50.3     307.5     253.9      43.4      36.3     115.3     272.8     184.9
 - ODIN Forvaltning                              12.2      11.9      16.5      17.0      16.7      14.4      24.0      16.0       9.6
 - SpareBank 1 Markets                          -22.1      -3.4     -24.0     -29.0      -1.9      -2.7      -9.5     -14.6     -11.9
 - SpareBank 1 Medlemskort                        2.5       3.1       1.9       2.7       3.3       3.4       0.7       1.8       4.1
 - SpareBank 1 Gruppen Finans Group               3.0       6.8       6.6      -4.9       7.0      -0.1       2.3       3.9      11.0
 - Correction Group                              15.1      -0.9      -6.3      -7.4      16.3      15.1      -8.6      12.0      -6.0
Net result before tax from subsidiaries        175.9     197.1     374.6     318.1     185.1     158.2     205.2     373.1     355.4
Total operating costs (parent company)          -15.6     -27.7     -16.5      40.7     -11.9     -20.0     -15.5     -13.2     -12.1
Net investment charges (parent company)         -15.0      -7.1     -15.6     -11.4      -9.3      -6.9      -9.8      -2.1      -7.0
Pre- tax result                                145.4     162.4     342.5     347.4     163.9     131.3     177.2     357.7     373.8
Taxes                                           -48.1     -10.5     -18.5     -88.4      -8.3     -38.5      -9.3     -27.3    -131.4
Net result for the period                       97.2     151.9     324.0     259.1     155.6      92.8     167.9     330.4     242.4

Majority interest                                98.0     152.4     327.9     263.9     155.9      93.3     169.6     333.1     244.6
Minority interest                                -0.8      -0.5      -3.9      -4.8      -0.3      -0.5      -1.7      -2.6      -2.1


24
SpareBank 1 Livsforsikring
     Profit for 1st half-year 2011
                    half year
                                                                  Q2          Q1         Q2            Half year          Year
                 Figures in MNOK                                 2011        2011       2010       2011       2010        2010
                   Insurance risk income                            333.0       335.8      321.7      668.7       637.0    1,292.6
                   Insurance risk claims                          -252.6
                                                                  -252 6      -255.5
                                                                              -255 5     -213.4
                                                                                         -213 4     -508.2
                                                                                                    -508 2       -422.7
                                                                                                                 -422 7     -939.0
                                                                                                                            -939 0
                 Risk result                                        80.4        80.2     108.3      160.6        214.3      353.6
                   Tecnical allocations                             -10.3       -10.8      -11.6      -21.1       -25.8      -28.2
                 Risk result after tecnical allocations             70.1        69.4       96.7     139.5        188.5      325.4
                   Fees                                             172.8       170.7      164.1      343.5       310.3      637.9
                   Expenses, exclusive comissions
                     p      ,                                     -138.6      -129.7     -144.5     -268.2       -275.7     -589.2
                   Comissions                                       -58.5       -59.8      -59.4    -118.2       -115.3     -235.6
                 Administration result                             -24.2       -18.7      -39.8      -42.9       -80.6     -186.9
                   Net investment income                            207.3       319.1      234.0      526.4       410.3      764.3
                   Guaranteed interest to policyholders             -99.2     -113.3     -105.5     -212.5       -212.5     -447.0
                 Investment result                                108.0       205.8      128.5      313.8        197.8      317.3
                   Reserves                                           0.0       -33.0      -12.0      -33.0       -24.0      -45.3
                 Investment result after reserves                 108.0       172.8      116.5      280.8        173.8      272.0
                   Compensation guaranteed interest                   5.9         5.4        9.7       11.3        14.9       29.9
                 Result before additional provisions              159.8       228.8      183.1      388.7        296.6      440.4
                   Undistributed profits to customers               -60.0     -118.9       -79.3    -178.9       -121.5     -161.7
                   Return on company's assets                         9.2
                                                                      92         19.5
                                                                                 19 5       -3.5
                                                                                             35        28.7
                                                                                                       28 7        17.0
                                                                                                                   17 0       71.6
                                                                                                                              71 6
                 Net profit to owner before tax                   109.0       129.4      100.3      238.4        192.2      350.4
                   Taxes                                            -35.3         0.5      -17.8      -34.7       -17.8      -60.2
                 Net profit/loss for the period                     73.8      129.9        82.5     203.6        174.3      290.2


                 Key figures                                                                          Half year           Year
                                                                                                   2011      2010         2010
                 Capital adequacy ratio                                                             17.1 %     22.1 %      19.3 %
                 Buffer capital in % of insurance provisions                                        14.0 %     15.4 %      14.6 %*

     * Buffer capital for the year is shown after the profit has been allocated


25
SpareBank 1 Livsforsikring
     Profit by portfolio for 1st half-year 2011


                                                                    Previously
                                           Group                   established       Investment choice       Company
        Figures in MNOK                   portfolio            individual products        portfolio          portfolio      Total
        Risk result                                    137.7                     8.7                  -6.9            0.0      139.5
        Administration result                           34.2                   -19.9                 -57.2            0.0      -42.9
        Net investment result                          222.5
                                                       222 5                    84.0
                                                                                84 0                   6.1
                                                                                                       61             1.2
                                                                                                                      12       313.8
                                                                                                                               313 8
        Reserves - long life                             0.0                   -33.0                   0.0            0.0      -33.0
        Compensation interest guarantee                 11.3                     0.0                   0.0            0.0       11.3
        Transferred to policyholders                  -144.3                   -34.5                  -0.2            0.0     -178.9
        Return on company's assets                       0.0                     0.0                   0.0           28.7       28.7
        Sum                                           261.4
                                                      261 4                      5.4
                                                                                 54                 -58 2
                                                                                                     58.2            29.8
                                                                                                                     29 8     238.4
                                                                                                                              238 4


26
SpareBank 1 Livsforsikring
     Premium income trends for 1st half-year 2011


                                                                Q2         Q1         Q2            Half year         Year
         Figures in MNOK                                       2011       2011       2010       2011       2010       2010
           Individual annuity and pension insurance                71.1       73.1       83.1      144.1      158.3      306.7
           Individual endowment insurance                         141.1      138.5      128.9      279.6      255.9      519.1
           Group pension insurance                                 55.2      242.7       72.1      297.9      324.1      549.5
           Individual life insurance                               49.0       48.0       45.4       97.0       89.9      183.1
           Group life insurance                                   131.5      217.5      125.8      348.9      335.6      587.7
           Unit Linked - Annuity                                    9.5       10.7       10.8       20.2       24.5       46.6
           Unit Linked - Endowment                                 46.6       51.6       55.4       98.2      114.3      237.0
           Defined contribution pension                           235.6      236.2      216.6      471.8      416.6      864.2
         Total gross due premium income                          739.5    1,018.2      737.9    1,757.7    1,719.3    3,293.8
           Premium reserves transferred from other companies      113.5      142.0       80.5      255.5      161.3      352.5
           Reinsurance ceded
           R i               d d                                  -40.8
                                                                   40 8      -40.2
                                                                              40 2      -42.0
                                                                                         42 0      -81.1
                                                                                                    81 1      -85.5
                                                                                                               85 5     -152.0
                                                                                                                         152 0
         Premium income for own account                         812.1     1,120.0     776.4     1,932.1    1,795.0    3,494.2


27
SpareBank 1 Livsforsikring
 Asset allocation by portfolio

     As at 30/06/11 (31/12/10)


            Group portfolio                                   Company portfolio                       Investment choice portfolio

                       14.7 (14.8) %                                             -3.3 (-1.6) %
                                                                   0.1 (0.1) %
34.9 (34.8) %                          0.9 (0.9) %                                                        42.3 (39.0) %
                                                                                     24.3 (21.0) %


           27.9 (28.0)
           27 9 (28 0) %          21.6 (21.5) %         59.8 (48.4) %              19.0 (28.8) %                             57.7 (61.0)
                                                                                                                             57 7 (61 0) %
                                                                                                      0.0 (0.0) %
Stocks                     Other
Real estate                Bonds - amortized cost    Stocks                  Other
Bonds - market value                                 Real estate             Bonds - amortized cost   Stocks         Other         Bonds
                                                     Bonds - market value
       NOK 15.6 (16.0) billion                               NOK 2.6 (2.8) billion                        NOK 6.8 (6.7) billion


28
SpareBank 1 Livsforsikring
           Return on customer portfolios with guarantee at the end of the quarter


           Value-adjusted return,
           excluding property value change:
              l di         t    l    h                                                   Booked return:


             Q1      Q2        Q1      Q2      Q1             Q2      Q1       Q2               Q1     Q2     Q1     Q2     Q1       Q2          Q1     Q2
           2011    2011      2011    2011    2011           2011    2011     2011             2011   2011   2011   2011   2011     2011        2011   2011
                                    2.7                                                               3.5
                                                                           2.5                                                           3.3
                                                                                                                                                       3.0
                                                           2.1
                                                                                                                    2.6

                                                                   1.7                         2.2


                                                                                        ent
                   1.6
Percen t


                                                                                    Perce
                             1.5
                                             1.3
                                                                                                                           1.5                  1.5
            1.1                                                                                              1.4


            SpareBank 1      Storebrand            Vital            Nordea                    SpareBank 1    Storebrand          Vital            Nordea


 29          Source: company presentations
SpareBank 1 Livsforsikring
Return on ordinary customer portfolio with guarantee as at 30/06/2011
R t         di        t        tf li   ith       t       t


                                      Percent


          Norwegian shares     -5.9

             Foreign shares                      0.9

             Money market
                 y                                     1.6

           Norwegian bonds                              1.8

             Foreign
             Fo eign bonds                                      3.0
                                                                30

            held to maturity                                  2.6

                Real estate                                         3.5


30
SpareBank 1 Livsforsikring
     Balance sheet for 1st half-year 2011
                           half year

                                                                 Half year         Year
               Figures in MNOK                                 2011      2010      2010
                 Intangible assets                                  80        26        42
                 Investments                                     2,569     2,929     2,862
                 Reinsurance's part of insurance obligations       221       226       221
                 Accounts receivable                               117       160       153
                 Other assets                                      261       153       335
                 Prepayed liabilities and accrued income             0         0         0
                 Investments group portfolio                    15,782    15,696    16,169
                 Investments options portfolio                   6,782     5,881     6,701
               Total assets                                    25,811
                                                               25 811    25,072
                                                                         25 072    26,483
                                                                                   26 483
                 Paid in capital                                 1,602     1,602     1,602
                 Other equity                                      590       561       386
                 Subordinated loan capital                         200       525       400
                 Insurance obligations - contractual            15,719    15,551    16,127
                 Insurance obligations - investment options      6,894     5,970     6,805
                 Provisions for obligations                        176       129       144
                 Premium deposits from reinsurance companies       136       131       134
                 Other obligations                                 406       527       764
                 Accrued liabilities, prepaied income               88        77       120
               Total liabilities and equity                    25,811    25,072    26,483


31
SpareBank 1 Skadeforsikring Group
     Profit for 1st half-year 2011
                    half year
                                                     Q2         Q1         Q2            Half year          Year
        Figures in MNOK                             2011       2011       2010       2011       2010        2010
        Gross written premium                       1,380.6    1,553.3    1,171.9     2,933.9    2,497.1     4,731.8
        Net earned premium                           1,137.7    1,100.8    1,007.0    2,238.5    1,972.4     4,184.4
        Net incurred claims                           -903.9     -920.7     -764.0   -1,824.6   -1,616.6    -3,208.5
        Net insurance operating costs                 -255.2     -241.1     -171.8     -496.3      -366.9     -880.6
        Other insurance income/costs                     8.2        4.5       -0.5
                                                                               0.5       12.7        -0.8
                                                                                                      0.8      132.0
        Changes in other technical reserves             21.4       26.5        4.6       47.9        34.5       39.6
        Operating result before finance                 8.2      -29.9       75.3      -21.7        22.5      266.9
        Net financial income                            66.8       95.1      -14.6      161.8        83.0      433.1
        Other costs                                      0.0        0.0       -1.0        0.0        -2.0       -2.7
        Result before changes in security reserve      75.0       65.1       59.7      140.1       103.5      697.3
        Changes in security reserve                    -18.8      -14.8      -15.9      -33.6       -23.4      -55.8
        Pre-tax profit                                 56.2       50.3       43.8      106.5        80.1      641.5
        Taxes                                          -14.4      -10.5      -12.6      -25.0        -7.1      -60.5
        Net profit/loss for the period                 41.8       39.8       31.2       81.6        73.0      581.1


        Key figures                                  Q2         Q1         Q2           Half year           Year
        Figures in percentage                       2011       2011       2010       2011      2010         2010
        Claims ratio, net                            79.4 %     83.6 %     75.9 %     81.5 %     82.0   %    76.7   %
        Cost ratio, net                              22.4 %     21.9 %     17.1 %     22.2 %     18.6   %    21.0   %
        Combined ratio net
                   ratio,                           101.9
                                                    101 9 %    105.5
                                                               105 5 %     92.9
                                                                           92 9 %    103.7
                                                                                     103 7 %    100.6
                                                                                                100 6   %    97.7
                                                                                                             97 7   %
        Capital adequacy ratio                                                        29.0 %     27.6   %    32.5   %


32
SpareBank 1 Skadeforsikring Group
     Allocation of financial assets

             As at 30/06/2011
             (31/12/10)

                                                     67.1 (66.3) %

            Bonds held as current assets                                       10.5 (10.6) %
            Bonds h ld t
            B d held to maturity
                          t it
            Real state
            Stocks
            Hedgefond                                                          13.2 (13.6) %

                                                                 9.2 (9.4) %
                                           0.1 (0.1) %


                                             NOK 9.2 (8.9) billion


33
ODIN Forvaltning
     Profit for 1st half year 2011
                    half-year


                                           Q2         Q1        Q2           Half year          Year
         Figures in MNOK                  2011       2011      2010      2011       2010        2010
         Management fees                     85.5       86.8      79.6      172.3       157.8      317.9
         Total operating income              85.5       86.8      79.6     172.3       157.8      317.9
         Salaries                            27.5       29.2      24.1       56.6        49.8      104.2
         Depreciations                         4.4       3.9       3.7        8.3         7.5       14.8
         Other operating costs               41.2       42.5      35.8       83.7        70.4      137.8
         Total operating costs               73.1       75.6      63.6     148.7       127.7      256.8
         Operating profit                    12.4       11.2      16.0      23.6        30.1       61.1
         Net financial income                 -0.2       0.7       0.7        0.5         1.0        3.6
         Pre-tax profit                      12.2       11.9      16.7      24.1        31.1       64.6
         Taxes                                 3.3       3.3       4.6        6.6         8.5       19.3
         Net profit/loss for the period        8.9       8.6      12.1      17.5        22.6        45.3


34

Presentation of results from SpareBank 1 Gruppen - 1st half-year and 2nd quarter 2011 - Kirsten Idebøen, CEO

  • 1.
    1st half-year and2nd quarter 2011 Q2 Presentation of results From SpareBank 1 Gruppen Kirsten Idebøen, CEO August 10th 2011
  • 2.
    Good underlying earningsimprovement marred by weak equity markets and flood damage Group pre-tax profit* (MNOK) quarterly (MNOK), • Pre-tax profit for 1st half-year was MNOK 308 (295). Pre tax half year Pre-tax profit for Q2 was MNOK 145 (164) – Non-recurring effects in 2010 related to pensions, as 373.8 a result of winding up surviving spouse and children’s pension and the discontinuation of the old Q1 Q2 early retirement pension (AFP), totalling MNOK 45.8 and MNOK 38.5, respectively, MNOK 69 of which was in Q2 163.1 163.9 162 145.4 • Profit after tax for 1st half-year was MNOK 249 (248) 131 Profit after tax in Q2 was MNOK 97 (156) 87 68 • Annualised return on equity: 10.1 (11.9) % • Capital adequacy ratio of 16.2 (17.8) % Core capital adequacy ratio of was 13.9 (12.7) % 2008 2009 2010 2011 • Group's total assets were NOK 41.5 billion, compared with NOK 40.7 billion at year-end 2010 * Comparison figures for 2008 and 2009 have been restated and do not include the Bank 1 Oslo Group 2
  • 3.
    Improved profit inlife and P&C insurance companies Pre-tax profit by subsidiary (MNOK) • Significantly improved administration result and good investment result for life insurance 238 • Good portfolio growth provides increased 192 premium income for P&C insurance. Improved financial result, but weaker 1H2010 1H 2011 insurance result 107 • High non-recurring costs in ODIN Forvaltning. T t l assets under management F lt i Total t d t declined by NOK 2.2 billion 80 31 24 • Factoring and the debt recovery business 7 10 -5 -26 performed well, but marred by increasing pressure on margins ts SB1 Liv SB1 Skade SB1G Finans • Higher Hi h costs i SB1 M k t as a t in Markets SB1 Market ODIN consequence of planned new recruitment S 3
  • 4.
    SpareBank 1 Skadeforsikring Group Good portfolio growth in 1st half-year. Improved financial results 4
  • 5.
    SpareBank 1 SkadeforsikringGroup Good po t o o g o t in 1st half-year. Improved financial results portfolio growth a yea p o ed a c a esu ts Pre-tax profit Pre tax profit, quarterly (MNOK) • Total portfolio of NOK 5 billion. A growth of 207 MNOK 277, or 5.9 %, since end of 2010 – MNOK 97 from Unison Forsikring Q11 k Q2 2 k 1.kv 2.kv – MNOK 180 from SpareBank 1 Skadeforsikring 125 • Pre-tax profit was MNOK 107 (80) for 1st 54 50 56 half-year and MNOK 56 (43) i Q2 h lf d in 48 43 – Insurance result*: MNOK -22 (23) and MNOK 36 8 (75) in Q2 – Financial income: MNOK 162 (83) and MNOK 67 (-15) in Q2 – Financial return of 1.8 (1.0) % year to date 2008 2009 2010 2011 * Insurance result for 2011 includes Unison Forsikring and Skandia Lifeline 5
  • 6.
    SpareBank 1 SkadeforsikringGroup Fewer winter-related claims this year, marked, however, winter related by large claims in Q1 and flood damage in Q2 Net combined ratio – quarterly (%) Net combined ratio – annual (%) 108.6 % 105.5 % 101.9 % 96.2 % 97.7 % 99.6 % 100.3 % 94.6 % 94.0 % 20.2 % 89.9 % 21.0 % 21.9 % 93.9 % 22.5 % 92.9 % 87.2 % 20.7 % 22.4 % 90.9 % 21.9 % 23.8 % 24.8 % 89.8 % 20.6 % 17 % 22.2 % 20.5 % 21.8 % 22.7 % 7.1 2 5 2 8 2 2 88 % 83 % 79.4 % 76.6 % 75.9 % 74.8 % 8.3 71.7 % 3.6 69.2 % 67.1 % 4 6 9 8 76.7 % 73.9 % 73.8 % 72.1 % 69.3 % 66.7 % Q2 Q3 Q4 Q1 Q2 Q3 Q4 Q1 Q2 2009 2009 2009 2010 2010 2010 2010 2011 2011 Net claims ratio Net cost ratio Adjusted for recognition of income from a non-recurring effect related to 2005 2006 2007 2008 2009 2010 pensions in 2010, 1.0 percentage point of the increase in the cost ratio is 2010 1 0 attributed to the investment in Unison Forsikring Net claims ratio Net cost ratio Extensive profit-improvement measures implemented with regard to pricing, quality of the insurance portfolio and operating costs 6
  • 7.
    SpareBank 1 p Livsforsikring Significant improvement in the administration result 7
  • 8.
    SpareBank 1 Livsforsikring Significant improvement in y g p year-to-date administration result Pre-tax profit (MNOK), quarterly Risk result trend (MNOK) 206 352 Year-end Q1 Q2 325 1st half year half-year 129 109 100 210 92 190 189 44 140 24 92 -52 2008 2009 2010 2011 2008 2009 2010 2011 • Pre-tax profit of MNOK 238 ( p (192) for 1st half- ) • Risk result after technical provisions reduced by year and MNOK 109 (100) in Q2 higher disability compensations: − MNOK 140 (189) for 1st half-year • Administration result: MNOK -43 (-81) for 1st − MNOK 70 (97) for Q2 half-year half year and MNOK -24 ( 40) in Q2 24 (-40) • Gross premium income: MNOK 1,758 (1,719) • Investment result: MNOK 314 (198) for 1st half- − CM: MNOK 1,119 (1,076) year and MNOK 108 (129) in Q2 − RM: MNOK 639 (643) ( ) – Value of real estate assets reduced by MNOK 41 in Q2 8
  • 9.
    SpareBank 1 Livsforsikring Solid buffers Buffer capital trend, quarterly (%) 16.1 % Securities adjustment reserve, annual (MNOK) 15.4 % 14.6 % 15.2 % 14.0 % 617 327 326 Q2 Q3 Q4 Q1 Q2 2010 2010 2010 2011 2011 2009 2010 1H2011 Core capital in excess of minimum Interim profit Additional provisions Securities adjustment reserve • Capital adequacy ratio: 17 1 (22.1) % 17.1 (22 1) • Buffer capital including quarterly profit: 14.0 − Term subordinated loan capital of (15.4) % MNOK 200 was redeemed in June − The net liable capital consists of • Total assets: NOK 26.2 billion, NOK 0.3 billion core capital lower than at the end of 2010 • Estimated solvency margin: 268 (322) % • Securities adjustment reserve: MNOK 326 (221) 9
  • 10.
    SpareBank 1 Forsikring Allocation of financial assets by portfolio as at 30/06/11 ( / / ) yp / / (31/12/10) SB 1 Livsforsikring SB 1 Skadeforsikring Group Group portfolio Company portfolio 0.1 (0.1) % -3.3 (-1.6) % 14.7 (14.8) % 0.1 (0.1) % 9.2 (9.4) % 13.2 (13.6) % 10.5 (10.6) % 34.9 (34.8) 34 9 (34 8) % 0.9 (0.9) 0 9 (0 9) % 24.3 (21.0) % 27.9 (28.0) % 21.6 (21.5) % 59.8 (48.4) % 19.0 (28.8) % 67.1 (66.3) % Stocks Other Stocks Other Stocks Other Real estate Bonds - amortized cost Real estate Bonds - amortized cost Real estate Bonds - amortized cost Bonds - market value Bonds - market value Bonds - market value NOK 15.6 (16.0) billion NOK 2.6 (2.8) billion NOK 9.2 (8.9) billion 10
  • 11.
    SpareBank 1 Forsikring Market unrest - consequences SB 1 Livsforsikring SB 1 Skadeforsikring Group • The fall in prices and rates up to now is • The insurance company's investment completely covered by the securities strategy has been stable in recent years. The adjustment reserve, and the fall will only have share percentage was 9.2 %, or MNOK 844, a limited effect on the results in the financial as at 30 June 2011 statements. The share percentage was 14.7 % or NOK 2.3 billion as at 30 June 2011 • No changes to the insurance company's investment strategy have been considered, • No adjustments have y been made to the j yet and the company has therefore not made p y portfolio any special adjustments after the recent turbulence in the market • The company's buffer capital situation is still good, and the company can withstand a fall in share prices of around 50 % before the additional provisions, which can be used in the accounts for 2011, are fully exploited • Whether th Wh th the portfolio should be adjusted is tf li h ld b dj t d i assessed on an ongoing basis. Taking the owner's profit and equity into account is a key component of these assessments 11
  • 12.
    ODIN Forvaltning g Good new sales of combination funds 12
  • 13.
    ODIN Forvaltning Good new sales of combination funds • Pre-tax profit for 1st h lf P t fit f t half-year: MNOK 24 (30) Pre-tax profit (MNOK), quarterly – Results are still affected by high non-recurring 30 costs, most of which were recognised in Q1 29 Q1 Q2 • Profit in Q2 of MNOK 12 (17) 17 14 12 12 • Total assets of NOK 30 1 billion 30.1 10 - Down NOK 2.2 billion since the end of 2010 • Equity fund market share of 9 9 % as of June, 9.9 June compared with 10.7 % at the end of 2010 -7 2008 2009 2010 2011 • Combination fund market share of 3.5 % for 35 1 st half-year 13
  • 14.
    SpareBank 1 Gruppen p pp Finans Group Growth in factoring and the debt recovery business, but pressure on the margins 14
  • 15.
    SpareBank 1 GruppenFinans Group Growth in factoring and the debt recovery business, but pressure on the margins Pre-tax profit year to date (MNOK) • Pre tax Pre-tax profit for 1st half-year: MNOK 9.8 half year: (6.9)* ― Reduced losses in 1st half-year have contributed to improved profit in BA Factoring, but the Factoring 12.2 company is experiencing pressure on the margins 9.4 9.8 1H2010 1H2011 ― BA Portfolio had a total portfolio volume of 6.9 MNOK 964 as of June, compared with MNOK 620 at the end of 2010. Book value of MNOK 55 4.9 3.7 ― Conecto AS s volume of business has shown a AS's 1.6 slightly rising trend over the past 12 months 1.0 ery) p** ng SB1G F io o* Conecto Factorin (debt recove Portfoli Group *Conecto was acquired with accounting effect from 10 September 2010 The profit up until the acquisition date has been entered directly against the Group s equity. Conecto 2010. Group’s equity **Pre-tax profit for SpareBank 1 Gruppen Finans Group also includes overhead costs and excess value amortisation. 15
  • 16.
    SpareBank 1 Markets Building up a leading capital market environment is progressing according to plan 16
  • 17.
    SpareBank 1 Markets Reason for this initiative Income as a percentage of total assets Composition of DnB NOR Markets' from the capital market in 2010: income for 2010:* Other market  DnB Nor 0.29 0,29 % 7% 72% making/trading revenues Nordea 0.26 0,26 % Income from the liquidity  17% 25% p portfolio Handelsbanken 0.22 0,22 % FX, interest rate and  commodity derivatives Danske bank 0.21 0,21 % 4% Securities service p SpareBank 1 Alliance 0,07 % 0.07% 0.25 % 22% Corporate Finance - Potential for over NOK 1 billion given the 25% level of Nordic peers Investment products - Mi i Minimum of 72 % of the income can be f f th i b attributed to the bank's comparative ” The SpareBank 1 Alliance, which is advantages; use of its balance sheet Norway's second largest financial ” A bank balance sheet has a comparative group, has a significant earnings advantage, which may entail a restruc- potential in the capital market area turing of the broker industry over time ” ” 17 * Source: Annual Accounts 2010, DnB NOR
  • 18.
    SpareBank 1 Markets Building up a leading capital market environment is p g g p g p progressing g according to plan Operative matters • A go Sec ities changed its name to Argo Securities SpareBank 1 Markets • The recruitment work has basically been completed and the organisation will be operative in 2011 – The acquisition of UB Securities in London provides access to international investment environments Results • Pre-tax loss for 1st half-year: MNOK -26 (-5) • Pre-tax loss in Q2: MNOK -22 (-2) • Revenue: R - Commission income on stocks and derivatives: MNOK 21 (20) - Debt capital markets: MNOK 8 (9) - Corporate Finance: MNOK 22 (15) A leading capital market environment is strategically important - and has a significant earnings potential for the SpareBank 1 Alliance 18
  • 19.
    Future outlook SPAREBANK 1 GRUPPEN • A ti i t continued good growth for the most important companies in Anticipates ti d d th f th ti t t i i SpareBank 1 Gruppen • Growth increases the costs in the short term, but it also provides a good , p g foundation for increased future earnings • Increased volatility in the financial markets entails greater uncertainty for the financial results, which represent a significant part of SpareBank 1 G ppen's es lts hich ep esent pa t Spa eBank Gruppen's value creation • SpareBank 1 Gruppen is well equipped to meet the new capital requirements p pp q pp p q with regard to the introduction of Solvency II • There will be an increased focus on interaction across the companies in order to realise efficiency gains on both cost and income 19
  • 20.
    Norway s Norway's savings bank 20 20
  • 21.
    Appendix A di 21
  • 22.
    SpareBank 1 Alliance SpareBank 1 SpareBank 1 SpareBank 1 Sparebanken Samarbeidende LO (Trade Union) SR-Bank SMN Nord-Norge Hedmark Sparebanker (10%) (19.5%) (19.5%) (19.5%) (12%) (19.5%) SpareBank 1 Gruppen AS SpareBank 1 ODIN SpareBank 1 Markets Livsforsikring Forvaltning (96.1%) (100%) (100%) Alliance Cooperation SpareBank 1 SpareBank 1 SpareBank 1 Medlemskort Gruppen Finans Skadeforsikring Broad cooperation (100%) (100%) (100%) - Technology - Brand/communication - Expertise - Common processes and application of best practices Unison Forsikring - Purchasing Conecto (100 %) (100%) Regional competence centres - Payment services: Trondheim (Bank-owned companies) - Credit: Stavanger -T i i Training: T Tromsø SpareBank 1 Boligkreditt EiendomsMegler 1 BNbank SpareBank 1 Oslo og Akershus 22
  • 23.
    SpareBank 1 Gruppen Profit for 1st half-year 2011 half year Half year Year Figures in MNOK 2011 2010 2010 Part of result from subsidiaries before tax - SpareBank 1 Livsforsikring 238.4 192.2 350.4 - SpareBank 1 Skadeforsikring Group 106.5 79.7 641.1 - ODIN Forvaltning 24.1 24 1 31.1 31 1 64.6 64 6 - SpareBank 1 Markets -25.5 -4.6 -57.6 - SpareBank 1 Medlemskort 5.6 6.6 11.1 - SpareBank 1 Gruppen Finans Group 9.8 6.9 8.6 - Correction Group 14.2 31.3 17.6 Net result before tax from subsidiaries 373.1 343.3 1,036.0 Total operating costs (parent company) -43.2 -31.9 -7.6 Net investment charges (parent company) -22.1 -16.2 -43.2 Pre- tax result 307.7 295.2 985.1 Taxes -58.6 -46.8 -153.6 Net result for the period 249.1 248.4 831.6 Majority interest 250.4 249.2 841.0 Minority interest -1.3 -0.8 -9.5 Half year Year Key figures 2011 2010 2010 Annualised return on equity 10.1 % 11.9 % 18.7 % 23
  • 24.
    SpareBank 1 Gruppen Quarterly profits Q2 Q1 Q4 Q3 Q2 Q1 Q4 Q3 Q2 Figures in MNOK 2011 2011 2010 2010 2010 2010 2009 2009 2009 Part of result from subsidiaries before tax - SpareBank 1 Livsforsikring 109.0 109 0 129.4 129 4 72.5 72 5 85.8 85 8 100.3 100 3 91.9 91 9 81.0 81 0 81.2 81 2 205.6 205 6 - SpareBank 1 Skadeforsikring Group 56.2 50.3 307.5 253.9 43.4 36.3 115.3 272.8 184.9 - ODIN Forvaltning 12.2 11.9 16.5 17.0 16.7 14.4 24.0 16.0 9.6 - SpareBank 1 Markets -22.1 -3.4 -24.0 -29.0 -1.9 -2.7 -9.5 -14.6 -11.9 - SpareBank 1 Medlemskort 2.5 3.1 1.9 2.7 3.3 3.4 0.7 1.8 4.1 - SpareBank 1 Gruppen Finans Group 3.0 6.8 6.6 -4.9 7.0 -0.1 2.3 3.9 11.0 - Correction Group 15.1 -0.9 -6.3 -7.4 16.3 15.1 -8.6 12.0 -6.0 Net result before tax from subsidiaries 175.9 197.1 374.6 318.1 185.1 158.2 205.2 373.1 355.4 Total operating costs (parent company) -15.6 -27.7 -16.5 40.7 -11.9 -20.0 -15.5 -13.2 -12.1 Net investment charges (parent company) -15.0 -7.1 -15.6 -11.4 -9.3 -6.9 -9.8 -2.1 -7.0 Pre- tax result 145.4 162.4 342.5 347.4 163.9 131.3 177.2 357.7 373.8 Taxes -48.1 -10.5 -18.5 -88.4 -8.3 -38.5 -9.3 -27.3 -131.4 Net result for the period 97.2 151.9 324.0 259.1 155.6 92.8 167.9 330.4 242.4 Majority interest 98.0 152.4 327.9 263.9 155.9 93.3 169.6 333.1 244.6 Minority interest -0.8 -0.5 -3.9 -4.8 -0.3 -0.5 -1.7 -2.6 -2.1 24
  • 25.
    SpareBank 1 Livsforsikring Profit for 1st half-year 2011 half year Q2 Q1 Q2 Half year Year Figures in MNOK 2011 2011 2010 2011 2010 2010 Insurance risk income 333.0 335.8 321.7 668.7 637.0 1,292.6 Insurance risk claims -252.6 -252 6 -255.5 -255 5 -213.4 -213 4 -508.2 -508 2 -422.7 -422 7 -939.0 -939 0 Risk result 80.4 80.2 108.3 160.6 214.3 353.6 Tecnical allocations -10.3 -10.8 -11.6 -21.1 -25.8 -28.2 Risk result after tecnical allocations 70.1 69.4 96.7 139.5 188.5 325.4 Fees 172.8 170.7 164.1 343.5 310.3 637.9 Expenses, exclusive comissions p , -138.6 -129.7 -144.5 -268.2 -275.7 -589.2 Comissions -58.5 -59.8 -59.4 -118.2 -115.3 -235.6 Administration result -24.2 -18.7 -39.8 -42.9 -80.6 -186.9 Net investment income 207.3 319.1 234.0 526.4 410.3 764.3 Guaranteed interest to policyholders -99.2 -113.3 -105.5 -212.5 -212.5 -447.0 Investment result 108.0 205.8 128.5 313.8 197.8 317.3 Reserves 0.0 -33.0 -12.0 -33.0 -24.0 -45.3 Investment result after reserves 108.0 172.8 116.5 280.8 173.8 272.0 Compensation guaranteed interest 5.9 5.4 9.7 11.3 14.9 29.9 Result before additional provisions 159.8 228.8 183.1 388.7 296.6 440.4 Undistributed profits to customers -60.0 -118.9 -79.3 -178.9 -121.5 -161.7 Return on company's assets 9.2 92 19.5 19 5 -3.5 35 28.7 28 7 17.0 17 0 71.6 71 6 Net profit to owner before tax 109.0 129.4 100.3 238.4 192.2 350.4 Taxes -35.3 0.5 -17.8 -34.7 -17.8 -60.2 Net profit/loss for the period 73.8 129.9 82.5 203.6 174.3 290.2 Key figures Half year Year 2011 2010 2010 Capital adequacy ratio 17.1 % 22.1 % 19.3 % Buffer capital in % of insurance provisions 14.0 % 15.4 % 14.6 %* * Buffer capital for the year is shown after the profit has been allocated 25
  • 26.
    SpareBank 1 Livsforsikring Profit by portfolio for 1st half-year 2011 Previously Group established Investment choice Company Figures in MNOK portfolio individual products portfolio portfolio Total Risk result 137.7 8.7 -6.9 0.0 139.5 Administration result 34.2 -19.9 -57.2 0.0 -42.9 Net investment result 222.5 222 5 84.0 84 0 6.1 61 1.2 12 313.8 313 8 Reserves - long life 0.0 -33.0 0.0 0.0 -33.0 Compensation interest guarantee 11.3 0.0 0.0 0.0 11.3 Transferred to policyholders -144.3 -34.5 -0.2 0.0 -178.9 Return on company's assets 0.0 0.0 0.0 28.7 28.7 Sum 261.4 261 4 5.4 54 -58 2 58.2 29.8 29 8 238.4 238 4 26
  • 27.
    SpareBank 1 Livsforsikring Premium income trends for 1st half-year 2011 Q2 Q1 Q2 Half year Year Figures in MNOK 2011 2011 2010 2011 2010 2010 Individual annuity and pension insurance 71.1 73.1 83.1 144.1 158.3 306.7 Individual endowment insurance 141.1 138.5 128.9 279.6 255.9 519.1 Group pension insurance 55.2 242.7 72.1 297.9 324.1 549.5 Individual life insurance 49.0 48.0 45.4 97.0 89.9 183.1 Group life insurance 131.5 217.5 125.8 348.9 335.6 587.7 Unit Linked - Annuity 9.5 10.7 10.8 20.2 24.5 46.6 Unit Linked - Endowment 46.6 51.6 55.4 98.2 114.3 237.0 Defined contribution pension 235.6 236.2 216.6 471.8 416.6 864.2 Total gross due premium income 739.5 1,018.2 737.9 1,757.7 1,719.3 3,293.8 Premium reserves transferred from other companies 113.5 142.0 80.5 255.5 161.3 352.5 Reinsurance ceded R i d d -40.8 40 8 -40.2 40 2 -42.0 42 0 -81.1 81 1 -85.5 85 5 -152.0 152 0 Premium income for own account 812.1 1,120.0 776.4 1,932.1 1,795.0 3,494.2 27
  • 28.
    SpareBank 1 Livsforsikring Asset allocation by portfolio As at 30/06/11 (31/12/10) Group portfolio Company portfolio Investment choice portfolio 14.7 (14.8) % -3.3 (-1.6) % 0.1 (0.1) % 34.9 (34.8) % 0.9 (0.9) % 42.3 (39.0) % 24.3 (21.0) % 27.9 (28.0) 27 9 (28 0) % 21.6 (21.5) % 59.8 (48.4) % 19.0 (28.8) % 57.7 (61.0) 57 7 (61 0) % 0.0 (0.0) % Stocks Other Real estate Bonds - amortized cost Stocks Other Bonds - market value Real estate Bonds - amortized cost Stocks Other Bonds Bonds - market value NOK 15.6 (16.0) billion NOK 2.6 (2.8) billion NOK 6.8 (6.7) billion 28
  • 29.
    SpareBank 1 Livsforsikring Return on customer portfolios with guarantee at the end of the quarter Value-adjusted return, excluding property value change: l di t l h Booked return: Q1 Q2 Q1 Q2 Q1 Q2 Q1 Q2 Q1 Q2 Q1 Q2 Q1 Q2 Q1 Q2 2011 2011 2011 2011 2011 2011 2011 2011 2011 2011 2011 2011 2011 2011 2011 2011 2.7 3.5 2.5 3.3 3.0 2.1 2.6 1.7 2.2 ent 1.6 Percen t Perce 1.5 1.3 1.5 1.5 1.1 1.4 SpareBank 1 Storebrand Vital Nordea SpareBank 1 Storebrand Vital Nordea 29 Source: company presentations
  • 30.
    SpareBank 1 Livsforsikring Returnon ordinary customer portfolio with guarantee as at 30/06/2011 R t di t tf li ith t t Percent Norwegian shares -5.9 Foreign shares 0.9 Money market y 1.6 Norwegian bonds 1.8 Foreign Fo eign bonds 3.0 30 held to maturity 2.6 Real estate 3.5 30
  • 31.
    SpareBank 1 Livsforsikring Balance sheet for 1st half-year 2011 half year Half year Year Figures in MNOK 2011 2010 2010 Intangible assets 80 26 42 Investments 2,569 2,929 2,862 Reinsurance's part of insurance obligations 221 226 221 Accounts receivable 117 160 153 Other assets 261 153 335 Prepayed liabilities and accrued income 0 0 0 Investments group portfolio 15,782 15,696 16,169 Investments options portfolio 6,782 5,881 6,701 Total assets 25,811 25 811 25,072 25 072 26,483 26 483 Paid in capital 1,602 1,602 1,602 Other equity 590 561 386 Subordinated loan capital 200 525 400 Insurance obligations - contractual 15,719 15,551 16,127 Insurance obligations - investment options 6,894 5,970 6,805 Provisions for obligations 176 129 144 Premium deposits from reinsurance companies 136 131 134 Other obligations 406 527 764 Accrued liabilities, prepaied income 88 77 120 Total liabilities and equity 25,811 25,072 26,483 31
  • 32.
    SpareBank 1 SkadeforsikringGroup Profit for 1st half-year 2011 half year Q2 Q1 Q2 Half year Year Figures in MNOK 2011 2011 2010 2011 2010 2010 Gross written premium 1,380.6 1,553.3 1,171.9 2,933.9 2,497.1 4,731.8 Net earned premium 1,137.7 1,100.8 1,007.0 2,238.5 1,972.4 4,184.4 Net incurred claims -903.9 -920.7 -764.0 -1,824.6 -1,616.6 -3,208.5 Net insurance operating costs -255.2 -241.1 -171.8 -496.3 -366.9 -880.6 Other insurance income/costs 8.2 4.5 -0.5 0.5 12.7 -0.8 0.8 132.0 Changes in other technical reserves 21.4 26.5 4.6 47.9 34.5 39.6 Operating result before finance 8.2 -29.9 75.3 -21.7 22.5 266.9 Net financial income 66.8 95.1 -14.6 161.8 83.0 433.1 Other costs 0.0 0.0 -1.0 0.0 -2.0 -2.7 Result before changes in security reserve 75.0 65.1 59.7 140.1 103.5 697.3 Changes in security reserve -18.8 -14.8 -15.9 -33.6 -23.4 -55.8 Pre-tax profit 56.2 50.3 43.8 106.5 80.1 641.5 Taxes -14.4 -10.5 -12.6 -25.0 -7.1 -60.5 Net profit/loss for the period 41.8 39.8 31.2 81.6 73.0 581.1 Key figures Q2 Q1 Q2 Half year Year Figures in percentage 2011 2011 2010 2011 2010 2010 Claims ratio, net 79.4 % 83.6 % 75.9 % 81.5 % 82.0 % 76.7 % Cost ratio, net 22.4 % 21.9 % 17.1 % 22.2 % 18.6 % 21.0 % Combined ratio net ratio, 101.9 101 9 % 105.5 105 5 % 92.9 92 9 % 103.7 103 7 % 100.6 100 6 % 97.7 97 7 % Capital adequacy ratio 29.0 % 27.6 % 32.5 % 32
  • 33.
    SpareBank 1 SkadeforsikringGroup Allocation of financial assets As at 30/06/2011 (31/12/10) 67.1 (66.3) % Bonds held as current assets 10.5 (10.6) % Bonds h ld t B d held to maturity t it Real state Stocks Hedgefond 13.2 (13.6) % 9.2 (9.4) % 0.1 (0.1) % NOK 9.2 (8.9) billion 33
  • 34.
    ODIN Forvaltning Profit for 1st half year 2011 half-year Q2 Q1 Q2 Half year Year Figures in MNOK 2011 2011 2010 2011 2010 2010 Management fees 85.5 86.8 79.6 172.3 157.8 317.9 Total operating income 85.5 86.8 79.6 172.3 157.8 317.9 Salaries 27.5 29.2 24.1 56.6 49.8 104.2 Depreciations 4.4 3.9 3.7 8.3 7.5 14.8 Other operating costs 41.2 42.5 35.8 83.7 70.4 137.8 Total operating costs 73.1 75.6 63.6 148.7 127.7 256.8 Operating profit 12.4 11.2 16.0 23.6 30.1 61.1 Net financial income -0.2 0.7 0.7 0.5 1.0 3.6 Pre-tax profit 12.2 11.9 16.7 24.1 31.1 64.6 Taxes 3.3 3.3 4.6 6.6 8.5 19.3 Net profit/loss for the period 8.9 8.6 12.1 17.5 22.6 45.3 34