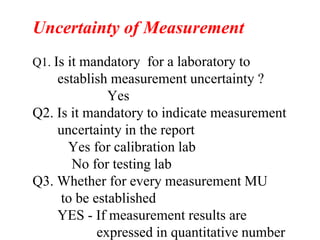
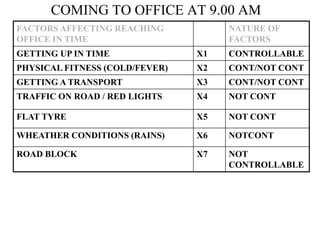
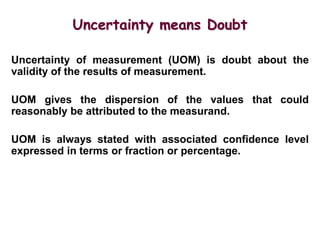
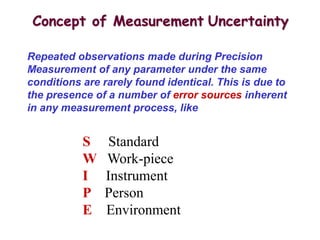
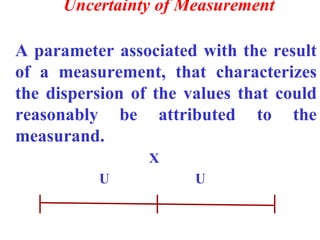
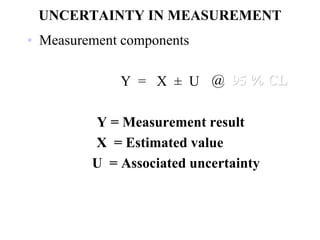
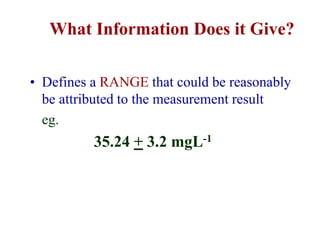
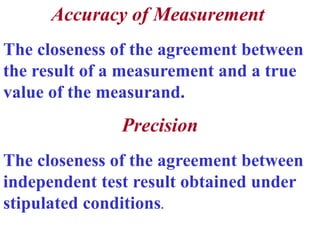
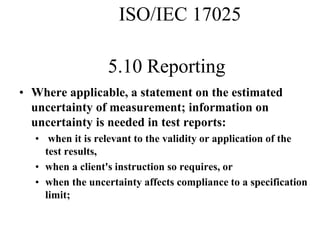
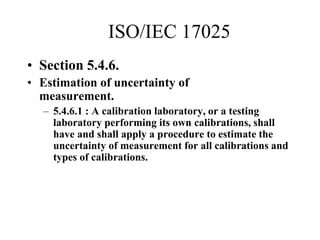
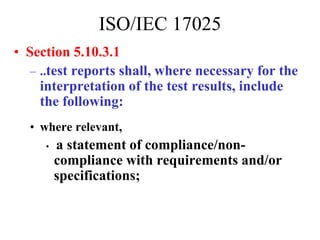
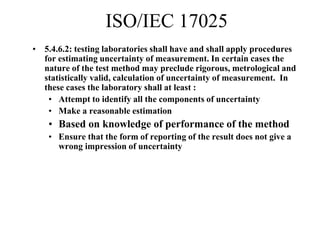
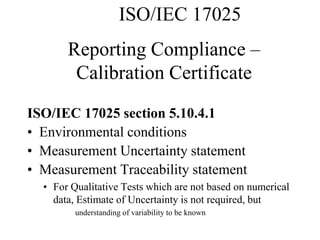
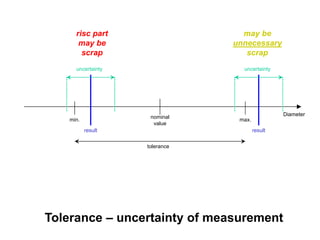
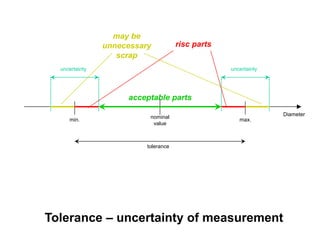
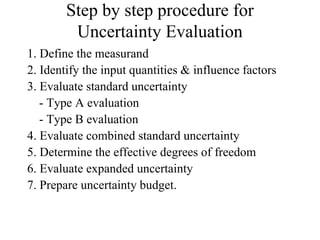
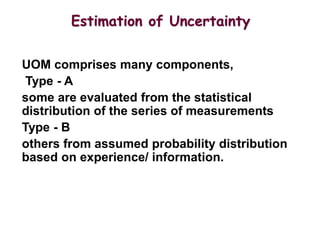
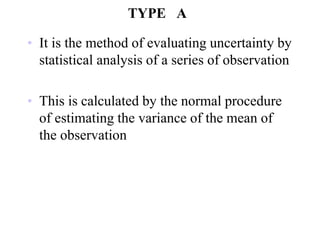
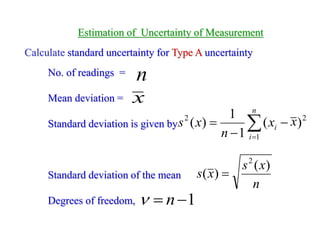
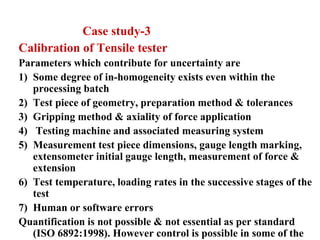
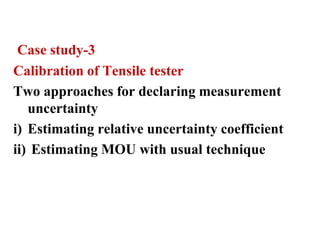
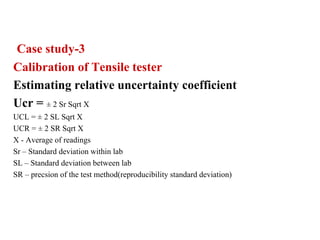
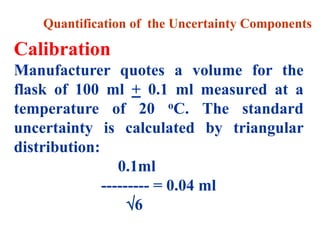
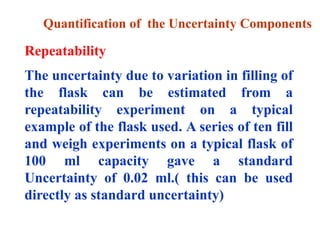
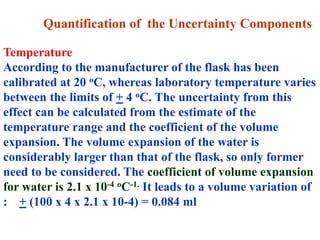
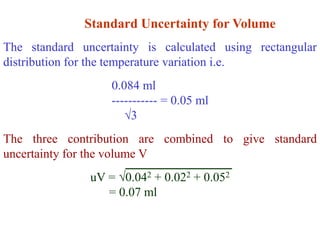
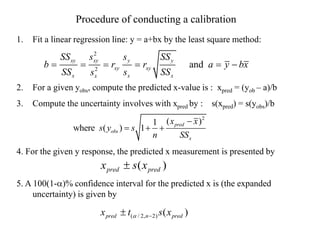
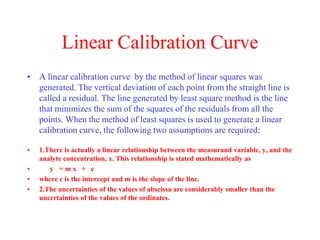
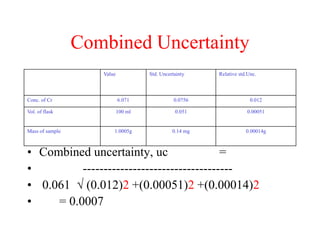
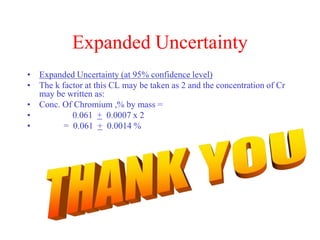
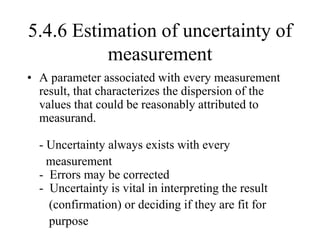
Concepts of
UNCERTAINTY
of
MEASUREMENT
S.S.Avadhani
Central Manufacturing Technology Institute
Tumkur Road, Bangalore 560 022, INDIA
Topic
• Definition of uncertainty & accuracy of
measurement
• Need for estimating measurement uncertainty
• Reference literatures for studying/learning concept
of uncertainty
• Understanding of various terminologies such as
degrees of freedom, distributions, coverage factor
associated with estimation of uncertainty
• How to estimate uncertainty
• Case studies- Typical examples with reference to
spectrometric analysis & mechanical testing
Uncertainty of Measurement
A parameter associated with the result
of a measurement, that characterizes
the dispersion of the values that could
reasonably be attributed to the
measurand.
X
U U
Uncertainty of Measurement
Measurement uncertainty is a small
number associated with a measurement
result which speaks about the possible
variation in the result if several
measurements are carried out
Uncertainty of Measurement
Q1. Is it mandatory for a laboratory to
establish measurement uncertainty ?
Yes
Q2. Is it mandatory to indicate measurement
uncertainty in the report
Yes for calibration lab
No for testing lab
Q3. Whether for every measurement MU
to be established
YES - If measurement results are
expressed in quantitative number
CAN WE REACH OFFICE IN TIME
AT 9.00 AM ?
COMING TO OFFICE AT 9.00 AM
FACTORS AFFECTING REACHING
OFFICE IN TIME
NATURE OF
FACTORS
GETTING UP IN TIME X1 CONTROLLABLE
PHYSICAL FITNESS (COLD/FEVER) X2 CONT/NOT CONT
GETTING A TRANSPORT X3 CONT/NOT CONT
TRAFFIC ON ROAD / RED LIGHTS X4 NOT CONT
FLAT TYRE X5 NOT CONT
WHEATHER CONDITIONS (RAINS) X6 NOTCONT
ROAD BLOCK X7 NOT
CONTROLLABLE
When you can measure what you are speaking
about and express it in numbers you know
something about it.
-Lord Kelvin
If you measure, do it with utmost care and
Remember the measuring errors
-An old saying
Absolute Certainty is the privilege of
uneducated minds and fanatics. For
scientific folk it is an unattainable ideal
-J Keyser
Uncertainty means Doubt
Uncertainty of measurement (UOM) is doubt about the
validity of the results of measurement.
UOM gives the dispersion of the values that could
reasonably be attributed to the measurand.
UOM is always stated with associated confidence level
expressed in terms or fraction or percentage.
UNCERTAINTY - CONCEPT
 Uncertainty is an unavoidable part of any
measurement and its significance is realised
when results are close to a specified limit.
 The proper evaluation of uncertainty is
good professional practice and can provide
laboratories and customers with valuable
information about the quality and reliability
of the result
UNCERTAINTY - CONCEPT
 It is the interval around the estimated
value between which the true value of
the measured parameter is expected to
lie
 The uncertainty is a Quantitative
indication of the Quality of the result
Uncertainty is always with us
• No measurement is perfect (since the true
value is not known perfect ness of the
result can not be ascertained)
• No measurement always repeats i.e
uncertainty exists.
• Any parameter which cannot be expressed
with certainty is associated with uncertainty
4/19/2024 ETDC(BG) 13
UNCERTAINTY IN MEASUREMENT
• IF I CAN DEFINE ‘IT’
I CAN MEASURE ‘IT’
• IF I CAN MEASURE ‘IT’
I CAN ANALYZE ‘IT’
• IF I CAN ANALYZE ‘IT’
I CAN CONTROL ‘IT’
• IF I CAN CONTROL ‘IT’
I CAN IMPROVE ‘IT’
Repeated observations made during Precision
Measurement of any parameter under the same
conditions are rarely found identical. This is due to
the presence of a number of error sources inherent
in any measurement process, like
Concept of Measurement Uncertainty
S Standard
W Work-piece
I Instrument
P Person
E Environment
Error Source - Standard
• Uncertainty associated with
certified reference masters
Error Source - Work Piece
• Non homogeneity
• Presence of foreign material
• Presence of defects
• Improper sample preparation
Errors from Scale
Graduation errors/ Pitch errors
Non-linearity/ Hystrerisis/ Zero shift
Errors from Structure
Tilt/ bend/ wear
Error Source - Instrument
Error Source - Person
•Parallax Errors
•Lack of knowledge
•Not adopting standard procedure or
deviating from laid down procedure
Error Source - Environment
• Temperature
• Humidity
• Vibrations
• Atmospheric Pressure
• Air Turbulence
• Light Intensity
• Electrostatic Charges
V (Volume) P(Purity)
Temperature
Calibration
Repeatability
Concentration
Cd
Calibration
M (Mass)
Cause & Effect Diagram
UNCERTAINTY - CONCEPT
 Uncertainty evaluation is best done by
personnel who are thoroughly familiar with
the Test & calibration and understand the
limitations of the measuring equipment and
the influences of external factor
 The lower uncertainty is usually attained by
using better equipment, better control of
environments and ensuring consistent
performance of the test.
Uncertainty of Measurement
A parameter associated with the result
of a measurement, that characterizes
the dispersion of the values that could
reasonably be attributed to the
measurand.
X
U U
UNCERTAINTY IN MEASUREMENT
• Measurement components
Y = X ± U
Y = Measurement result
X = Estimated value
U = Associated uncertainty
@ 95 % CL
What Information Does it Give?
• Defines a RANGE that could be reasonably
be attributed to the measurement result
eg.
35.24 + 3.2 mgL-1
Accuracy of Measurement
The closeness of the agreement between
the result of a measurement and a true
value of the measurand.
Precision
The closeness of the agreement between
independent test result obtained under
stipulated conditions.
Other related terms
Repeatability- It is the variability of measurement
obtained by one person while measuring same item
repeatedly
Reproducibility- It is the variability of the average
values obtained by several operator while measuring the
same item
Least count- It is the least measurable in the given
equipment
Error vs Uncertainty
• Error is a difference between true value and
measured value – Need to know the true
value.
• Uncertainty is a range – True value need not
be known.
Accurate &
Consistent
Not accurate but
Consistent
Un reliable
Reasons for evaluating uncertainty
– Accreditation requirements
• ISO/IEC 17025
– Section 5.4.6, Estimation of Uncertainty of
Measurement
– Section 5.9, Assuring the quality of Results
– Section 5.10, Reporting the Results
– ILAC/APLAC Requirements
ISO/IEC 17025
• Section 5.4.6.
– Estimation of uncertainty of
measurement.
• 5.4.6.3 when estimating the uncertainty of
measurement, all uncertainty components which
are of importance in the given situation shall be
taken into account using appropriate methods of
analysis.
5.10 Reporting
• Where applicable, a statement on the estimated
uncertainty of measurement; information on
uncertainty is needed in test reports:
• when it is relevant to the validity or application of the
test results,
• when a client's instruction so requires, or
• when the uncertainty affects compliance to a specification
limit;
ISO/IEC 17025
ISO/IEC 17025
• Section 5.4.6.
• Estimation of uncertainty of
measurement.
– 5.4.6.1 : A calibration laboratory, or a testing
laboratory performing its own calibrations, shall
have and shall apply a procedure to estimate the
uncertainty of measurement for all calibrations and
types of calibrations.
• Section 5.10.3.1
– ..test reports shall, where necessary for the
interpretation of the test results, include
the following:
• where relevant,
• a statement of compliance/non-
compliance with requirements and/or
specifications;
ISO/IEC 17025
ISO/IEC 17025
• 5.4.6.2: testing laboratories shall have and shall apply procedures
for estimating uncertainty of measurement. In certain cases the
nature of the test method may preclude rigorous, metrological and
statistically valid, calculation of uncertainty of measurement. In
these cases the laboratory shall at least :
• Attempt to identify all the components of uncertainty
• Make a reasonable estimation
• Based on knowledge of performance of the method
• Ensure that the form of reporting of the result does not give a
wrong impression of uncertainty
Reporting Compliance –
Calibration Certificate
ISO/IEC 17025 section 5.10.4.1
• Environmental conditions
• Measurement Uncertainty statement
• Measurement Traceability statement
• For Qualitative Tests which are not based on numerical
data, Estimate of Uncertainty is not required, but
understanding of variability to be known
ISO/IEC 17025
Reasons for evaluating uncertainty
• Technical importance
- Uncertainty value of a result is quantitative
indication of its quality
- Uncertainty values allows comparison of results
from different laboratories or within the lab or
with reference values given in specifications or
standards.
- Information on uncertainty can often avoid
unnecessary repetition of test.
Reasons for evaluating uncertainty
• Consideration of all the components which
contribute for uncertainty provides a means
of establishing the validity of the method &
equipment used for measurement.
• Consideration of all the components of
uncertainty provides scope for improvement
Reasons for evaluating uncertainty
• Needed while interpreting the data
Ex-1 Variation in test results pertaining to different
batches of material cannot be an indicator of
differences in properties or performance as long as
the variation is within the uncertainty limit.
Ex-2 While matching the test result with
specification for accepting or rejecting a material
Tolerance – uncertainty of measurement
Diameter
nominal
value
min. max.
tolerance
result
uncertainty
result
uncertainty
risc part
may be
scrap
may be
unnecessary
scrap
Tolerance – uncertainty of measurement
Diameter
nominal
value
min. max.
tolerance
uncertainty uncertainty
may be
unnecessary
scrap
risc parts
acceptable parts
Reference literature for study of
concept of measurement
uncertainty
• UKAS M3003
• Eurochem guide 2000-1
• NIST tn-1247 mpc
• NABL – 141
• NABL news booklet
• Reference books on statistics
Essential Requirements for
Evaluating MU
• Good knowledge of the method & an ability to
identify the factors that influence the results.
• Knowledge of, and ability to apply, simple
statistics, MU principles and evaluation strategies.
• Raw data from method validation, QC, standards,
etc.
• Experience.
Typical terms associated
with Measurement
Uncertainty
-Distribution (Normal, triangular,
Rectangular, U shaped)
-Degrees of freedom
- Coverage factor
-Confidence level
Typical terms associated
with Measurement
Uncertainty
Uncertainty Distributions that are
normally encountered when
estimating Uncertainty are:
– Normal (Gaussian)
– Rectangular
– Triangular
Normal Distribution
• Normal distribution is one way to evaluate
uncertainty contributors so that they can be
quantified and budgeted for. It allows a
manufacturer to take into account prior
knowledge, manufacturer's specifications, etc.
Normal distribution helps understand the
magnitude of different uncertainty factors and
understand what is important.
• The normal distribution is used when there is a better
probability of finding values closer to the mean value
than further away from it, and one is comfortable in
estimating the width of the variation by estimating a
certain number of standard deviations.
UNCERTAINTY IN MEASUREMENT
 Normal Distribution
x 2
-2 1
F
r
e
q
2.5%
13.37%
34.13%
34.13%
13.37%
2.5%
-1
Used where data is available from certificates, based
on theory, or from hand books,
TRIANGULAR
a- a+
u(x) = a/6
Input quantity
III. Triangular distribution:
Used where greatest probability of the values is likely to be at the
centre of the distribution.
The standard uncertainty is computed as given equation
u2(xi) = a2/6
Half width a = (a- - a+)/2
Rectangular Distribution
• Rectangular distribution is fairly
conservative. The manufacturer has
an idea of the variation limits, but little
idea as to the distribution of
uncertainty contributors between
these limits. It is often used when
information is derived from calibration
certificates and manufacturer's
specifications.
For example:
Tossing a die many times. The probability that 1
or 2 or 3 or 4 or 5 or 6 appears is same
II. Rectangular distribution:
Rectangular Distribution
Used where only upper & lower limits are known and not the
distribution of the values,(equal probability to lie anywhere within
the interval) like resolution of equipment, temperature limits
maintained.
Typical terms associated
with Measurement
Uncertainty
Degrees of freedom
Degrees of freedom is taken as one
less than the number of readings
Ex-
i) Forming a team of 5 students with
avg age as 15 years
ii) Five teams playing matches with
Typical terms associated
with Measurement
Uncertainty
Coverage factor:
Coverage factor ‘K’ is obtained
from student table
-Why this name “student table”
-Why to multiply by ‘K’ to
combined uncertainty
Typical terms associated
with Measurement
Uncertainty
Confidence level:
Laboratories are expected have
confidence limit of at least 95 %
level
It means that 5 out of 100 readings
lie beyond the stated uncertainty
limit.
TYPICAL SOURCES OF UNCERTAINTY
 SAMPLING
 STORAGE CONDITIONS
 SAMPLE PREPARATION
 INSTRUMENT EFFECTS
 REAGENT PURITY
 MEASUREMENT CONDITIONS
 MATRIX EFFECT
 CALIBRATION EFFECT
 BLANK CORRECTION
 ANALYST EFFECTS
 RANDOM EFFECTS
SAMPLING
 Stability
 Homogeneity
 Contamination
Note:
- Often the largest component
- Often beyond the control of the
analyst
INSTRUMENT EFFECTS
• ANALYTICAL BALANCE
• PH METER
• CONDUCTIVITY METER
• VISCOMETER
• REFRACTOMETER
• SPECTROMETER
SAMPLE PREPARATION
 Sub-sampling/Preparation
 Weighing
 Digestion, Dissolution etc.
 Extraction, Separation etc.
 Concentration
 Addition of Standards and Spikes
 Making up to Volume
 Dimensions
CALIBRATION
 Calibration with Pure Substance
– Stability, Linearity of Calibration
 Bias / Recovery
 Weighing, Volumetric, Temperature etc.
END MEASUREMENT
 Interferences leading to signal overlap
 Instrumental effects
 Reagent Impurities
 Memory of carryover effects
LABORATORY EFFECTS
 Chemical cross-contamination
 Laboratory and equipment temperature
changes
 Humidity
 Vibration
 Electromagnetic Interference
 Power supply instability
ANALYST EFFECTS
 Reading Scale Consistently High or
Low
 Minor variations in Applying
Method
COMPUTATION EFFECTS
 Inappropriate calibration model
 Rounding errors
 Computer software / calculation
errors
 Constants
Step by step procedure for
Uncertainty Evaluation
1. Define the measurand
2. Identify the input quantities & influence factors
3. Evaluate standard uncertainty
- Type A evaluation
- Type B evaluation
4. Evaluate combined standard uncertainty
5. Determine the effective degrees of freedom
6. Evaluate expanded uncertainty
7. Prepare uncertainty budget.
UOM comprises many components,
Type - A
some are evaluated from the statistical
distribution of the series of measurements
Type - B
others from assumed probability distribution
based on experience/ information.
Estimation of Uncertainty
TYPE A
• It is the method of evaluating uncertainty by
statistical analysis of a series of observation
• This is calculated by the normal procedure
of estimating the variance of the mean of
the observation
Estimation of Uncertainty of Measurement
Calculate standard uncertainty for Type A uncertainty
No. of readings =
Mean deviation =
Standard deviation is given by
Standard deviation of the mean
Degrees of freedom,
n
x
2
1
2
)
(
1
1
)
( 




n
i
i
x
x
n
x
s
n
x
s
x
s
)
(
)
(
2

1

 n

TYPE B
• The Type B evaluation of standard
uncertainty is the method of evaluating the
uncertainty by means other than the
statistical analysis of a series of
observations
• The standard uncertainty is evaluated by
judgment using all available information
derived from :
Type - B
Values may be derived from
– Previous measurement
– Knowledge of the behavior & properties of
relevance materials and instruments
– Manufacturer’s specification
– Data provided in calibration certificates
Type -B
Linearity U1 Least count U2
Glass wares U3 Instrument U4
CRM U5 Purity U6
Temperature U7
Relative uncertainties are obtained by
dividing individual uncertainty by respective
measurement
Estimation of Uncertainty of Measurement
Calculate combined standard uncertainty c
u
2
2
3
2
2
2
1 ........ n
c u
u
u
u
u 




Calculate effective degrees of freedom
For random errors  = n-1
For Systematic errors  


 n
i i
i
c
eff
u
u
1
4
4


Estimation of Uncertainty of Measurement
Calculate effective degrees of freedom assuming degrees of
freedom
For random uncertainty  = n-1
For Systematic uncertainty  


 n
i i
i
c
eff
u
u
1
4
4


Coverage Factor
k is the Coverage factor which depends on Effective
Degrees of Freedom and Confidence level. This can be
obtained from Student t-Distribution table.
Coverage factor ‘K’ for different effective degree of
freedom for a confidence level of 95%
veff 1 2 3 4 5 6 7 8
K 13.97 4.53 3.31 2.87 2.65 2.52 2.43 2.37
veff 10 12 14 16 18 20 25 30
K 2.28 2.23 2.20 2.17 2.15 2.13 2.11 2.09
veff 35 40 50 60 80 100 
K 2.07 2.06 2.05 2.04 2.03 2.02 2
Confidence Level
The confidence level corresponding to different
coverage factors as per Student’s “t” distribution are:
Confidence
Level
68.27% 90% 95% 95.45% 99% 99.73%
Coverage
Factor
1.00 1.645 1.960 2.000 2.576 3.000
In practice,
K = 2 is considered to have an approximate
confidence level of 95%
K = 3 is considered to have an approximate
confidence level of 99%
Expanded Uncertainty (U)
Quantity defining an interval about the result of a measurement that
may be expected to encompass a large fraction of the distribution of
values that could reasonably be attributed to the measurand.
The fraction may be regarded as the probability or level of
confidence of the interval. It is calculated from a combined standard
uncertainty and a coverage factor k using
U = k x uc
Coverage Factor (k)
Numerical factor used as a multiplier of the combined standard
uncertainty in order to obtain an expanded uncertainty. A coverage
factor is typically in the range of 2-3.
Reporting of result :
It should have the following content :
“The reported expanded uncertainty in
measurement is stated as the standard
uncertainty in measurement multiplied by
the coverage factor k which for a t-
distribution with, eff , effective degrees of
freedom corresponds to a coverage
probability of approximately 95%.
UNCERTAINTY IN MEASUREMENT
• Measurement components
Y = X ± U
Y = Measurement result
X = Estimated value
U = Associated uncertainty
@ 95 % CL
UNCERTAINTY BUDGET
Probability Detail Standard Sensitivity Uncertainty Degrees of
Source of Uncertainty Type Distribution Factor Uncertainty Co-efficient Contribution Freedom
A or B U(xi) mm
U1 0.100 B NORMAL 2.000 0.050 1.16 0.058 Infinity
U2 0.200 B RECT 1.732 0.115 1.16 0.134 Infinity
U3 2.320 B RECT 1.732 1.339 0.02 0.027 Infinity
U4 0.080 B NORMAL 2.000 0.040 1 0.040 Infinity
U5 0.500 B RECT 1.732 0.289 1 0.289 Infinity
U6 0.300 B RECT 1.732 0.173 1 0.173 Infinity
U7 0.600 B RECT 1.732 0.346 1 0.346 Infinity
U8 0.823 A 3.162 0.260 1 0.260 9
Combined Uncertainty, Uc 0.570
Degrees of freedom
Expanded Uncertainty, U k= 2 1.140 mm
Expanded Uncertainty of Measurement is at 95% confident Level with Coverage Factor K = 2
207
Uncert.of Temp. Meas.Device L*UT*aD
Uncert. Due to Diff in Temp. L*(TR-
20)*aD
Diff in Threm Exp Co- eff L*(TR-
20)*aD*0.2
Uncertainty of Master UM
Unc due to Parallelity of anvils
UP
Repeatability
Unc due to Res of Equip URE/2
Unc due to Flatness of anvils
UF
Value
Case study
Spectrometric analysis (OES)
Principle of spectrometry
•· Element gets excited by absorbing energy
· Excited element emit radiation of specific wavelength
· No two elements emit radiation of same wave length
· Intensity of light emitted is a measure of percentage content
Case study -1
Spectrometric analysis (OES)
Accuracy & repeatability of results obtained on
different spectrometers vary depending upon
•Dispersive power of grating
•Type and quality of spark source
•Detection device used etc.,
The Analyst has little no control over these factors
Case study-1
Spectrometric analysis (OES)
Factors that influence measurement uncertainty
• Number of Certified Reference Masters (CRMs)
used for calibration
2. Quality of CRM (uncertainty of CRM)
3. Mode of calibration (linear, sec degree, third
degree curve) (error in curve)
4. Improper methodology adopted while drawing
calibration curve
5. Number of burns/sparks made during calibration
6. Improper Surface Preparation
7. Inadequate warm up time
8. Ambient conditions
Case study-1
Spectrometric analysis (OES)
The parameters which are quantifiable (for which
uncertainty values exist)
Uncertainty associated with the CRM (Ucrm)
Uncertainty associated with spectral calibration curve
Ucurve
Random uncertainty of series of measurement (Ua)
Case study-1
Spectrometric analysis (OES)
Combined uncertainty
2
2
2
curve
crm
a
c u
u
u
u 


Effective degrees of freedom=


 n
i
a
c
eff
n
u
u
1
4
4

Case study-1
Spectrometric analysis (OES)
Expanded uncertainty
U = K x Uc at 95 % confidence
Case study-2
Calibration of hardness tester
Sources of uncertainty
-Certified hardness block
-Hardness testing machine
-Environment
-Operator
Case study-2
Calibration of hardness tester
Certified hardness block/Test piece
--Thickness too low
-- Stiffness of support
-- Grain structure
-- Surface roughness
-- In homogenous distribution of hardness
-- Surface cleanliness
Case study-2
Calibration of hardness tester
Hardness testing machine
-Machine frame
-Depth measuring system (for
rockwell)
-Lateral measuring system (brinell,
vickers, knoop)
-Force application system
-Indentor deformation
Case study-2
Calibration of hardness tester
Operator
-Wrong selection of test method
-Handling reading evaluation
errors
Case study-2
Calibration of hardness tester
Environment
-Temperature drift
-Vibration & shock
Case study-2
Calibration of hardness tester
There are two approaches for
hardness calibration
i) Direct calibration (tedious)
ii) Indirect calibration (normal
practice)
Case study-2
Calibration of hardness tester
Two parameters considered are
i) Type A – MOU of series of
measurement
ii) MOU associated with certified
hardness block
Case study-3
Calibration of Tensile tester
Parameters which contribute for uncertainty are
1) Some degree of in-homogeneity exists even within the
processing batch
2) Test piece of geometry, preparation method & tolerances
3) Gripping method & axiality of force application
4) Testing machine and associated measuring system
5) Measurement test piece dimensions, gauge length marking,
extensometer initial gauge length, measurement of force &
extension
6) Test temperature, loading rates in the successive stages of the
test
7) Human or software errors
Quantification is not possible & not essential as per standard
(ISO 6892:1998). However control is possible in some of the
Case study-3
Calibration of Tensile tester
Two approaches for declaring measurement
uncertainty
i) Estimating relative uncertainty coefficient
ii) Estimating MOU with usual technique
Case study-3
Calibration of Tensile tester
Estimating relative uncertainty coefficient
Ucr = ± 2 Sr Sqrt X
UCL = ± 2 SL Sqrt X
UCR = ± 2 SR Sqrt X
X - Average of readings
Sr – Standard deviation within lab
SL – Standard deviation between lab
SR – precsion of the test method(reproducibility standard deviation)
Case study-3
Calibration of Tensile tester
Usual method:
AS enclosed
Purity: purity of cadmium metal is quoted in the supplier’s
certificate is 99.99 + 0.01%. P is therefore is
0.9999 + 0.0001
Mass: the mass of the Cd metal is determined by a tared
weighing, giving m = 0.10028g
Volume: The volume of the solution having three major
sources of uncertainty:
• Uncertainty in the certified internal volume of the flask.
• Variation in filling the flask to the mark.
• Temperature difference at which calibration was done and
used.
Quantification of Uncertainty Sources
Quantification of the Uncertainty Components
PURITY
Purity of the Cd metal is given 0.9999 + 0.0001 in the
manufacturer's certificate. There is no additional information
about the uncertainty value is available, a rectangular
distribution is assumed. To obtained the standard uncertainty
u(P) the value 0.0001 has to be divided by 3.
0.0001
u(P)= ------------ = 0.000058
3
Quantification of the Uncertainty Components
Mass
The uncertainty associated with mass of the
cadmium is estimated, using the data from the
calibration certificate and the manufacturer’s
recommendations on uncertainty estimation as
0.05mg. This value have to be taken directly.
This estimate takes in to account the
contributions as identified earlier.
Quantification of the Uncertainty Components
Volume
Three major sources of influence
• Calibration of Volumetric Flask
• Repeatability
• Temperature
Quantification of the Uncertainty Components
Calibration
Manufacturer quotes a volume for the
flask of 100 ml + 0.1 ml measured at a
temperature of 20 oC. The standard
uncertainty is calculated by triangular
distribution:
0.1ml
--------- = 0.04 ml
6
Quantification of the Uncertainty Components
Repeatability
The uncertainty due to variation in filling of
the flask can be estimated from a
repeatability experiment on a typical
example of the flask used. A series of ten fill
and weigh experiments on a typical flask of
100 ml capacity gave a standard
Uncertainty of 0.02 ml.( this can be used
directly as standard uncertainty)
Quantification of the Uncertainty Components
Temperature
According to the manufacturer of the flask has been
calibrated at 20 oC, whereas laboratory temperature varies
between the limits of + 4 oC. The uncertainty from this
effect can be calculated from the estimate of the
temperature range and the coefficient of the volume
expansion. The volume expansion of the water is
considerably larger than that of the flask, so only former
need to be considered. The coefficient of volume expansion
for water is 2.1 x 10⁻⁴ oC-1. It leads to a volume variation of
: + (100 x 4 x 2.1 x 10-4) = 0.084 ml
Standard Uncertainty for Volume
The standard uncertainty is calculated using rectangular
distribution for the temperature variation i.e.
0.084 ml
----------- = 0.05 ml
3
The three contribution are combined to give standard
uncertainty for the volume V
uV = 0.042 + 0.022 + 0.052
= 0.07 ml
Description Value x u(x) u(x)/x
Purity (P) 0.9999 0.000058 0.000058
Mass (m) 100.28 0.05 mg 0.0005
Volume (ml) 100.0 0.07 ml 0.0007
Values and Uncertainties
COMBINED STANDARD UNCERTAINTY
Uc (cCd) u(P)2 u(m)2 u(V)2
--------- = ------- + ------- + --------
cCd  P m V
=  0.0000582 + 0.00052 + 0.00072
= 0.0009
Uc (cCd) = cCd x 0.0009 = 1002.7 mg l-1 x 0.0009
= 0.9 mg l-1
Expanded Uncertainty
U(cCd) = 2 x 0.9 mg l-1 = 1.8 mg l-1
The measurand in this example is concentration of lead in
the solution. The concentration is calculated by
1000.m.p
ccd = --------------- mg/l
V
Where
ccd: Concentration of cadmium in mg/l.
1000: Conversion factor from ml to l.
m: mass of high purity cleaned metal (mg).
P: Purity of metal given as mass fraction.
V: Volume of the liquid of the calibration
standard. (ml).
Calculation of Concentration
cCd is given by:
1000.m.p
cCd = --------------- mg l-1
V
Using the values calculated as above the concentration of
the standard Cadmium solution is
1000 x 100.28 x 0.9999
ccd= ------------------------------- = 1002.7mg l-1
100.0
Calculation of Concentration
Expression of the Result
Concentration of the Cadmium
Solution
1002.7 + 1.8 mg l-1
1. Introduction:
In the era of global trade, it has become very
important that there should be international
consensus in the evaluation and expression of
the uncertainty of measurement just like
universal use of the ‘International System of
Units’ (SI).
CIPM (Comite International des Poids et
Mesures) took the initiative, and the present
understanding and the international consensus
on the expression of uncertainty in
measurement are the outcome of this
Herculean task.
Experts from the BIPM (Bureau of
International des Poids et Mesures), IEC
(International Electrotechnical Commission),
ISO (International Organisation of
Standardisation) and OIML (International
Organisation for Legal Metrology) were
assigned to develop the guidance document
based upon the recommendation of the BIPM
‘Working Group’ on the ‘Standard of
Uncertainties’ which provide rules on the
expression of measurement uncertainty for
use by standardisation, calibration, laboratory
accreditation and metrology services.
This will help to achieve consensus at the
international level to have a common
document and full information on how
uncertainty statements are arrived at and will
also provide a platform for the international
comparison of measurement results.
In this method of evaluation first of all model
the measurement (mathematical formulation) to
be undertaken and then evaluate uncertainty in
measurement associated with the input
estimates using either Type A or Type B method
of evaluation. Finally express the result. In
detail these steps are as follows:
Uncertainty in Estimation by AAS-
Linear Calibration curve
VK GUPTA
SHIVA ANALYTICALS
Chromium in low alloy steel
• Summary
• The sample is dissolved in acid.The solution is made to volume and the
same is aspirated into a N2 O –Acetylene flame of AAS. Spectral
energy at approximately 3579A from a Chromium Hollow Cathode
Lamp .
• The instrument is calibrated with solutions of known Cr Content. The
concentration of the sample is calculated from the slope of the
Calibration curve. From the concentration of the sample solution in
ppm the percentage of
• Chromium in the sample is calculated as follows:
• % Cr = conc.in ppm x 10,000
• Final volume,ml x wt. of sample,g
Methodology
• Procedure
1.0005 g sample was dissolved to make 100 ml of
solution and the concentration of this solution was
found to be 6.071 ppm,as estimated using linear
calibration curve. The percentage of Cr in the
sample is calculated as follows:
• % of Chromium = 6.071 x 100
• 10,000x1.0005 =0.0608 %
=0.061
%
Steps involved
• A. Preparation of Sample solution
• B Preparation of Calibration Standards
• C. Drawing of Calibration Curve and finding the
Slope and Intercept
• D. Estimating the absorbance of the sample
solution
• E Finding the concentration of Chromium
• F Calculating the combined uncertainty of the
chromium concentration
Uncertainty in Weight
• 1g of sample is weighed to an accuracy of + 0.1 mg. The sample is
taken in a weighing dish with tare weight of 25.3456 g, and it was
found to be 1.0005 g. The uncertainty in the weighing as estimated is
0.14 mg
• As the weight is taken by difference the uncertainty in weighing arise from
• -Linearity of the Balance
• -Reproducibility of the Balance
• Component Uncertainty Uncertainty as Standard Deviation
• Linearity +0.15 mg 0.09 mg
• Reproducibility 0.04 mg
• (0-50 gm)
• Combined Uncertainty due to mass, u(mass) =
• ______________________________
• = 2x (0.09)2 + 2x( 0.04)2
• = 0.14 mg =1.4 x 10⁻⁴ g
Uncertainty of Volume
• Volumetric Flask, 100 ml
• Uncertainty Value Distribution Uncertainty as Remarks
• Component Standard Deviation
• __________ _____ _______ _______
• Calibration + 0.10 Triangular 0.10/ 6=0.04 ml IS-1997
• Accuracy
• Repeatability 0.002 ml -
• Temperature 100x3xNormal 0.063/2=0.031 ml at 95%
• Variation 2.1x10-4=0.063
• Combined Uncertainty u (Volume)
• ______________________________________
• =  0.042 + 0.0022 +0.0312
• =0.051 ml
Uncertainty in Concentration
• The standard solutions of different concentration are prepared from the
1000 ppm standard stock solution. In this case the standards of
0,1,2,4,6 and 10 ppm were prepared, after diluting the stock solution in
various ratios. The standard solutions were aspirated in the Atomic
Absorption Spectrophotometer and the absorbance of each standard
was taken in triplicate.
Conc.,x Abs.,y1 Abs.,y2 Abs.,y3 MeanAbs.,y
0 0.0107 0.0106 0.0111 0.0108
1 0.0994 0.0999 0.1001 0.0998
2 0.1977 0.1991 0.1991 0.1986
4 0.3932 0.3912 0.3932 0.3925
6 0.5769 0.5733 0.5755 0.5752
10 0.9239 0.9229 0.9262 0.9243
1. Fit a linear regression line: y = a+bx by the least square method:
2. For a given yobs, compute the predicted x-value is : xpred = (yob – a)/b
3. Compute the uncertainty involves with xpred by : s(xpred) = s(yobs)/b
4. For the given y response, the predicted x measurement is presented by
5. A 100(1-a)% confidence interval for the predicted x is (the expanded
uncertainty) is given by
2
2
and
xy xy y y
xy xy
x x x
x
SS s s SS
b r r a y bx
SS s SS
s
     
2
( )
1
where ( ) 1 pred
obs
x
x x
s y s
n SS

  
( )
pred pred
x s x

Procedure of conducting a calibration
( / 2, 2) ( )
pred n pred
x t s x
a 

Linear Calibration Curve
• A linear calibration curve by the method of linear squares was
generated. The vertical deviation of each point from the straight line is
called a residual. The line generated by least square method is the line
that minimizes the sum of the squares of the residuals from all the
points. When the method of least squares is used to generate a linear
calibration curve, the following two assumptions are required:
• 1.There is actually a linear relationship between the measurand variable, y, and the
analyte concentration, x. This relationship is stated mathematically as
• y = m x + c
• where c is the intercept and m is the slope of the line.
• 2.The uncertainties of the values of abscissa are considerably smaller than the
uncertainties of the values of the ordinates.
Combined Uncertainty
Value Std. Uncertainty Relative std.Unc.
Conc. of Cr 6.071 0.0756 0.012
Vol. of flask 100 ml 0.051 0.00051
Mass of sample 1.0005g 0.14 mg 0.00014g
• Combined uncertainty, uc =
• ------------------------------------
• 0.061  (0.012)2 +(0.00051)2 +(0.00014)2
• = 0.0007
Expanded Uncertainty
• Expanded Uncertainty (at 95% confidence level)
• The k factor at this CL may be taken as 2 and the concentration of Cr
may be written as:
• Conc. Of Chromium ,% by mass =
• 0.061 + 0.0007 x 2
• = 0.061 + 0.0014 %
5.9 Assuring the quality of test
& calibration results
• The lab shall have quality control procedure
Quality Control
Activities aimed
- At monitoring quality of product or services
through out the testing/cal process
- Identifying the unsatisfactory performance
The quality of work carried out by the lab can be
monitored by following methods
5.9 Assuring the quality of test
& calibration results
- Regular use of CRM and/or secondary
reference materials
- Participation in PT/ILC programme
- Replicate test/cal using the same or different
methods
- Retesting or recalibration of retained item
- Correlation of results for different
characteristics of an item
5.9 Assuring the quality of test
& calibration results
The resulting data shall be recorded in such a
way that
- Trends are detectable
- Statistical techniques can be applied
for reviewing of the results
5.4.6 Estimation of uncertainty of
measurement
• A parameter associated with every measurement
result, that characterizes the dispersion of the
values that could be reasonably attributed to
measurand.
- Uncertainty always exists with every
measurement
- Errors may be corrected
- Uncertainty is vital in interpreting the result
(confirmation) or deciding if they are fit for
purpose
5.4.6 Estimation of uncertainty of
measurement
• 5.4.6.1
Calibration laboratory
- Shall have and apply procedure for estimating
uncertainty for all calibration and shall indicate
in the calibration report.
5.4.6 Estimation of uncertainty of
measurement
5.4.6.2
Testing Laboratory
- Shall have and apply procedure for estimating
uncertainty for all in house calibration of all the
equipment
- Shall establish uncertainty for the test results
obtained through every method
5.4.6 Estimation of uncertainty of
measurement
How to quantify uncertainty ?
All the factors that contribute for the uncertainty
shall be considered while estimating uncertainty
(NABL 141 may be refered for guidelines)
Types of uncertainty
- Type A (Uncertainty associated with series of
measurement)
- Type B (Uncertainty associated with the
equipment, reference materials, environmental
affect)
Thank you
More you read more Knowledgeable you are

Presentation on Measurement Uncertainity.ppt

  • 1.
    Concepts of UNCERTAINTY of MEASUREMENT S.S.Avadhani Central ManufacturingTechnology Institute Tumkur Road, Bangalore 560 022, INDIA
  • 2.
    Topic • Definition ofuncertainty & accuracy of measurement • Need for estimating measurement uncertainty • Reference literatures for studying/learning concept of uncertainty • Understanding of various terminologies such as degrees of freedom, distributions, coverage factor associated with estimation of uncertainty • How to estimate uncertainty • Case studies- Typical examples with reference to spectrometric analysis & mechanical testing
  • 3.
    Uncertainty of Measurement Aparameter associated with the result of a measurement, that characterizes the dispersion of the values that could reasonably be attributed to the measurand. X U U
  • 4.
    Uncertainty of Measurement Measurementuncertainty is a small number associated with a measurement result which speaks about the possible variation in the result if several measurements are carried out
  • 5.
    Uncertainty of Measurement Q1.Is it mandatory for a laboratory to establish measurement uncertainty ? Yes Q2. Is it mandatory to indicate measurement uncertainty in the report Yes for calibration lab No for testing lab Q3. Whether for every measurement MU to be established YES - If measurement results are expressed in quantitative number
  • 6.
    CAN WE REACHOFFICE IN TIME AT 9.00 AM ?
  • 7.
    COMING TO OFFICEAT 9.00 AM FACTORS AFFECTING REACHING OFFICE IN TIME NATURE OF FACTORS GETTING UP IN TIME X1 CONTROLLABLE PHYSICAL FITNESS (COLD/FEVER) X2 CONT/NOT CONT GETTING A TRANSPORT X3 CONT/NOT CONT TRAFFIC ON ROAD / RED LIGHTS X4 NOT CONT FLAT TYRE X5 NOT CONT WHEATHER CONDITIONS (RAINS) X6 NOTCONT ROAD BLOCK X7 NOT CONTROLLABLE
  • 8.
    When you canmeasure what you are speaking about and express it in numbers you know something about it. -Lord Kelvin If you measure, do it with utmost care and Remember the measuring errors -An old saying Absolute Certainty is the privilege of uneducated minds and fanatics. For scientific folk it is an unattainable ideal -J Keyser
  • 9.
    Uncertainty means Doubt Uncertaintyof measurement (UOM) is doubt about the validity of the results of measurement. UOM gives the dispersion of the values that could reasonably be attributed to the measurand. UOM is always stated with associated confidence level expressed in terms or fraction or percentage.
  • 10.
    UNCERTAINTY - CONCEPT Uncertainty is an unavoidable part of any measurement and its significance is realised when results are close to a specified limit.  The proper evaluation of uncertainty is good professional practice and can provide laboratories and customers with valuable information about the quality and reliability of the result
  • 11.
    UNCERTAINTY - CONCEPT It is the interval around the estimated value between which the true value of the measured parameter is expected to lie  The uncertainty is a Quantitative indication of the Quality of the result
  • 12.
    Uncertainty is alwayswith us • No measurement is perfect (since the true value is not known perfect ness of the result can not be ascertained) • No measurement always repeats i.e uncertainty exists. • Any parameter which cannot be expressed with certainty is associated with uncertainty
  • 13.
    4/19/2024 ETDC(BG) 13 UNCERTAINTYIN MEASUREMENT • IF I CAN DEFINE ‘IT’ I CAN MEASURE ‘IT’ • IF I CAN MEASURE ‘IT’ I CAN ANALYZE ‘IT’ • IF I CAN ANALYZE ‘IT’ I CAN CONTROL ‘IT’ • IF I CAN CONTROL ‘IT’ I CAN IMPROVE ‘IT’
  • 14.
    Repeated observations madeduring Precision Measurement of any parameter under the same conditions are rarely found identical. This is due to the presence of a number of error sources inherent in any measurement process, like Concept of Measurement Uncertainty S Standard W Work-piece I Instrument P Person E Environment
  • 15.
    Error Source -Standard • Uncertainty associated with certified reference masters
  • 16.
    Error Source -Work Piece • Non homogeneity • Presence of foreign material • Presence of defects • Improper sample preparation
  • 17.
    Errors from Scale Graduationerrors/ Pitch errors Non-linearity/ Hystrerisis/ Zero shift Errors from Structure Tilt/ bend/ wear Error Source - Instrument
  • 18.
    Error Source -Person •Parallax Errors •Lack of knowledge •Not adopting standard procedure or deviating from laid down procedure
  • 19.
    Error Source -Environment • Temperature • Humidity • Vibrations • Atmospheric Pressure • Air Turbulence • Light Intensity • Electrostatic Charges
  • 20.
  • 21.
    UNCERTAINTY - CONCEPT Uncertainty evaluation is best done by personnel who are thoroughly familiar with the Test & calibration and understand the limitations of the measuring equipment and the influences of external factor  The lower uncertainty is usually attained by using better equipment, better control of environments and ensuring consistent performance of the test.
  • 22.
    Uncertainty of Measurement Aparameter associated with the result of a measurement, that characterizes the dispersion of the values that could reasonably be attributed to the measurand. X U U
  • 23.
    UNCERTAINTY IN MEASUREMENT •Measurement components Y = X ± U Y = Measurement result X = Estimated value U = Associated uncertainty @ 95 % CL
  • 24.
    What Information Doesit Give? • Defines a RANGE that could be reasonably be attributed to the measurement result eg. 35.24 + 3.2 mgL-1
  • 25.
    Accuracy of Measurement Thecloseness of the agreement between the result of a measurement and a true value of the measurand. Precision The closeness of the agreement between independent test result obtained under stipulated conditions.
  • 26.
    Other related terms Repeatability-It is the variability of measurement obtained by one person while measuring same item repeatedly Reproducibility- It is the variability of the average values obtained by several operator while measuring the same item Least count- It is the least measurable in the given equipment
  • 27.
    Error vs Uncertainty •Error is a difference between true value and measured value – Need to know the true value. • Uncertainty is a range – True value need not be known. Accurate & Consistent Not accurate but Consistent Un reliable
  • 28.
    Reasons for evaluatinguncertainty – Accreditation requirements • ISO/IEC 17025 – Section 5.4.6, Estimation of Uncertainty of Measurement – Section 5.9, Assuring the quality of Results – Section 5.10, Reporting the Results – ILAC/APLAC Requirements
  • 29.
    ISO/IEC 17025 • Section5.4.6. – Estimation of uncertainty of measurement. • 5.4.6.3 when estimating the uncertainty of measurement, all uncertainty components which are of importance in the given situation shall be taken into account using appropriate methods of analysis.
  • 30.
    5.10 Reporting • Whereapplicable, a statement on the estimated uncertainty of measurement; information on uncertainty is needed in test reports: • when it is relevant to the validity or application of the test results, • when a client's instruction so requires, or • when the uncertainty affects compliance to a specification limit; ISO/IEC 17025
  • 31.
    ISO/IEC 17025 • Section5.4.6. • Estimation of uncertainty of measurement. – 5.4.6.1 : A calibration laboratory, or a testing laboratory performing its own calibrations, shall have and shall apply a procedure to estimate the uncertainty of measurement for all calibrations and types of calibrations.
  • 32.
    • Section 5.10.3.1 –..test reports shall, where necessary for the interpretation of the test results, include the following: • where relevant, • a statement of compliance/non- compliance with requirements and/or specifications; ISO/IEC 17025
  • 33.
    ISO/IEC 17025 • 5.4.6.2:testing laboratories shall have and shall apply procedures for estimating uncertainty of measurement. In certain cases the nature of the test method may preclude rigorous, metrological and statistically valid, calculation of uncertainty of measurement. In these cases the laboratory shall at least : • Attempt to identify all the components of uncertainty • Make a reasonable estimation • Based on knowledge of performance of the method • Ensure that the form of reporting of the result does not give a wrong impression of uncertainty
  • 34.
    Reporting Compliance – CalibrationCertificate ISO/IEC 17025 section 5.10.4.1 • Environmental conditions • Measurement Uncertainty statement • Measurement Traceability statement • For Qualitative Tests which are not based on numerical data, Estimate of Uncertainty is not required, but understanding of variability to be known ISO/IEC 17025
  • 35.
    Reasons for evaluatinguncertainty • Technical importance - Uncertainty value of a result is quantitative indication of its quality - Uncertainty values allows comparison of results from different laboratories or within the lab or with reference values given in specifications or standards. - Information on uncertainty can often avoid unnecessary repetition of test.
  • 36.
    Reasons for evaluatinguncertainty • Consideration of all the components which contribute for uncertainty provides a means of establishing the validity of the method & equipment used for measurement. • Consideration of all the components of uncertainty provides scope for improvement
  • 37.
    Reasons for evaluatinguncertainty • Needed while interpreting the data Ex-1 Variation in test results pertaining to different batches of material cannot be an indicator of differences in properties or performance as long as the variation is within the uncertainty limit. Ex-2 While matching the test result with specification for accepting or rejecting a material
  • 38.
    Tolerance – uncertaintyof measurement Diameter nominal value min. max. tolerance result uncertainty result uncertainty risc part may be scrap may be unnecessary scrap
  • 39.
    Tolerance – uncertaintyof measurement Diameter nominal value min. max. tolerance uncertainty uncertainty may be unnecessary scrap risc parts acceptable parts
  • 40.
    Reference literature forstudy of concept of measurement uncertainty • UKAS M3003 • Eurochem guide 2000-1 • NIST tn-1247 mpc • NABL – 141 • NABL news booklet • Reference books on statistics
  • 41.
    Essential Requirements for EvaluatingMU • Good knowledge of the method & an ability to identify the factors that influence the results. • Knowledge of, and ability to apply, simple statistics, MU principles and evaluation strategies. • Raw data from method validation, QC, standards, etc. • Experience.
  • 42.
    Typical terms associated withMeasurement Uncertainty -Distribution (Normal, triangular, Rectangular, U shaped) -Degrees of freedom - Coverage factor -Confidence level
  • 43.
    Typical terms associated withMeasurement Uncertainty Uncertainty Distributions that are normally encountered when estimating Uncertainty are: – Normal (Gaussian) – Rectangular – Triangular
  • 44.
    Normal Distribution • Normaldistribution is one way to evaluate uncertainty contributors so that they can be quantified and budgeted for. It allows a manufacturer to take into account prior knowledge, manufacturer's specifications, etc. Normal distribution helps understand the magnitude of different uncertainty factors and understand what is important. • The normal distribution is used when there is a better probability of finding values closer to the mean value than further away from it, and one is comfortable in estimating the width of the variation by estimating a certain number of standard deviations.
  • 45.
    UNCERTAINTY IN MEASUREMENT Normal Distribution x 2 -2 1 F r e q 2.5% 13.37% 34.13% 34.13% 13.37% 2.5% -1 Used where data is available from certificates, based on theory, or from hand books,
  • 46.
    TRIANGULAR a- a+ u(x) =a/6 Input quantity III. Triangular distribution: Used where greatest probability of the values is likely to be at the centre of the distribution. The standard uncertainty is computed as given equation u2(xi) = a2/6 Half width a = (a- - a+)/2
  • 47.
    Rectangular Distribution • Rectangulardistribution is fairly conservative. The manufacturer has an idea of the variation limits, but little idea as to the distribution of uncertainty contributors between these limits. It is often used when information is derived from calibration certificates and manufacturer's specifications.
  • 48.
    For example: Tossing adie many times. The probability that 1 or 2 or 3 or 4 or 5 or 6 appears is same II. Rectangular distribution:
  • 49.
    Rectangular Distribution Used whereonly upper & lower limits are known and not the distribution of the values,(equal probability to lie anywhere within the interval) like resolution of equipment, temperature limits maintained.
  • 50.
    Typical terms associated withMeasurement Uncertainty Degrees of freedom Degrees of freedom is taken as one less than the number of readings Ex- i) Forming a team of 5 students with avg age as 15 years ii) Five teams playing matches with
  • 51.
    Typical terms associated withMeasurement Uncertainty Coverage factor: Coverage factor ‘K’ is obtained from student table -Why this name “student table” -Why to multiply by ‘K’ to combined uncertainty
  • 52.
    Typical terms associated withMeasurement Uncertainty Confidence level: Laboratories are expected have confidence limit of at least 95 % level It means that 5 out of 100 readings lie beyond the stated uncertainty limit.
  • 53.
    TYPICAL SOURCES OFUNCERTAINTY  SAMPLING  STORAGE CONDITIONS  SAMPLE PREPARATION  INSTRUMENT EFFECTS  REAGENT PURITY  MEASUREMENT CONDITIONS  MATRIX EFFECT  CALIBRATION EFFECT  BLANK CORRECTION  ANALYST EFFECTS  RANDOM EFFECTS
  • 54.
    SAMPLING  Stability  Homogeneity Contamination Note: - Often the largest component - Often beyond the control of the analyst
  • 55.
    INSTRUMENT EFFECTS • ANALYTICALBALANCE • PH METER • CONDUCTIVITY METER • VISCOMETER • REFRACTOMETER • SPECTROMETER
  • 56.
    SAMPLE PREPARATION  Sub-sampling/Preparation Weighing  Digestion, Dissolution etc.  Extraction, Separation etc.  Concentration  Addition of Standards and Spikes  Making up to Volume  Dimensions
  • 57.
    CALIBRATION  Calibration withPure Substance – Stability, Linearity of Calibration  Bias / Recovery  Weighing, Volumetric, Temperature etc.
  • 58.
    END MEASUREMENT  Interferencesleading to signal overlap  Instrumental effects  Reagent Impurities  Memory of carryover effects
  • 59.
    LABORATORY EFFECTS  Chemicalcross-contamination  Laboratory and equipment temperature changes  Humidity  Vibration  Electromagnetic Interference  Power supply instability
  • 60.
    ANALYST EFFECTS  ReadingScale Consistently High or Low  Minor variations in Applying Method
  • 61.
    COMPUTATION EFFECTS  Inappropriatecalibration model  Rounding errors  Computer software / calculation errors  Constants
  • 62.
    Step by stepprocedure for Uncertainty Evaluation 1. Define the measurand 2. Identify the input quantities & influence factors 3. Evaluate standard uncertainty - Type A evaluation - Type B evaluation 4. Evaluate combined standard uncertainty 5. Determine the effective degrees of freedom 6. Evaluate expanded uncertainty 7. Prepare uncertainty budget.
  • 63.
    UOM comprises manycomponents, Type - A some are evaluated from the statistical distribution of the series of measurements Type - B others from assumed probability distribution based on experience/ information. Estimation of Uncertainty
  • 64.
    TYPE A • Itis the method of evaluating uncertainty by statistical analysis of a series of observation • This is calculated by the normal procedure of estimating the variance of the mean of the observation
  • 65.
    Estimation of Uncertaintyof Measurement Calculate standard uncertainty for Type A uncertainty No. of readings = Mean deviation = Standard deviation is given by Standard deviation of the mean Degrees of freedom, n x 2 1 2 ) ( 1 1 ) (      n i i x x n x s n x s x s ) ( ) ( 2  1   n 
  • 66.
    TYPE B • TheType B evaluation of standard uncertainty is the method of evaluating the uncertainty by means other than the statistical analysis of a series of observations • The standard uncertainty is evaluated by judgment using all available information derived from :
  • 67.
    Type - B Valuesmay be derived from – Previous measurement – Knowledge of the behavior & properties of relevance materials and instruments – Manufacturer’s specification – Data provided in calibration certificates
  • 68.
    Type -B Linearity U1Least count U2 Glass wares U3 Instrument U4 CRM U5 Purity U6 Temperature U7 Relative uncertainties are obtained by dividing individual uncertainty by respective measurement
  • 69.
    Estimation of Uncertaintyof Measurement Calculate combined standard uncertainty c u 2 2 3 2 2 2 1 ........ n c u u u u u      Calculate effective degrees of freedom For random errors  = n-1 For Systematic errors      n i i i c eff u u 1 4 4  
  • 70.
    Estimation of Uncertaintyof Measurement Calculate effective degrees of freedom assuming degrees of freedom For random uncertainty  = n-1 For Systematic uncertainty      n i i i c eff u u 1 4 4  
  • 71.
    Coverage Factor k isthe Coverage factor which depends on Effective Degrees of Freedom and Confidence level. This can be obtained from Student t-Distribution table. Coverage factor ‘K’ for different effective degree of freedom for a confidence level of 95% veff 1 2 3 4 5 6 7 8 K 13.97 4.53 3.31 2.87 2.65 2.52 2.43 2.37 veff 10 12 14 16 18 20 25 30 K 2.28 2.23 2.20 2.17 2.15 2.13 2.11 2.09 veff 35 40 50 60 80 100  K 2.07 2.06 2.05 2.04 2.03 2.02 2
  • 72.
    Confidence Level The confidencelevel corresponding to different coverage factors as per Student’s “t” distribution are: Confidence Level 68.27% 90% 95% 95.45% 99% 99.73% Coverage Factor 1.00 1.645 1.960 2.000 2.576 3.000 In practice, K = 2 is considered to have an approximate confidence level of 95% K = 3 is considered to have an approximate confidence level of 99%
  • 73.
    Expanded Uncertainty (U) Quantitydefining an interval about the result of a measurement that may be expected to encompass a large fraction of the distribution of values that could reasonably be attributed to the measurand. The fraction may be regarded as the probability or level of confidence of the interval. It is calculated from a combined standard uncertainty and a coverage factor k using U = k x uc Coverage Factor (k) Numerical factor used as a multiplier of the combined standard uncertainty in order to obtain an expanded uncertainty. A coverage factor is typically in the range of 2-3.
  • 75.
    Reporting of result: It should have the following content : “The reported expanded uncertainty in measurement is stated as the standard uncertainty in measurement multiplied by the coverage factor k which for a t- distribution with, eff , effective degrees of freedom corresponds to a coverage probability of approximately 95%.
  • 76.
    UNCERTAINTY IN MEASUREMENT •Measurement components Y = X ± U Y = Measurement result X = Estimated value U = Associated uncertainty @ 95 % CL
  • 77.
    UNCERTAINTY BUDGET Probability DetailStandard Sensitivity Uncertainty Degrees of Source of Uncertainty Type Distribution Factor Uncertainty Co-efficient Contribution Freedom A or B U(xi) mm U1 0.100 B NORMAL 2.000 0.050 1.16 0.058 Infinity U2 0.200 B RECT 1.732 0.115 1.16 0.134 Infinity U3 2.320 B RECT 1.732 1.339 0.02 0.027 Infinity U4 0.080 B NORMAL 2.000 0.040 1 0.040 Infinity U5 0.500 B RECT 1.732 0.289 1 0.289 Infinity U6 0.300 B RECT 1.732 0.173 1 0.173 Infinity U7 0.600 B RECT 1.732 0.346 1 0.346 Infinity U8 0.823 A 3.162 0.260 1 0.260 9 Combined Uncertainty, Uc 0.570 Degrees of freedom Expanded Uncertainty, U k= 2 1.140 mm Expanded Uncertainty of Measurement is at 95% confident Level with Coverage Factor K = 2 207 Uncert.of Temp. Meas.Device L*UT*aD Uncert. Due to Diff in Temp. L*(TR- 20)*aD Diff in Threm Exp Co- eff L*(TR- 20)*aD*0.2 Uncertainty of Master UM Unc due to Parallelity of anvils UP Repeatability Unc due to Res of Equip URE/2 Unc due to Flatness of anvils UF Value
  • 78.
    Case study Spectrometric analysis(OES) Principle of spectrometry •· Element gets excited by absorbing energy · Excited element emit radiation of specific wavelength · No two elements emit radiation of same wave length · Intensity of light emitted is a measure of percentage content
  • 79.
    Case study -1 Spectrometricanalysis (OES) Accuracy & repeatability of results obtained on different spectrometers vary depending upon •Dispersive power of grating •Type and quality of spark source •Detection device used etc., The Analyst has little no control over these factors
  • 80.
    Case study-1 Spectrometric analysis(OES) Factors that influence measurement uncertainty • Number of Certified Reference Masters (CRMs) used for calibration 2. Quality of CRM (uncertainty of CRM) 3. Mode of calibration (linear, sec degree, third degree curve) (error in curve) 4. Improper methodology adopted while drawing calibration curve 5. Number of burns/sparks made during calibration 6. Improper Surface Preparation 7. Inadequate warm up time 8. Ambient conditions
  • 81.
    Case study-1 Spectrometric analysis(OES) The parameters which are quantifiable (for which uncertainty values exist) Uncertainty associated with the CRM (Ucrm) Uncertainty associated with spectral calibration curve Ucurve Random uncertainty of series of measurement (Ua)
  • 82.
    Case study-1 Spectrometric analysis(OES) Combined uncertainty 2 2 2 curve crm a c u u u u    Effective degrees of freedom=    n i a c eff n u u 1 4 4 
  • 83.
    Case study-1 Spectrometric analysis(OES) Expanded uncertainty U = K x Uc at 95 % confidence
  • 84.
    Case study-2 Calibration ofhardness tester Sources of uncertainty -Certified hardness block -Hardness testing machine -Environment -Operator
  • 85.
    Case study-2 Calibration ofhardness tester Certified hardness block/Test piece --Thickness too low -- Stiffness of support -- Grain structure -- Surface roughness -- In homogenous distribution of hardness -- Surface cleanliness
  • 86.
    Case study-2 Calibration ofhardness tester Hardness testing machine -Machine frame -Depth measuring system (for rockwell) -Lateral measuring system (brinell, vickers, knoop) -Force application system -Indentor deformation
  • 87.
    Case study-2 Calibration ofhardness tester Operator -Wrong selection of test method -Handling reading evaluation errors
  • 88.
    Case study-2 Calibration ofhardness tester Environment -Temperature drift -Vibration & shock
  • 89.
    Case study-2 Calibration ofhardness tester There are two approaches for hardness calibration i) Direct calibration (tedious) ii) Indirect calibration (normal practice)
  • 90.
    Case study-2 Calibration ofhardness tester Two parameters considered are i) Type A – MOU of series of measurement ii) MOU associated with certified hardness block
  • 91.
    Case study-3 Calibration ofTensile tester Parameters which contribute for uncertainty are 1) Some degree of in-homogeneity exists even within the processing batch 2) Test piece of geometry, preparation method & tolerances 3) Gripping method & axiality of force application 4) Testing machine and associated measuring system 5) Measurement test piece dimensions, gauge length marking, extensometer initial gauge length, measurement of force & extension 6) Test temperature, loading rates in the successive stages of the test 7) Human or software errors Quantification is not possible & not essential as per standard (ISO 6892:1998). However control is possible in some of the
  • 92.
    Case study-3 Calibration ofTensile tester Two approaches for declaring measurement uncertainty i) Estimating relative uncertainty coefficient ii) Estimating MOU with usual technique
  • 93.
    Case study-3 Calibration ofTensile tester Estimating relative uncertainty coefficient Ucr = ± 2 Sr Sqrt X UCL = ± 2 SL Sqrt X UCR = ± 2 SR Sqrt X X - Average of readings Sr – Standard deviation within lab SL – Standard deviation between lab SR – precsion of the test method(reproducibility standard deviation)
  • 94.
    Case study-3 Calibration ofTensile tester Usual method: AS enclosed
  • 95.
    Purity: purity ofcadmium metal is quoted in the supplier’s certificate is 99.99 + 0.01%. P is therefore is 0.9999 + 0.0001 Mass: the mass of the Cd metal is determined by a tared weighing, giving m = 0.10028g Volume: The volume of the solution having three major sources of uncertainty: • Uncertainty in the certified internal volume of the flask. • Variation in filling the flask to the mark. • Temperature difference at which calibration was done and used. Quantification of Uncertainty Sources
  • 96.
    Quantification of theUncertainty Components PURITY Purity of the Cd metal is given 0.9999 + 0.0001 in the manufacturer's certificate. There is no additional information about the uncertainty value is available, a rectangular distribution is assumed. To obtained the standard uncertainty u(P) the value 0.0001 has to be divided by 3. 0.0001 u(P)= ------------ = 0.000058 3
  • 97.
    Quantification of theUncertainty Components Mass The uncertainty associated with mass of the cadmium is estimated, using the data from the calibration certificate and the manufacturer’s recommendations on uncertainty estimation as 0.05mg. This value have to be taken directly. This estimate takes in to account the contributions as identified earlier.
  • 98.
    Quantification of theUncertainty Components Volume Three major sources of influence • Calibration of Volumetric Flask • Repeatability • Temperature
  • 99.
    Quantification of theUncertainty Components Calibration Manufacturer quotes a volume for the flask of 100 ml + 0.1 ml measured at a temperature of 20 oC. The standard uncertainty is calculated by triangular distribution: 0.1ml --------- = 0.04 ml 6
  • 100.
    Quantification of theUncertainty Components Repeatability The uncertainty due to variation in filling of the flask can be estimated from a repeatability experiment on a typical example of the flask used. A series of ten fill and weigh experiments on a typical flask of 100 ml capacity gave a standard Uncertainty of 0.02 ml.( this can be used directly as standard uncertainty)
  • 101.
    Quantification of theUncertainty Components Temperature According to the manufacturer of the flask has been calibrated at 20 oC, whereas laboratory temperature varies between the limits of + 4 oC. The uncertainty from this effect can be calculated from the estimate of the temperature range and the coefficient of the volume expansion. The volume expansion of the water is considerably larger than that of the flask, so only former need to be considered. The coefficient of volume expansion for water is 2.1 x 10⁻⁴ oC-1. It leads to a volume variation of : + (100 x 4 x 2.1 x 10-4) = 0.084 ml
  • 102.
    Standard Uncertainty forVolume The standard uncertainty is calculated using rectangular distribution for the temperature variation i.e. 0.084 ml ----------- = 0.05 ml 3 The three contribution are combined to give standard uncertainty for the volume V uV = 0.042 + 0.022 + 0.052 = 0.07 ml
  • 103.
    Description Value xu(x) u(x)/x Purity (P) 0.9999 0.000058 0.000058 Mass (m) 100.28 0.05 mg 0.0005 Volume (ml) 100.0 0.07 ml 0.0007 Values and Uncertainties
  • 104.
    COMBINED STANDARD UNCERTAINTY Uc(cCd) u(P)2 u(m)2 u(V)2 --------- = ------- + ------- + -------- cCd  P m V =  0.0000582 + 0.00052 + 0.00072 = 0.0009 Uc (cCd) = cCd x 0.0009 = 1002.7 mg l-1 x 0.0009 = 0.9 mg l-1 Expanded Uncertainty U(cCd) = 2 x 0.9 mg l-1 = 1.8 mg l-1
  • 105.
    The measurand inthis example is concentration of lead in the solution. The concentration is calculated by 1000.m.p ccd = --------------- mg/l V Where ccd: Concentration of cadmium in mg/l. 1000: Conversion factor from ml to l. m: mass of high purity cleaned metal (mg). P: Purity of metal given as mass fraction. V: Volume of the liquid of the calibration standard. (ml). Calculation of Concentration
  • 106.
    cCd is givenby: 1000.m.p cCd = --------------- mg l-1 V Using the values calculated as above the concentration of the standard Cadmium solution is 1000 x 100.28 x 0.9999 ccd= ------------------------------- = 1002.7mg l-1 100.0 Calculation of Concentration
  • 107.
    Expression of theResult Concentration of the Cadmium Solution 1002.7 + 1.8 mg l-1
  • 108.
    1. Introduction: In theera of global trade, it has become very important that there should be international consensus in the evaluation and expression of the uncertainty of measurement just like universal use of the ‘International System of Units’ (SI). CIPM (Comite International des Poids et Mesures) took the initiative, and the present understanding and the international consensus on the expression of uncertainty in measurement are the outcome of this Herculean task.
  • 109.
    Experts from theBIPM (Bureau of International des Poids et Mesures), IEC (International Electrotechnical Commission), ISO (International Organisation of Standardisation) and OIML (International Organisation for Legal Metrology) were assigned to develop the guidance document based upon the recommendation of the BIPM ‘Working Group’ on the ‘Standard of Uncertainties’ which provide rules on the expression of measurement uncertainty for use by standardisation, calibration, laboratory accreditation and metrology services.
  • 110.
    This will helpto achieve consensus at the international level to have a common document and full information on how uncertainty statements are arrived at and will also provide a platform for the international comparison of measurement results. In this method of evaluation first of all model the measurement (mathematical formulation) to be undertaken and then evaluate uncertainty in measurement associated with the input estimates using either Type A or Type B method of evaluation. Finally express the result. In detail these steps are as follows:
  • 112.
    Uncertainty in Estimationby AAS- Linear Calibration curve VK GUPTA SHIVA ANALYTICALS
  • 113.
    Chromium in lowalloy steel • Summary • The sample is dissolved in acid.The solution is made to volume and the same is aspirated into a N2 O –Acetylene flame of AAS. Spectral energy at approximately 3579A from a Chromium Hollow Cathode Lamp . • The instrument is calibrated with solutions of known Cr Content. The concentration of the sample is calculated from the slope of the Calibration curve. From the concentration of the sample solution in ppm the percentage of • Chromium in the sample is calculated as follows: • % Cr = conc.in ppm x 10,000 • Final volume,ml x wt. of sample,g
  • 114.
    Methodology • Procedure 1.0005 gsample was dissolved to make 100 ml of solution and the concentration of this solution was found to be 6.071 ppm,as estimated using linear calibration curve. The percentage of Cr in the sample is calculated as follows: • % of Chromium = 6.071 x 100 • 10,000x1.0005 =0.0608 % =0.061 %
  • 115.
    Steps involved • A.Preparation of Sample solution • B Preparation of Calibration Standards • C. Drawing of Calibration Curve and finding the Slope and Intercept • D. Estimating the absorbance of the sample solution • E Finding the concentration of Chromium • F Calculating the combined uncertainty of the chromium concentration
  • 116.
    Uncertainty in Weight •1g of sample is weighed to an accuracy of + 0.1 mg. The sample is taken in a weighing dish with tare weight of 25.3456 g, and it was found to be 1.0005 g. The uncertainty in the weighing as estimated is 0.14 mg • As the weight is taken by difference the uncertainty in weighing arise from • -Linearity of the Balance • -Reproducibility of the Balance • Component Uncertainty Uncertainty as Standard Deviation • Linearity +0.15 mg 0.09 mg • Reproducibility 0.04 mg • (0-50 gm) • Combined Uncertainty due to mass, u(mass) = • ______________________________ • = 2x (0.09)2 + 2x( 0.04)2 • = 0.14 mg =1.4 x 10⁻⁴ g
  • 117.
    Uncertainty of Volume •Volumetric Flask, 100 ml • Uncertainty Value Distribution Uncertainty as Remarks • Component Standard Deviation • __________ _____ _______ _______ • Calibration + 0.10 Triangular 0.10/ 6=0.04 ml IS-1997 • Accuracy • Repeatability 0.002 ml - • Temperature 100x3xNormal 0.063/2=0.031 ml at 95% • Variation 2.1x10-4=0.063 • Combined Uncertainty u (Volume) • ______________________________________ • =  0.042 + 0.0022 +0.0312 • =0.051 ml
  • 118.
    Uncertainty in Concentration •The standard solutions of different concentration are prepared from the 1000 ppm standard stock solution. In this case the standards of 0,1,2,4,6 and 10 ppm were prepared, after diluting the stock solution in various ratios. The standard solutions were aspirated in the Atomic Absorption Spectrophotometer and the absorbance of each standard was taken in triplicate. Conc.,x Abs.,y1 Abs.,y2 Abs.,y3 MeanAbs.,y 0 0.0107 0.0106 0.0111 0.0108 1 0.0994 0.0999 0.1001 0.0998 2 0.1977 0.1991 0.1991 0.1986 4 0.3932 0.3912 0.3932 0.3925 6 0.5769 0.5733 0.5755 0.5752 10 0.9239 0.9229 0.9262 0.9243
  • 119.
    1. Fit alinear regression line: y = a+bx by the least square method: 2. For a given yobs, compute the predicted x-value is : xpred = (yob – a)/b 3. Compute the uncertainty involves with xpred by : s(xpred) = s(yobs)/b 4. For the given y response, the predicted x measurement is presented by 5. A 100(1-a)% confidence interval for the predicted x is (the expanded uncertainty) is given by 2 2 and xy xy y y xy xy x x x x SS s s SS b r r a y bx SS s SS s       2 ( ) 1 where ( ) 1 pred obs x x x s y s n SS     ( ) pred pred x s x  Procedure of conducting a calibration ( / 2, 2) ( ) pred n pred x t s x a  
  • 120.
    Linear Calibration Curve •A linear calibration curve by the method of linear squares was generated. The vertical deviation of each point from the straight line is called a residual. The line generated by least square method is the line that minimizes the sum of the squares of the residuals from all the points. When the method of least squares is used to generate a linear calibration curve, the following two assumptions are required: • 1.There is actually a linear relationship between the measurand variable, y, and the analyte concentration, x. This relationship is stated mathematically as • y = m x + c • where c is the intercept and m is the slope of the line. • 2.The uncertainties of the values of abscissa are considerably smaller than the uncertainties of the values of the ordinates.
  • 121.
    Combined Uncertainty Value Std.Uncertainty Relative std.Unc. Conc. of Cr 6.071 0.0756 0.012 Vol. of flask 100 ml 0.051 0.00051 Mass of sample 1.0005g 0.14 mg 0.00014g • Combined uncertainty, uc = • ------------------------------------ • 0.061  (0.012)2 +(0.00051)2 +(0.00014)2 • = 0.0007
  • 122.
    Expanded Uncertainty • ExpandedUncertainty (at 95% confidence level) • The k factor at this CL may be taken as 2 and the concentration of Cr may be written as: • Conc. Of Chromium ,% by mass = • 0.061 + 0.0007 x 2 • = 0.061 + 0.0014 %
  • 123.
    5.9 Assuring thequality of test & calibration results • The lab shall have quality control procedure Quality Control Activities aimed - At monitoring quality of product or services through out the testing/cal process - Identifying the unsatisfactory performance The quality of work carried out by the lab can be monitored by following methods
  • 124.
    5.9 Assuring thequality of test & calibration results - Regular use of CRM and/or secondary reference materials - Participation in PT/ILC programme - Replicate test/cal using the same or different methods - Retesting or recalibration of retained item - Correlation of results for different characteristics of an item
  • 125.
    5.9 Assuring thequality of test & calibration results The resulting data shall be recorded in such a way that - Trends are detectable - Statistical techniques can be applied for reviewing of the results
  • 126.
    5.4.6 Estimation ofuncertainty of measurement • A parameter associated with every measurement result, that characterizes the dispersion of the values that could be reasonably attributed to measurand. - Uncertainty always exists with every measurement - Errors may be corrected - Uncertainty is vital in interpreting the result (confirmation) or deciding if they are fit for purpose
  • 127.
    5.4.6 Estimation ofuncertainty of measurement • 5.4.6.1 Calibration laboratory - Shall have and apply procedure for estimating uncertainty for all calibration and shall indicate in the calibration report.
  • 128.
    5.4.6 Estimation ofuncertainty of measurement 5.4.6.2 Testing Laboratory - Shall have and apply procedure for estimating uncertainty for all in house calibration of all the equipment - Shall establish uncertainty for the test results obtained through every method
  • 129.
    5.4.6 Estimation ofuncertainty of measurement How to quantify uncertainty ? All the factors that contribute for the uncertainty shall be considered while estimating uncertainty (NABL 141 may be refered for guidelines) Types of uncertainty - Type A (Uncertainty associated with series of measurement) - Type B (Uncertainty associated with the equipment, reference materials, environmental affect)
  • 130.
    Thank you More youread more Knowledgeable you are