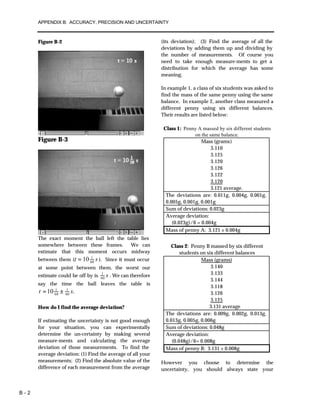
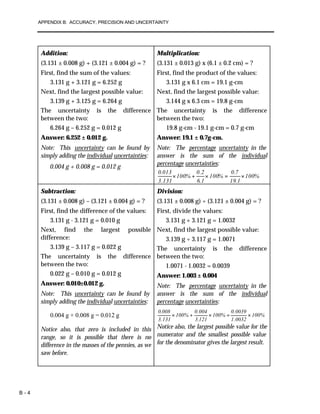
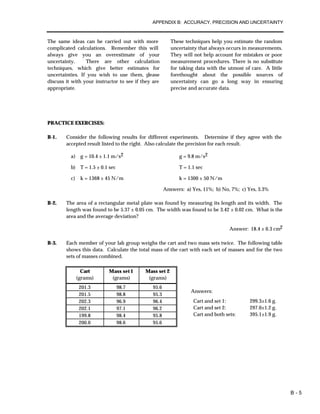
B - 1
Appendix B: Accuracy, Precision and Uncertainty
How tall are you? How old are you? When you
answered these everyday questions, you
probably did it in round numbers such as "five
foot, six inches" or "nineteen years, three
months." But how true are these answers? Are
you exactly 5' 6" tall? Probably not. You
estimated your height at 5’ 6" and just reported
two significant figures. Typically, you round
your height to the nearest inch, so that your
actual height falls somewhere between 5' 5½"
and 5' 6½" tall, or 5' 6" ± ½". This ± ½" is the
uncertainty, and it informs the reader of the
precision of the value 5' 6".
What is uncertainty?
Whenever you measure something, there is
always some uncertainty. There are two
categories of uncertainty: systematic and
random.
(1) Systematic uncertainties are those that
consistently cause the value to be too large or too
small. Systematic uncertainties include such
things as reaction time, inaccurate meter sticks,
optical parallax and miscalibrated balances. In
principle, systematic uncertainties can be
eliminated if you know they exist.
(2) Random uncertainties are variations in
the measurements that occur without a
predictable pattern. If you make precise
measurements, these uncertainties arise from the
estimated part of the measurement. Random
uncertainty can be reduced, but never eliminated.
We need a technique to report the contribution of
this uncertainty to the measured value.
How do I determine the uncertainty?
This Appendix will discuss two basic techniques
for determining the uncertainty: estimating the
uncertainty and measuring the average
deviation. Which one you choose will depend
on your need for precision. If you need a precise
determination of some value, the best technique
is to measure that value several times and use the
average deviation as the uncertainty. Examples
of finding the average deviation are given below.
How do I estimate uncertainties?
If time or experimental constraints make repeated
measurements impossible, then you will need to
estimate the uncertainty. When you estimate
uncertainties you are trying to account for
anything that might cause the measured value to
be different if you were to take the measurement
again. For example, suppose you were trying to
measure the length of a key, as in Figure B-1.
Figure B-1
If the true value were not as important as the
magnitude of the value, you could say that the
key’s length was 6cm, give or take 1cm. This is a
crude estimate, but it may be acceptable. A better
estimate of the key’s length, as you saw in
Appendix A, would be 5.81cm. This tells us that
the worst our measurement could be off is a
fraction of a mm. To be more precise, we can
estimate it to be about a third of a mm, so we can
say that the length of the key is 5.81 ± 0.03 cm.
Another time you may need to estimate
uncertainty is when you analyze video data.
Figures B-2 and B-3 show a ball rolling off the
edge of a table. These are two consecutive
frames, separated in time by 1/30 of a second.
APPENDIX B: ACCURACY, PRECISION AND UNCERTAINTY
B - 2
Figure B-2
Figure B-3
The exact moment the ball left the table lies
somewhere between these frames. We can
estimate that this moment occurs midway
between them ( st 60
1
10= ). Since it must occur
at some point between them, the worst our
estimate could be off by is s60
1
. We can therefore
say the time the ball leaves the table is
.10 60
1
60
1
st ±=
How do I find the average deviation?
If estimating the uncertainty is not good enough
for your situation, you can experimentally
determine the un-certainty by making several
measure-ments and calculating the average
deviation of those measurements. To find the
average deviation: (1) Find the average of all your
measurements; (2) Find the absolute value of the
difference of each measurement from the average
(its deviation); (3) Find the average of all the
deviations by adding them up and dividing by
the number of measurements. Of course you
need to take enough measure-ments to get a
distribution for which the average has some
meaning.
In example 1, a class of six students was asked to
find the mass of the same penny using the same
balance. In example 2, another class measured a
different penny using six different balances.
Their results are listed below:
Class 1: Penny A massed by six different students
on the same balance.
Mass (grams)
3.110
3.125
3.120
3.126
3.122
3.120
3.121 average.
The deviations are: 0.011g, 0.004g, 0.001g,
0.005g, 0.001g, 0.001g
Sum of deviations: 0.023g
Average deviation:
(0.023g)/6 = 0.004g
Mass of penny A: 3.121 ± 0.004g
Class 2: Penny B massed by six different
students on six different balances
Mass (grams)
3.140
3.133
3.144
3.118
3.126
3.125
3.131 average
The deviations are: 0.009g, 0.002g, 0.013g,
0.013g, 0.005g, 0.006g
Sum of deviations: 0.048g
Average deviation:
(0.048g)/6= 0.008g
Mass of penny B: 3.131 ± 0.008g
However you choose to determine the
uncertainty, you should always state your
APPENDIX B: ACCURACY, PRECISION AND UNCERTAINTY
B - 3
method clearly in your report. For the remainder
of this appendix, we will use the results of these
two examples.
How do I know if two values are the same?
If we compare only the average masses of the two
pennies we see that they are different. But now
include the uncertainty in the masses. For penny
A, the most likely mass is somewhere between
3.117g and 3.125g. For penny B, the most likely
mass is somewhere between 3.123g and 3.139g.
If you compare the ranges of the masses for the
two pennies, as shown in Figure B-4, they just
overlap. Given the uncertainty in the masses, we
are able to conclude that the masses of the two
pennies could be the same. If the range of the
masses did not overlap, then we ought to
conclude that the masses are probably different.
Figure B-4
Mass of pennies (in grams) with uncertainties
Which result is more precise?
Suppose you use a meter stick to measure the
length of a table and the width of a hair, each
with an uncertainty of 1 mm. Clearly you know
more about the length of the table than the width
of the hair. Your measurement of the table is very
precise but your measurement of the width of the
hair is rather crude. To express this sense of
precision, you need to calculate the percentage
uncertainty. To do this, divide the uncertainty in
the measurement by the value of the
measurement itself, and then multiply by 100%.
For example, we can calculate the precision in
the measurements made by class 1 and class 2 as
follows:
Precision of Class 1's value:
(0.004 g ÷ 3.121 g) x 100% = 0.1 %
Precision of Class 2's value:
(0.008 g ÷ 3.131 g) x 100% = 0.3 %
Class 1's results are more precise. This should
not be surprising since class 2 introduced more
uncertainty in their results by using six different
balances instead of only one.
Which result is more accurate?
Accuracy is a measure of how your measured
value compares with the real value. Imagine that
class 2 made the measurement again using only
one balance. Unfortunately, they chose a balance
that was poorly calibrated. They analyzed their
results and found the mass of penny B to be 3.556
± 0.004 g. This number is more precise than their
previous result since the uncertainty is smaller,
but the new measured value of mass is very
different from their previous value. We might
conclude that this new value for the mass of
penny B is different, since the range of the new
value does not overlap the range of the previous
value. However, that conclusion would be
wrong since our uncertainty has not taken into
account the inaccuracy of the balance. To
determine the accuracy of the measurement, we
should check by measuring something that is
known. This procedure is called calibration, and
it is absolutely necessary for making accurate
measurements.
Be cautious! It is possible to make measurements that
are extremely precise and, at the same time, grossly
inaccurate.
How can I do calculations with values that have
uncertainty?
When you do calculations with values that have
uncertainties, you will need to estimate (by
calculation) the uncertainty in the result. There
are mathematical techniques for doing this,
which depend on the statistical properties of
your measurements. A very simple way to
estimate uncertainties is to find the largest possible
uncertainty the calculation could yield. This will
always overestimate the uncertainty of your
calculation, but an overestimate is better than no
estimate. The method for performing arithmetic
operations on quantities with uncertainties is
illustrated in the following examples:
APPENDIX B: ACCURACY, PRECISION AND UNCERTAINTY
B - 4
Addition:
(3.131 ± 0.008 g) + (3.121 ± 0.004 g) = ?
First, find the sum of the values:
3.131 g + 3.121 g = 6.252 g
Next, find the largest possible value:
3.139 g + 3.125 g = 6.264 g
The uncertainty is the difference
between the two:
6.264 g – 6.252 g = 0.012 g
Answer: 6.252 ± 0.012 g.
Note: This uncertainty can be found by
simply adding the individual uncertainties:
0.004 g + 0.008 g = 0.012 g
Multiplication:
(3.131 ± 0.013 g) x (6.1 ± 0.2 cm) = ?
First, find the product of the values:
3.131 g x 6.1 cm = 19.1 g-cm
Next, find the largest possible value:
3.144 g x 6.3 cm = 19.8 g-cm
The uncertainty is the difference
between the two:
19.8 g-cm - 19.1 g-cm = 0.7 g-cm
Answer: 19.1 ± 0.7g-cm.
Note: The percentage uncertainty in the
answer is the sum of the individual
percentage uncertainties:
%100
1.19
7.0
%100
1.6
2.0
%100
131.3
013.0
×=×+×
Subtraction:
(3.131 ± 0.008 g) – (3.121 ± 0.004 g) = ?
First, find the difference of the values:
3.131 g - 3.121 g = 0.010 g
Next, find the largest possible
difference:
3.139 g – 3.117 g = 0.022 g
The uncertainty is the difference
between the two:
0.022 g – 0.010 g = 0.012 g
Answer: 0.010±0.012 g.
Note: This uncertainty can be found by
simply adding the individual uncertainties:
0.004 g + 0.008 g = 0.012 g
Notice also, that zero is included in this
range, so it is possible that there is no
difference in the masses of the pennies, as we
saw before.
Division:
(3.131 ± 0.008 g) ÷ (3.121 ± 0.004 g) = ?
First, divide the values:
3.131 g ÷ 3.121 g = 1.0032
Next, find the largest possible value:
3.139 g ÷ 3.117 g = 1.0071
The uncertainty is the difference
between the two:
1.0071 - 1.0032 = 0.0039
Answer: 1.003 ± 0.004
Note: The percentage uncertainty in the
answer is the sum of the individual
percentage uncertainties:
%100
0032.1
0039.0
%100
121.3
004.0
%100
131.3
008.0
×=×+×
Notice also, the largest possible value for the
numerator and the smallest possible value
for the denominator gives the largest result.
APPENDIX B: ACCURACY, PRECISION AND UNCERTAINTY
B - 5
The same ideas can be carried out with more
complicated calculations. Remember this will
always give you an overestimate of your
uncertainty. There are other calculation
techniques, which give better estimates for
uncertainties. If you wish to use them, please
discuss it with your instructor to see if they are
appropriate.
These techniques help you estimate the random
uncertainty that always occurs in measurements.
They will not help account for mistakes or poor
measurement procedures. There is no substitute
for taking data with the utmost of care. A little
forethought about the possible sources of
uncertainty can go a long way in ensuring
precise and accurate data.
PRACTICE EXERCISES:
B-1. Consider the following results for different experiments. Determine if they agree with the
accepted result listed to the right. Also calculate the precision for each result.
a) g = 10.4 ± 1.1 m/s2 g = 9.8 m/s2
b) T = 1.5 ± 0.1 sec T = 1.1 sec
c) k = 1368 ± 45 N/m k = 1300 ± 50 N/m
Answers: a) Yes, 11%; b) No, 7%; c) Yes, 3.3%
B-2. The area of a rectangular metal plate was found by measuring its length and its width. The
length was found to be 5.37 ± 0.05 cm. The width was found to be 3.42 ± 0.02 cm. What is the
area and the average deviation?
Answer: 18.4 ± 0.3 cm2
B-3. Each member of your lab group weighs the cart and two mass sets twice. The following table
shows this data. Calculate the total mass of the cart with each set of masses and for the two
sets of masses combined.
Cart
(grams)
Mass set 1
(grams)
Mass set 2
(grams)
201.3 98.7 95.6
201.5 98.8 95.3
202.3 96.9 96.4
202.1 97.1 96.2
199.8 98.4 95.8
200.0 98.6 95.6
Answers:
Cart and set 1: 299.3±1.6 g.
Cart and set 2: 297.0±1.2 g.
Cart and both sets: 395.1±1.9 g.
B - 6

Accuracy & uncertainty

  • 1.
    B - 1 AppendixB: Accuracy, Precision and Uncertainty How tall are you? How old are you? When you answered these everyday questions, you probably did it in round numbers such as "five foot, six inches" or "nineteen years, three months." But how true are these answers? Are you exactly 5' 6" tall? Probably not. You estimated your height at 5’ 6" and just reported two significant figures. Typically, you round your height to the nearest inch, so that your actual height falls somewhere between 5' 5½" and 5' 6½" tall, or 5' 6" ± ½". This ± ½" is the uncertainty, and it informs the reader of the precision of the value 5' 6". What is uncertainty? Whenever you measure something, there is always some uncertainty. There are two categories of uncertainty: systematic and random. (1) Systematic uncertainties are those that consistently cause the value to be too large or too small. Systematic uncertainties include such things as reaction time, inaccurate meter sticks, optical parallax and miscalibrated balances. In principle, systematic uncertainties can be eliminated if you know they exist. (2) Random uncertainties are variations in the measurements that occur without a predictable pattern. If you make precise measurements, these uncertainties arise from the estimated part of the measurement. Random uncertainty can be reduced, but never eliminated. We need a technique to report the contribution of this uncertainty to the measured value. How do I determine the uncertainty? This Appendix will discuss two basic techniques for determining the uncertainty: estimating the uncertainty and measuring the average deviation. Which one you choose will depend on your need for precision. If you need a precise determination of some value, the best technique is to measure that value several times and use the average deviation as the uncertainty. Examples of finding the average deviation are given below. How do I estimate uncertainties? If time or experimental constraints make repeated measurements impossible, then you will need to estimate the uncertainty. When you estimate uncertainties you are trying to account for anything that might cause the measured value to be different if you were to take the measurement again. For example, suppose you were trying to measure the length of a key, as in Figure B-1. Figure B-1 If the true value were not as important as the magnitude of the value, you could say that the key’s length was 6cm, give or take 1cm. This is a crude estimate, but it may be acceptable. A better estimate of the key’s length, as you saw in Appendix A, would be 5.81cm. This tells us that the worst our measurement could be off is a fraction of a mm. To be more precise, we can estimate it to be about a third of a mm, so we can say that the length of the key is 5.81 ± 0.03 cm. Another time you may need to estimate uncertainty is when you analyze video data. Figures B-2 and B-3 show a ball rolling off the edge of a table. These are two consecutive frames, separated in time by 1/30 of a second.
  • 2.
    APPENDIX B: ACCURACY,PRECISION AND UNCERTAINTY B - 2 Figure B-2 Figure B-3 The exact moment the ball left the table lies somewhere between these frames. We can estimate that this moment occurs midway between them ( st 60 1 10= ). Since it must occur at some point between them, the worst our estimate could be off by is s60 1 . We can therefore say the time the ball leaves the table is .10 60 1 60 1 st ±= How do I find the average deviation? If estimating the uncertainty is not good enough for your situation, you can experimentally determine the un-certainty by making several measure-ments and calculating the average deviation of those measurements. To find the average deviation: (1) Find the average of all your measurements; (2) Find the absolute value of the difference of each measurement from the average (its deviation); (3) Find the average of all the deviations by adding them up and dividing by the number of measurements. Of course you need to take enough measure-ments to get a distribution for which the average has some meaning. In example 1, a class of six students was asked to find the mass of the same penny using the same balance. In example 2, another class measured a different penny using six different balances. Their results are listed below: Class 1: Penny A massed by six different students on the same balance. Mass (grams) 3.110 3.125 3.120 3.126 3.122 3.120 3.121 average. The deviations are: 0.011g, 0.004g, 0.001g, 0.005g, 0.001g, 0.001g Sum of deviations: 0.023g Average deviation: (0.023g)/6 = 0.004g Mass of penny A: 3.121 ± 0.004g Class 2: Penny B massed by six different students on six different balances Mass (grams) 3.140 3.133 3.144 3.118 3.126 3.125 3.131 average The deviations are: 0.009g, 0.002g, 0.013g, 0.013g, 0.005g, 0.006g Sum of deviations: 0.048g Average deviation: (0.048g)/6= 0.008g Mass of penny B: 3.131 ± 0.008g However you choose to determine the uncertainty, you should always state your
  • 3.
    APPENDIX B: ACCURACY,PRECISION AND UNCERTAINTY B - 3 method clearly in your report. For the remainder of this appendix, we will use the results of these two examples. How do I know if two values are the same? If we compare only the average masses of the two pennies we see that they are different. But now include the uncertainty in the masses. For penny A, the most likely mass is somewhere between 3.117g and 3.125g. For penny B, the most likely mass is somewhere between 3.123g and 3.139g. If you compare the ranges of the masses for the two pennies, as shown in Figure B-4, they just overlap. Given the uncertainty in the masses, we are able to conclude that the masses of the two pennies could be the same. If the range of the masses did not overlap, then we ought to conclude that the masses are probably different. Figure B-4 Mass of pennies (in grams) with uncertainties Which result is more precise? Suppose you use a meter stick to measure the length of a table and the width of a hair, each with an uncertainty of 1 mm. Clearly you know more about the length of the table than the width of the hair. Your measurement of the table is very precise but your measurement of the width of the hair is rather crude. To express this sense of precision, you need to calculate the percentage uncertainty. To do this, divide the uncertainty in the measurement by the value of the measurement itself, and then multiply by 100%. For example, we can calculate the precision in the measurements made by class 1 and class 2 as follows: Precision of Class 1's value: (0.004 g ÷ 3.121 g) x 100% = 0.1 % Precision of Class 2's value: (0.008 g ÷ 3.131 g) x 100% = 0.3 % Class 1's results are more precise. This should not be surprising since class 2 introduced more uncertainty in their results by using six different balances instead of only one. Which result is more accurate? Accuracy is a measure of how your measured value compares with the real value. Imagine that class 2 made the measurement again using only one balance. Unfortunately, they chose a balance that was poorly calibrated. They analyzed their results and found the mass of penny B to be 3.556 ± 0.004 g. This number is more precise than their previous result since the uncertainty is smaller, but the new measured value of mass is very different from their previous value. We might conclude that this new value for the mass of penny B is different, since the range of the new value does not overlap the range of the previous value. However, that conclusion would be wrong since our uncertainty has not taken into account the inaccuracy of the balance. To determine the accuracy of the measurement, we should check by measuring something that is known. This procedure is called calibration, and it is absolutely necessary for making accurate measurements. Be cautious! It is possible to make measurements that are extremely precise and, at the same time, grossly inaccurate. How can I do calculations with values that have uncertainty? When you do calculations with values that have uncertainties, you will need to estimate (by calculation) the uncertainty in the result. There are mathematical techniques for doing this, which depend on the statistical properties of your measurements. A very simple way to estimate uncertainties is to find the largest possible uncertainty the calculation could yield. This will always overestimate the uncertainty of your calculation, but an overestimate is better than no estimate. The method for performing arithmetic operations on quantities with uncertainties is illustrated in the following examples:
  • 4.
    APPENDIX B: ACCURACY,PRECISION AND UNCERTAINTY B - 4 Addition: (3.131 ± 0.008 g) + (3.121 ± 0.004 g) = ? First, find the sum of the values: 3.131 g + 3.121 g = 6.252 g Next, find the largest possible value: 3.139 g + 3.125 g = 6.264 g The uncertainty is the difference between the two: 6.264 g – 6.252 g = 0.012 g Answer: 6.252 ± 0.012 g. Note: This uncertainty can be found by simply adding the individual uncertainties: 0.004 g + 0.008 g = 0.012 g Multiplication: (3.131 ± 0.013 g) x (6.1 ± 0.2 cm) = ? First, find the product of the values: 3.131 g x 6.1 cm = 19.1 g-cm Next, find the largest possible value: 3.144 g x 6.3 cm = 19.8 g-cm The uncertainty is the difference between the two: 19.8 g-cm - 19.1 g-cm = 0.7 g-cm Answer: 19.1 ± 0.7g-cm. Note: The percentage uncertainty in the answer is the sum of the individual percentage uncertainties: %100 1.19 7.0 %100 1.6 2.0 %100 131.3 013.0 ×=×+× Subtraction: (3.131 ± 0.008 g) – (3.121 ± 0.004 g) = ? First, find the difference of the values: 3.131 g - 3.121 g = 0.010 g Next, find the largest possible difference: 3.139 g – 3.117 g = 0.022 g The uncertainty is the difference between the two: 0.022 g – 0.010 g = 0.012 g Answer: 0.010±0.012 g. Note: This uncertainty can be found by simply adding the individual uncertainties: 0.004 g + 0.008 g = 0.012 g Notice also, that zero is included in this range, so it is possible that there is no difference in the masses of the pennies, as we saw before. Division: (3.131 ± 0.008 g) ÷ (3.121 ± 0.004 g) = ? First, divide the values: 3.131 g ÷ 3.121 g = 1.0032 Next, find the largest possible value: 3.139 g ÷ 3.117 g = 1.0071 The uncertainty is the difference between the two: 1.0071 - 1.0032 = 0.0039 Answer: 1.003 ± 0.004 Note: The percentage uncertainty in the answer is the sum of the individual percentage uncertainties: %100 0032.1 0039.0 %100 121.3 004.0 %100 131.3 008.0 ×=×+× Notice also, the largest possible value for the numerator and the smallest possible value for the denominator gives the largest result.
  • 5.
    APPENDIX B: ACCURACY,PRECISION AND UNCERTAINTY B - 5 The same ideas can be carried out with more complicated calculations. Remember this will always give you an overestimate of your uncertainty. There are other calculation techniques, which give better estimates for uncertainties. If you wish to use them, please discuss it with your instructor to see if they are appropriate. These techniques help you estimate the random uncertainty that always occurs in measurements. They will not help account for mistakes or poor measurement procedures. There is no substitute for taking data with the utmost of care. A little forethought about the possible sources of uncertainty can go a long way in ensuring precise and accurate data. PRACTICE EXERCISES: B-1. Consider the following results for different experiments. Determine if they agree with the accepted result listed to the right. Also calculate the precision for each result. a) g = 10.4 ± 1.1 m/s2 g = 9.8 m/s2 b) T = 1.5 ± 0.1 sec T = 1.1 sec c) k = 1368 ± 45 N/m k = 1300 ± 50 N/m Answers: a) Yes, 11%; b) No, 7%; c) Yes, 3.3% B-2. The area of a rectangular metal plate was found by measuring its length and its width. The length was found to be 5.37 ± 0.05 cm. The width was found to be 3.42 ± 0.02 cm. What is the area and the average deviation? Answer: 18.4 ± 0.3 cm2 B-3. Each member of your lab group weighs the cart and two mass sets twice. The following table shows this data. Calculate the total mass of the cart with each set of masses and for the two sets of masses combined. Cart (grams) Mass set 1 (grams) Mass set 2 (grams) 201.3 98.7 95.6 201.5 98.8 95.3 202.3 96.9 96.4 202.1 97.1 96.2 199.8 98.4 95.8 200.0 98.6 95.6 Answers: Cart and set 1: 299.3±1.6 g. Cart and set 2: 297.0±1.2 g. Cart and both sets: 395.1±1.9 g.
  • 6.