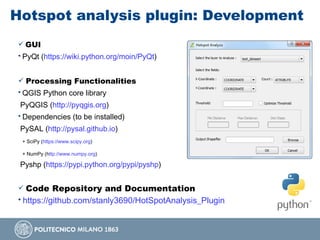
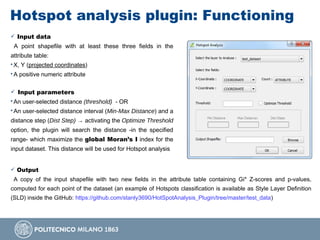
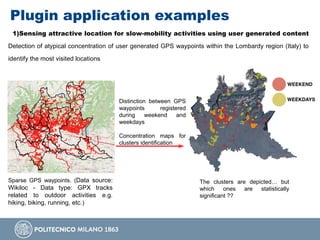
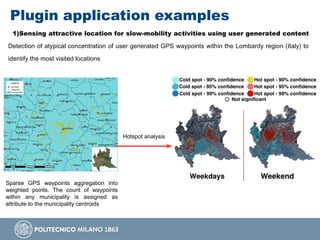
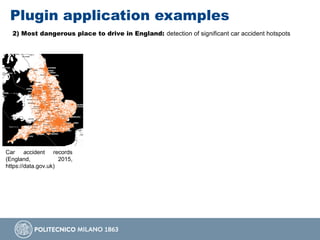
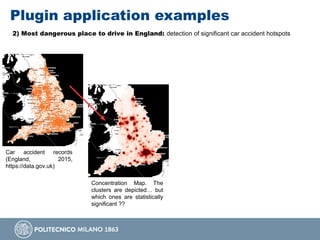
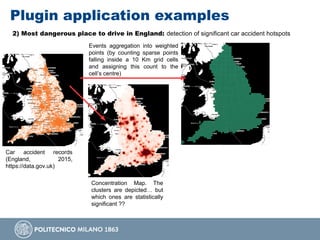
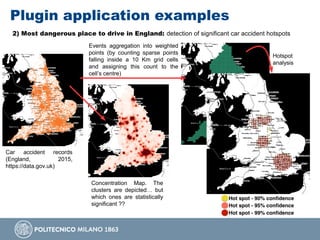
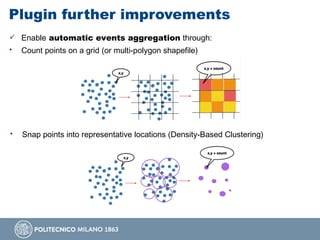
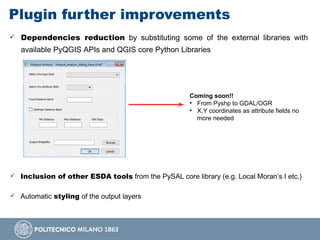
Hotspot analysis: a first prototype Python plugin
enabling exploratory spatial data analysis into
QGIS
Daniele Oxoli1, Mayra A. Zurbaran2, Stanly Shaji3, Arun K. Muthusamy3
1Dept. of Civil and Environmental Engineering, Politecnico di Milano, Como Campus, Italy
2Dept. of Systems Engineering, Universidad del Norte, Barranquilla, Colombia
3Politecnico di Milano, Dept. of Electronics, Information and Bioengineering, Milano, Italy
Perugia, 12-14 October
Introduction and Motivations
 Free and Open Source Software for Geospatial (FOSS4G) is becoming extremely popular
among a larger community of both users and developers
 In addition to the licensing advantages, this is surely due to the possibility of building and
customizing geospatial applications to meet practical requirements of any users
Nowadays, QGIS is recognized as one of the most flexible as well as fashionable FOSS GIS environment
 However, from the user’s perspective, proprietary GIS software is still representing the most suitable
solution to perform advanced or particular kinds of spatial data analysis, such as Exploratory Spatial
Data Analysis (ESDA).
 This work represents a step toward the inclusion of ESDA tools into QGIS, by exploiting available
Python libraries dedicated to spatial statistics and analysis (i.e. PySAL), with the aim of improving QGIS
mapping capabilities as well as providing powerful analysis tools to users with no advanced
programming skills - through a user-friendly QGIS Python plugin
ESDA at a glance
 ...Exploratory Spatial Data Analysis (ESDA) identifies a collection of techniques to describe
and visualize spatial distributions, highlight atypical locations or outliers, discover patterns
and suggest different spatial regimes and other forms of spatial instability (Anselin, 1999)
 Central to ESDA is the spatial autocorrelation and spatial heterogeneity in
which locational similarity (i.e. observations in spatial proximity) is matched by attribute
correlation. Therefore, ESDA requires that numerical and graphical procedures be
linked with a map
 ESDA relies on various software implementations: proprietary software toolboxes (ArcGIS),
stand-alone FOSS platforms (e.g. GeoDa, ESTAT) and programming libraries (e.g PySAL).
Formal and complete inclusion of ESDA capabilities into FOSS GIS platforms is not still
available
Hotspot analysis with ESDA tools
 One of the possible analysis enabled by ESDA tools is the Hotspot analysis. This is base on LISA statistics
(Local Indicators of Spatial Association) which evaluate the existence of clusters in the spatial arrangement of a
given variable x. Hotspot analysis aims to detect significant data clusters by means of Getis-Ord Gi* statistic
 Clusters result from concentrations of weighted points (i.e locations representing all the events within their
influence area or locations with a characteristic magnitude associated). Each cluster is formed by the j weighted
points within a distance d from the original weighted point i (with i included)
 Gi* is computed comparing local averages to global averages, using spatial weights wi,j (d)
 Z-scores of the GI* local statistic as well as p-values of the null-hypothesis (complete spatial randomness) are
computed for any point of the dataset in order to distinguish between Hotspots and Coldspots. Reference
values for Z-score and p-values are associated with the standard normal distribution
Hotspot analysis in the practice
Epidemiology
[e.g: Jones, K.E., Patel, N.G., Levy, M.A., Storeygard, A., Balk, D., Gittleman, J.L., & Daszak, P. (2008). Global
trends in emerging infectious diseases. Nature, 451(7181), 990-993.]
Criminology
[e.g: Chakravorty, S. (1995). Identifying crime clusters: The spatial principles. Middle States Geographer, 28, 53-58.]
Ecology
[e.g: Mahboubi, P., Parkes, M., Stephen, C., & Chan, H. M. (2015). Using expert informed GIS to locate
important marine social-ecological hotspots. Journal of environmental management, 160, 342-352.]
Transportation Management
[e.g: Cheng, W., & Washington, S. P. (2005). Experimental evaluation of hotspot identification methods. Accident
Analysis and Prevention, 37(5), 870-881.]
User Generated Content Analysis
[e.g: Brovelli, M. A., Oxoli, D., & Zurbarán, M. A. (2016). Sensing Slow Mobility and Interesting Locations for
Lombardy Region (italy): a Case Study Using Pointwise Geolocated Open Data. ISPRS-International Archives of the
Photogrammetry, Remote Sensing and Spatial Information Sciences, 603-607.]
...
Hotspot analysis plugin: Development
 GUI
• PyQt (https://wiki.python.org/moin/PyQt)
 Processing Functionalities
• QGIS Python core library
PyQGIS (http://pyqgis.org)
• Dependencies (to be installed)
PySAL (http://pysal.github.io)
+ SciPy (https://www.scipy.org)
+ NumPy (http://www.numpy.org)
Pyshp (https://pypi.python.org/pypi/pyshp)
 Code Repository and Documentation
• https://github.com/stanly3690/HotSpotAnalysis_Plugin
Hotspot analysis plugin: Functioning
 Input data
A point shapefile with at least these three fields in the
attribute table:
• X, Y (projected coordinates)
• A positive numeric attribute
 Input parameters
• An user-selected distance (threshold) - OR
• An user-selected distance interval (Min-Max Distance) and a
distance step (Dist Step) → activating the Optimize Threshold
option, the plugin will search the distance -in the specified
range- which maximize the global Moran’s I index for the
input dataset. This distance will be used for Hotspot analysis
 Output
A copy of the input shapefile with two new fields in the attribute table containing Gi* Z-scores and p-values,
computed for each point of the dataset (an example of Hotspots classification is available as Style Layer Definition
(SLD) inside the GitHub: https://github.com/stanly3690/HotSpotAnalysis_Plugin/tree/master/test_data)
Plugin application examples
1)Sensing attractive location for slow-mobility activities using user generated content
Detection of atypical concentration of user generated GPS waypoints within the Lombardy region (Italy) to
identify the most visited locations
Distinction between GPS
waypoints registered
during weekend and
weekdays
Concentration maps for
clusters identification
The clusters are depicted… but
which ones are statistically
significant ??
Sparse GPS waypoints. (Data source:
Wikiloc - Data type: GPX tracks
related to outdoor activities e.g.
hiking, biking, running, etc.)
Plugin application examples
1)Sensing attractive location for slow-mobility activities using user generated content
Detection of atypical concentration of user generated GPS waypoints within the Lombardy region (Italy) to
identify the most visited locations
Hotspot analysis
Sparse GPS waypoints aggregation into
weighted points. The count of waypoints
within any municipality is assigned as
attribute to the municipality centroids
Plugin application examples
2) Most dangerous place to drive in England: detection of significant car accident hotspots
Car accident records
(England, 2015,
https://data.gov.uk)
Plugin application examples
2) Most dangerous place to drive in England: detection of significant car accident hotspots
Car accident records
(England, 2015,
https://data.gov.uk)
Concentration Map. The
clusters are depicted… but
which ones are statistically
significant ??
Plugin application examples
2) Most dangerous place to drive in England: detection of significant car accident hotspots
Car accident records
(England, 2015,
https://data.gov.uk)
Concentration Map. The
clusters are depicted… but
which ones are statistically
significant ??
Events aggregation into weighted
points (by counting sparse points
falling inside a 10 Km grid cells
and assigning this count to the
cell’s centre)
Hotspot
analysis
Plugin further improvements
 Enable automatic events aggregation through:
• Count points on a grid (or multi-polygon shapefile)
• Snap points into representative locations (Density-Based Clustering)
Plugin further improvements
 Dependencies reduction by substituting some of the external libraries with
available PyQGIS APIs and QGIS core Python Libraries
Coming soon!!
●
From Pyshp to GDAL/OGR
●
X,Y coordinates as attribute fields no
more needed
 Inclusion of other ESDA tools from the PySAL core library (e.g. Local Moran’s I etc.)
 Automatic styling of the output layers
Conclusions
 Results from the Hotspot analysis reflect subjective choices of the analyst,
which is asked to interact with data in order to draft conclusions… ”all maps are
wrong but some are useful” – J. Keith Ord 2010
 Potential applications of the Hotspot analysis -or more in general of the
ESDA- are broad and helpful for manifold scientific fields
 The inclusion of PySAL into QGIS represents a meaningful objective in order
to strengthen the capabilities of this FOSS GIS and to boost its usage among a
wider and heterogeneous user community
Picture by Rossella Fidanza @altervista.org
…Questions?
Hotspot analysis QGIS plugin
• https://github.com/stanly3690/HotSpotAnalysis_Plugin

Presentation for OGRS 2016 at Peruggia, Italy

  • 1.
    Hotspot analysis: afirst prototype Python plugin enabling exploratory spatial data analysis into QGIS Daniele Oxoli1, Mayra A. Zurbaran2, Stanly Shaji3, Arun K. Muthusamy3 1Dept. of Civil and Environmental Engineering, Politecnico di Milano, Como Campus, Italy 2Dept. of Systems Engineering, Universidad del Norte, Barranquilla, Colombia 3Politecnico di Milano, Dept. of Electronics, Information and Bioengineering, Milano, Italy Perugia, 12-14 October
  • 2.
    Introduction and Motivations Free and Open Source Software for Geospatial (FOSS4G) is becoming extremely popular among a larger community of both users and developers  In addition to the licensing advantages, this is surely due to the possibility of building and customizing geospatial applications to meet practical requirements of any users Nowadays, QGIS is recognized as one of the most flexible as well as fashionable FOSS GIS environment  However, from the user’s perspective, proprietary GIS software is still representing the most suitable solution to perform advanced or particular kinds of spatial data analysis, such as Exploratory Spatial Data Analysis (ESDA).  This work represents a step toward the inclusion of ESDA tools into QGIS, by exploiting available Python libraries dedicated to spatial statistics and analysis (i.e. PySAL), with the aim of improving QGIS mapping capabilities as well as providing powerful analysis tools to users with no advanced programming skills - through a user-friendly QGIS Python plugin
  • 3.
    ESDA at aglance  ...Exploratory Spatial Data Analysis (ESDA) identifies a collection of techniques to describe and visualize spatial distributions, highlight atypical locations or outliers, discover patterns and suggest different spatial regimes and other forms of spatial instability (Anselin, 1999)  Central to ESDA is the spatial autocorrelation and spatial heterogeneity in which locational similarity (i.e. observations in spatial proximity) is matched by attribute correlation. Therefore, ESDA requires that numerical and graphical procedures be linked with a map  ESDA relies on various software implementations: proprietary software toolboxes (ArcGIS), stand-alone FOSS platforms (e.g. GeoDa, ESTAT) and programming libraries (e.g PySAL). Formal and complete inclusion of ESDA capabilities into FOSS GIS platforms is not still available
  • 4.
    Hotspot analysis withESDA tools  One of the possible analysis enabled by ESDA tools is the Hotspot analysis. This is base on LISA statistics (Local Indicators of Spatial Association) which evaluate the existence of clusters in the spatial arrangement of a given variable x. Hotspot analysis aims to detect significant data clusters by means of Getis-Ord Gi* statistic  Clusters result from concentrations of weighted points (i.e locations representing all the events within their influence area or locations with a characteristic magnitude associated). Each cluster is formed by the j weighted points within a distance d from the original weighted point i (with i included)  Gi* is computed comparing local averages to global averages, using spatial weights wi,j (d)  Z-scores of the GI* local statistic as well as p-values of the null-hypothesis (complete spatial randomness) are computed for any point of the dataset in order to distinguish between Hotspots and Coldspots. Reference values for Z-score and p-values are associated with the standard normal distribution
  • 5.
    Hotspot analysis inthe practice Epidemiology [e.g: Jones, K.E., Patel, N.G., Levy, M.A., Storeygard, A., Balk, D., Gittleman, J.L., & Daszak, P. (2008). Global trends in emerging infectious diseases. Nature, 451(7181), 990-993.] Criminology [e.g: Chakravorty, S. (1995). Identifying crime clusters: The spatial principles. Middle States Geographer, 28, 53-58.] Ecology [e.g: Mahboubi, P., Parkes, M., Stephen, C., & Chan, H. M. (2015). Using expert informed GIS to locate important marine social-ecological hotspots. Journal of environmental management, 160, 342-352.] Transportation Management [e.g: Cheng, W., & Washington, S. P. (2005). Experimental evaluation of hotspot identification methods. Accident Analysis and Prevention, 37(5), 870-881.] User Generated Content Analysis [e.g: Brovelli, M. A., Oxoli, D., & Zurbarán, M. A. (2016). Sensing Slow Mobility and Interesting Locations for Lombardy Region (italy): a Case Study Using Pointwise Geolocated Open Data. ISPRS-International Archives of the Photogrammetry, Remote Sensing and Spatial Information Sciences, 603-607.] ...
  • 6.
    Hotspot analysis plugin:Development  GUI • PyQt (https://wiki.python.org/moin/PyQt)  Processing Functionalities • QGIS Python core library PyQGIS (http://pyqgis.org) • Dependencies (to be installed) PySAL (http://pysal.github.io) + SciPy (https://www.scipy.org) + NumPy (http://www.numpy.org) Pyshp (https://pypi.python.org/pypi/pyshp)  Code Repository and Documentation • https://github.com/stanly3690/HotSpotAnalysis_Plugin
  • 7.
    Hotspot analysis plugin:Functioning  Input data A point shapefile with at least these three fields in the attribute table: • X, Y (projected coordinates) • A positive numeric attribute  Input parameters • An user-selected distance (threshold) - OR • An user-selected distance interval (Min-Max Distance) and a distance step (Dist Step) → activating the Optimize Threshold option, the plugin will search the distance -in the specified range- which maximize the global Moran’s I index for the input dataset. This distance will be used for Hotspot analysis  Output A copy of the input shapefile with two new fields in the attribute table containing Gi* Z-scores and p-values, computed for each point of the dataset (an example of Hotspots classification is available as Style Layer Definition (SLD) inside the GitHub: https://github.com/stanly3690/HotSpotAnalysis_Plugin/tree/master/test_data)
  • 8.
    Plugin application examples 1)Sensingattractive location for slow-mobility activities using user generated content Detection of atypical concentration of user generated GPS waypoints within the Lombardy region (Italy) to identify the most visited locations Distinction between GPS waypoints registered during weekend and weekdays Concentration maps for clusters identification The clusters are depicted… but which ones are statistically significant ?? Sparse GPS waypoints. (Data source: Wikiloc - Data type: GPX tracks related to outdoor activities e.g. hiking, biking, running, etc.)
  • 9.
    Plugin application examples 1)Sensingattractive location for slow-mobility activities using user generated content Detection of atypical concentration of user generated GPS waypoints within the Lombardy region (Italy) to identify the most visited locations Hotspot analysis Sparse GPS waypoints aggregation into weighted points. The count of waypoints within any municipality is assigned as attribute to the municipality centroids
  • 10.
    Plugin application examples 2)Most dangerous place to drive in England: detection of significant car accident hotspots Car accident records (England, 2015, https://data.gov.uk)
  • 11.
    Plugin application examples 2)Most dangerous place to drive in England: detection of significant car accident hotspots Car accident records (England, 2015, https://data.gov.uk) Concentration Map. The clusters are depicted… but which ones are statistically significant ??
  • 12.
    Plugin application examples 2)Most dangerous place to drive in England: detection of significant car accident hotspots Car accident records (England, 2015, https://data.gov.uk) Concentration Map. The clusters are depicted… but which ones are statistically significant ?? Events aggregation into weighted points (by counting sparse points falling inside a 10 Km grid cells and assigning this count to the cell’s centre)
  • 13.
    Plugin application examples 2)Most dangerous place to drive in England: detection of significant car accident hotspots Car accident records (England, 2015, https://data.gov.uk) Concentration Map. The clusters are depicted… but which ones are statistically significant ?? Events aggregation into weighted points (by counting sparse points falling inside a 10 Km grid cells and assigning this count to the cell’s centre) Hotspot analysis
  • 14.
    Plugin further improvements Enable automatic events aggregation through: • Count points on a grid (or multi-polygon shapefile) • Snap points into representative locations (Density-Based Clustering)
  • 15.
    Plugin further improvements Dependencies reduction by substituting some of the external libraries with available PyQGIS APIs and QGIS core Python Libraries Coming soon!! ● From Pyshp to GDAL/OGR ● X,Y coordinates as attribute fields no more needed  Inclusion of other ESDA tools from the PySAL core library (e.g. Local Moran’s I etc.)  Automatic styling of the output layers
  • 16.
    Conclusions  Results fromthe Hotspot analysis reflect subjective choices of the analyst, which is asked to interact with data in order to draft conclusions… ”all maps are wrong but some are useful” – J. Keith Ord 2010  Potential applications of the Hotspot analysis -or more in general of the ESDA- are broad and helpful for manifold scientific fields  The inclusion of PySAL into QGIS represents a meaningful objective in order to strengthen the capabilities of this FOSS GIS and to boost its usage among a wider and heterogeneous user community
  • 17.
    Picture by RossellaFidanza @altervista.org …Questions? Hotspot analysis QGIS plugin • https://github.com/stanly3690/HotSpotAnalysis_Plugin