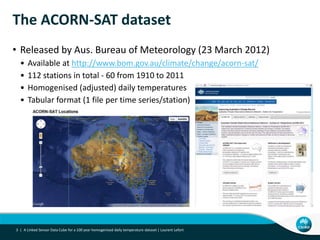
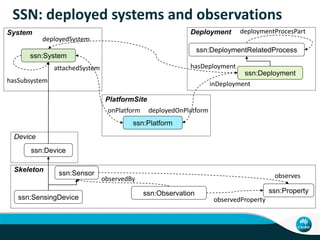
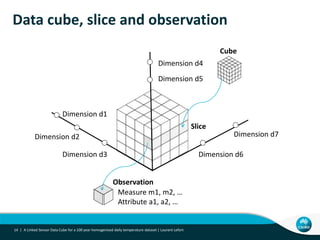
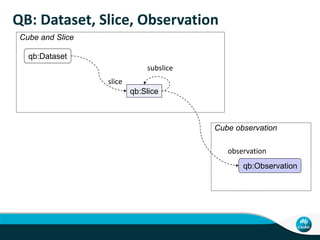
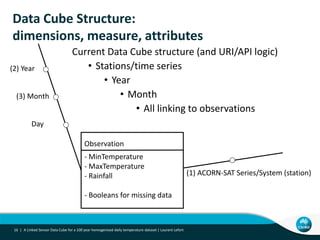
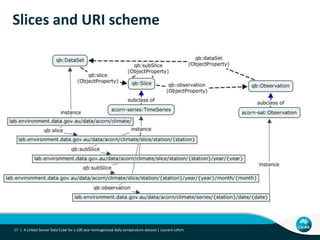
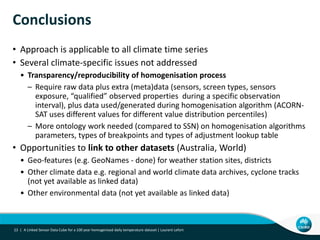
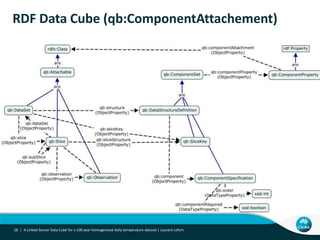
This document describes linking the ACORN-SAT climate dataset as linked open data using the Semantic Sensor Network (SSN) ontology and RDF Data Cube vocabulary. It presents the ACORN-SAT dataset, motivation for publishing it as linked data, and details how SSN is used to describe sensor deployments and observations while RDF Data Cube structures the data into observations, dimensions and measures. Lessons learned include opportunities to improve vocabularies and link additional climate and environmental datasets.
Using the Data Cube vocabulary for Publishing Environmental Linked Data on la...Laurent Lefort
Canberra Semantic Web Meetup.
Initiatives have been launched to develop semantic vocabularies representing statistical classifications and discovery metadata. Tools are also being created by statistical organizations to support the publication of dimensional data conforming to the Data Cube specification, now in Last Call at W3C.
The meeting will be an opportunity to hear about two semantic Web and Linked Data initiatives for statistical data that are driven by the Australian Government. The Bureau of Meteorlogy and CSIRO have recently released a Linked Data version of the ACORN-SAT historical climate data at http://lab.environment.data.gov.au and the ABS has released the Census data modelled in the Data Cube vocabulary which is part of a challenge the ABS is organising in context of the SemStats Workshop (http://www.datalift.org/en/event/semstats2013/challenge) at the International Semantic Web Conference (ISWC) in Sydney (http://iswc2013.semanticweb.org).
Come along to hear about these two projects, the challenges encountered and the solutions developed.
This document summarizes a presentation about representing statistical data in RDF. It discusses existing statistical datasets published in RDF format, including datasets from Eurostat, the US Census, and various government sources. It also covers vocabularies for modeling the structure and domain semantics of statistical data, such as SCOVO, Data Cube, and SDMX/RDF. The presentation addresses challenges in converting legacy statistical formats to RDF and techniques for linking and publishing statistical Linked Data on the web.
The document discusses the Finnish Meteorological Institute's (FMI) approach to providing weather data in an INSPIRE compliant format. It describes how FMI opened all of its data in 2013 through a single data portal that serves as both an open data and INSPIRE portal. It then covers the various data models used to structure different types of weather data, including observations, forecasts, and radar images. Finally, it discusses experiences with implementing the different models and serving the wide range of weather data sets.
The Finnish Meteorological Institute opened its meteorological data in 2013, providing freely accessible machine-readable data through its open data portal. This includes weather observations, forecasts, radar images, and more. While the amount of data held by FMI is substantial, reaching over 1 terabyte for observations alone, it follows common standards to make the data broadly usable. The open data project has helped FMI improve its services and data sharing while generating interest from both commercial and independent users.
The document discusses the open meteorological data provided by the Finnish Meteorological Institute (FMI). FMI opened its data in 2013, making basically all of its data freely available in machine-readable formats. The data portal follows INSPIRE requirements and provides metadata, data, models, and services. Various types of observational and forecast data are available, including weather, marine, and radar data as well as lightning strikes and model outputs.
FMI Open Data Interface and Data ModelsRoope Tervo
Description of FMI Open Data Portal services and data models including some WFS basics. The presentation includes also a description of INSPIRE harmonised data models used in the portal.
The Earth System Grid Federation (ESGF) is a large international collaboration that operates a global infrastructure for management and access of Earth System data. Some of the most valuable data collections served by ESGF include the output of global climate models used for the IPCC reports on climate change (CMIP3, CMIP5 and the upcoming CMIP6), regional climate model output (CORDEX), and observational data from several American and European agencies (Obs4MIPs). This talk will present a brief introduction to ESGF, describe the data access and analysis methods currently available or planned for the future, and conclude with some ideas on how this infrastructure could be used as a testbed for executing distributed analytics on a global scale.
TU1.L10 - Globwave and applications of global satellite wave observationsgrssieee
The GlobWave project aims to improve the use of satellite-derived wind and wave data. It develops a web portal providing access to multi-sensor satellite wave data in a common format, demonstration products, and tools for comparing satellite and model wave data. The project is led by Logica and involves partners ESA, CNES, Ifremer, SatOC, CLS, and NOC.
5 IGARSS_Riishojgaard July 25 2011_rev2.pptgrssieee
The document discusses the Joint Center for Satellite Data Assimilation's (JCSDA) work related to the upcoming launch of the National Polar-orbiting Partnership (NPP) satellite. The JCSDA is preparing operational weather prediction services to assimilate data from NPP by improving radiative transfer models, developing emissivity databases, and conducting observing system simulation experiments. After launch, the JCSDA will monitor NPP data and work to incorporate it into operational weather forecasting systems to improve predictions and generate tens of billions of dollars in economic benefits annually.
Accelerating Science with Cloud Technologies in the ABoVE Science CloudGlobus
This document summarizes the use of the ABoVE Science Cloud (ASC) to support research for the Arctic-Boreal Vulnerability Experiment (ABoVE). The ASC provides researchers with large datasets, computing resources, and tools to process and analyze remote sensing and model data related to Alaska and northern Canada. Several examples are given of projects using the ASC, including analyzing satellite imagery to map forest structure, tracking surface water changes over time, characterizing fire history, and modeling future forest composition under climate change. The ASC aims to facilitate collaboration by allowing scientists to access common datasets and run computationally-intensive processes in the cloud without having to directly transfer large amounts of data.
The Finnish Meteorological Institute (FMI) opened its data in 2013, making everything it has property rights to freely available in machine-readable formats. FMI's open data portal follows INSPIRE requirements and works as both an open data and INSPIRE portal. FMI provides data using various INSPIRE data models like MultiPointCoverage, MeasurementTimeSeries, and simple features. Common data types include observations, point forecasts, radar images, and gridded forecasts in formats like Grib and NetCDF.
The Finnish Meteorological Institute opened its meteorological data in 2013, making everything it owns available in open, machine-readable formats through a single data portal. The portal follows INSPIRE requirements and provides metadata, data, models and services. A variety of weather and climate datasets are available, including observations, forecasts, radar images and more. Standards like OGC and INSPIRE are used to ensure interoperability.
Finnish Meteorological Institute is opening its weather data. Slides kept in Aaltoes Insights event describes first insights about open data portal and what is going to be opened.
AusCover Earth Observation Services and Data CubesTERN Australia
The presentation provides an overview of earth observation services offered by AusCover Facility of TERN. The presentation was part of the Workshop on Approaches to Terrestrial Ecosystem Data Management : from collection to synthesis and beyond which was held on 9th of March 2016 in University of Queensland.
Ian Grant_Adoption of AusCover data standards and systems to improve access t...TERN Australia
This document discusses the adoption of AusCover data standards and systems by the Bureau of Meteorology to improve access to national climate data. Specifically, it summarizes how the Bureau has adopted AusCover's use of netCDF format and metadata standards to deliver daily meteorological grid data and established an ongoing process to convert historical data and updates to this format. This benefits climate modeling by streamlining data delivery and bringing standardized metadata to Bureau products.
NOAA is transitioning SAR-derived sea surface wind products to operational status to provide high-resolution coastal wind data to users. The system ingests SAR data from various satellites, retrieves winds using geophysical models, and distributes products through CoastWatch. Validation shows accuracy of 1-2.5 m/s compared to buoy winds. Operational implementation began in 2009 and will be complete in 2012 to handle future SAR missions like Sentinel-1 and provide coastal wind information to users.
Eco-informatics: Data services for bringing together and publishing the full ...TERN Australia
The presentation provides an overview of Advanced Ecological Knowledge and Observation System and SHaRED services by the TERN Eco-informatics to publish plot-based ecological data. The presentation was part of the Workshop on Approaches to Terrestrial Ecosystem Data Management : from collection to synthesis and beyond which was held on 9th of March 2016 in University of Queensland.
AusPlots field data collection with AusScribeTERN Australia
AusPlots collects standardized ecological data from permanent plots across Australian rangelands to facilitate long-term monitoring and decision making. Field data is collected using a custom mobile app, AuScribe, which follows a rigorous protocol. This generates clean integrated data that is easily curated and published through various platforms. The iterative development of AuScribe and a component-based architecture allowed for fast results handling the complex data needs while mobile. The standardized long-term data made available through AusPlots informs ecological research and management.
ExtremeEarth Open Workshop - Overview and AchievementsExtremeEarth
This document summarizes the objectives and achievements of the ExtremeEarth project, which developed artificial intelligence and big data techniques to analyze large volumes of Copernicus Earth observation data. The project created scalable deep learning models and large training datasets for food security and polar use cases. It also developed linked geospatial data systems that can handle petabyte-scale Copernicus data. The techniques were integrated into the Hopsworks platform and deployed on CREODIAS to enable extreme Earth analytics.
FR1.L09.2 - ONBOARD RADAR PROCESSING CONCEPTS FOR THE DESDYNI MISSIONgrssieee
The document discusses onboard radar processing concepts for the DESDynI Earth observation mission. It describes how onboard processing can enable more frequent observations than currently feasible by reducing the volume of downlinked data through techniques like SAR image formation and compression. Onboard processing could generate targeted science products to enable rapid response to natural hazards. Examples of potential onboard products discussed include forest fire extent, forest fuel load, earthquake damage assessment, glacier melting, and vegetation classification.
Application packaging and systematic processing in earth observation exploita...terradue
An overview of Terradue's solutions supporting Earth Observations (EO) Exploitation Platforms across multiple domains.
Presentation done as part of the Open Geospatial Consortium (OGC) Technical Committee ad-hoc meeting for the setup of a new domain working group on EO Exploitation Platforms.
WE1.L10 - IMPLEMENTATION OF THE LAND, ATMOSPHERE NEAR-REAL-TIME CAPABILITY FO...grssieee
The LANCE system provides near real-time satellite data from NASA instruments within 3 hours of observation for applications such as weather forecasting, monitoring natural hazards, and agricultural monitoring. It leverages existing EOS processing and distribution capabilities. Products include MODIS imagery, AIRS temperature and moisture profiles, and OMI measurements of ozone and sulfur dioxide. The system aims to improve latency and provide a one-stop shop for users through the LANCE web portal.
Polar Use Case - ExtremeEarth Open WorkshopExtremeEarth
This document provides an overview of an ExtremeEarth project that aims to apply deep learning techniques to classify sea ice in polar regions using satellite imagery. The project has received funding from the European Union. It discusses challenges in classifying sea ice from SAR imagery compared to optical imagery. It outlines user requirements for sea ice products, including high resolution (300m or better) and frequent updates (near real-time). The document describes workflows using the Polar Thematic Exploitation Platform (Polar TEP) for large-scale sea ice mapping using Copernicus satellite data and machine learning algorithms. It also discusses exploitation of results, including the impact of Polar TEP and efforts to facilitate the polar machine learning community.
AstroInformatics 2015: Large Sky Surveys: Entering the Era of Software-Bound ...Mario Juric
The document discusses large sky surveys and how they are transforming astronomy into a software-driven field. It focuses on the Large Synoptic Survey Telescope (LSST) project, which will be the largest sky survey to date. Some key points:
- LSST will image the entire visible sky every few nights for 10 years, collecting enormous amounts of data on billions of objects.
- Processing and analyzing this data poses major computational challenges and requires new techniques for extracting science from massive catalogs and datasets.
- LSST aims to deliver real-time alerts of changing/transient objects, yearly source catalogs with positions/measurements of billions of objects, and deep co-added images.
- The data
The document summarizes the development of satellite modeling for the National Solar Radiation Database (NSRDB) to provide accurate surface solar radiation data. It describes the evolution from empirical to physical models using satellite measurements and ancillary data as inputs to radiative transfer models. Validation shows the new 2005-2012 dataset has a mean bias error of less than 5% for GHI and DNI compared to surface measurements, though uncertainty remains for cloudy cases. Future work aims to improve the model with higher resolution data and better representation of aerosols and surfaces.
2004-09-12 Data and Tools for Web-Based Monitoring and AnalysisRudolf Husar
The document discusses the DataFed infrastructure, which integrates distributed fire-related and air quality data sources to provide new insights. It provides access to dozens of aerosol, emissions, fire, meteorology, and GIS datasets. DataFed uses web services and a service-oriented architecture to facilitate data sharing and allow users to perform customized analyses across different datasets.
The document summarizes the past 10 years of studying volcanoes using InSAR techniques from spaceborne radar systems and looks ahead to future developments. Key points include: 1) InSAR has advanced from initial imaging to reliable time series analyses of deformation; 2) New radar systems provide higher resolution data at different frequencies but coverage remains limited; and 3) Future missions like DESDynI-R are designed for volcanology but funding and policies remain challenges to fully utilizing the technique.
1. Mashups are collections of small applications called widgets that can be embedded into web pages using standards like XML, HTML, JavaScript and CSS.
2. Major companies develop their own widget platforms with tools to create and deploy widgets, such as Google Gadgets, Yahoo Widgets and Amazon Widgets.
3. Widgets are described in XML files but require a widget engine for execution, making their implementation dependent on the hosting platform. Standardization efforts are ongoing but adoption by providers is uncertain.
Semantic pipes aggregate data from multiple sources to create new data sources, similar to Yahoo! Pipes. Semantic pipes operate on RDF data sources using SPARQL queries. DERI Pipes is a tool for building semantic pipes that defines blocks for processing RDF and other data sources. Semantic mashups may have additional reasoning capabilities beyond basic data aggregation, using semantic web reasoners. They implement behavior through SPARQL queries over RDF data. Examples include mashups over Flickr, book data, and scholarly references.
A Graph-Based Approach to Learn Semantic Descriptions of Data SourcesMohsen Taheriyan
The document presents a new graph-based approach to learn semantic descriptions of data sources. It constructs a graph from existing source models in a domain, and leverages the relationships in this graph to generate candidate semantic models for a new source, by mapping its semantic types to the graph and computing minimal subgraphs. This allows the approach to exploit common patterns across source models for automating the learning of semantic descriptions.
An intelligent mashup uses artificial intelligence techniques like rule-based reasoning to combine web services and applications. This allows implementing functionality like delivering similar news to a user who reads about swine flu. Rule-based mashups can be done client-side in the browser using event-condition-action rules to derive knowledge from user activity. Benefits include easy modeling of relationships, intelligent user interfaces, and reduced network traffic through local reasoning, while drawbacks include needing skilled developers for server-side options and consuming client resources.
The document discusses building intelligent mashups using artificial intelligence techniques. It proposes using JSON-based rules that can be run in a browser-based rules engine to combine data from different web sources and applications. This would allow non-programmers to more easily create intelligent mashups by specifying event-condition-action rules without advanced coding skills. Open challenges discussed include a lack of widget standards and potential security and performance issues.
Learning the Semantics of Structured Data SourcesMohsen Taheriyan
Information sources such as relational databases, spreadsheets, XML, JSON, and Web APIs contain a tremendous amount of structured data that can be leveraged to build and augment knowledge graphs. However, they rarely provide a semantic model to describe their contents. Semantic models of data sources represent the implicit meaning of the data by specifying the concepts and the relationships within the data. Such models are the key ingredients to automatically publish the data into knowledge graphs. Manually modeling the semantics of data sources requires significant effort and expertise, and although desirable, building these models automatically is a challenging problem. Most of the related work focuses on semantic annotation of the data fields (source attributes). However, constructing a semantic model that explicitly describes the relationships between the attributes in addition to their semantic types is critical.
We present a novel approach that exploits the knowledge from a domain ontology and the semantic models of previously modeled sources to automatically learn a rich semantic model for a new source. This model represents the semantics of the new source in terms of the concepts and relationships defined by the domain ontology. Given some sample data from the new source, we leverage the knowledge in the domain ontology and the known semantic models to construct a weighted graph that represents the space of plausible semantic models for the new source. Then, we compute the top k candidate semantic models and suggest to the user a ranked list of the semantic models for the new source. The approach takes into account user corrections to learn more accurate semantic models on future data sources. Our evaluation shows that our method generates expressive semantic models for data sources and services with minimal user input. These precise models make it possible to automatically integrate the data across sources and provide rich support for source discovery and service composition. They also make it possible to automatically publish semantic data into knowledge graphs.
Weather Station Data Publication at Irstea: an implementation Report. catherine roussey
This document discusses Irstea's publication of weather station data as linked open data using semantic web standards. It provides an overview of open data and linked open data principles. It then describes Irstea's weather station in Montoldre, France, the sensors that collect data, and the observations made. It details how the data was modeled using the Semantic Sensor Network (SSN) ontology and other related ontologies. Finally, it discusses converting the data from CSV files to RDF and making it available via a SPARQL endpoint.
The document discusses EDF's use of a data lake and data lab to optimize operations and safety at their nuclear power plants. It describes how EDF is building a Hadoop-based data lake called ESPADON to store sensor and operational data from their 59 nuclear plants. They are developing data science algorithms to analyze the data from the whole fleet to improve maintenance and operations. EDF is also creating a data lab team and architecture to develop analytics and quantify the value of these initiatives.
The document summarizes a webinar about the Open Geospatial Consortium's (OGC) Climatology-Hydrology Information Sharing Pilot, Phase 1 (CHISP-1) project. The webinar included an introduction to OGC, an overview of the CHISP-1 project objectives of creating a virtual observatory for surface and subsurface water resources, and a live demonstration of the technical architecture. The technical architecture allowed for monitoring of stream and groundwater levels, subscriptions to alerts about flood events, and calculations of nutrient loads into lakes from tributaries.
This document summarizes a new cloud-based platform for analyzing large satellite Earth observation (EO) data. Key points:
- Traditional desktop tools cannot handle the growing size of EO data, requiring a shift to cloud-native analytics using big data tools.
- The demonstrated platform brings algorithms to distributed data using open-source tools like Kubernetes, Docker, and Jupyter notebooks running on Google Cloud.
- It provides scalable infrastructure for processing and analyzing petabytes of EO data through pipelines, supports open data standards, and ensures data sovereignty with Canadian storage.
The EPOS Thematic Core Service (TCS) GNSS Data and Products focuses on developing an open source platform to store and disseminate data and metadata from GNSS stations operating in Europe. It provides access to an integrated European network of data providers through an e-infrastructure (with web interface) to disseminate the continuous GNSS data from existing Research Infrastructures.
ESCAPE Kick-off meeting - KM3Net, Opening a new window on our universe (Feb 2...ESCAPE EU
KM3NeT is a neutrino research infrastructure located in the deep Mediterranean Sea consisting of two detectors, ORCA and ARCA. The document discusses KM3NeT's physics motivations in studying neutrino oscillations, supernovae, dark matter, and cosmic neutrinos. It describes the detector design using optical sensors on vertical strings to detect Cherenkov radiation from neutrinos. A phased construction approach is outlined. The large data volumes require advanced data management, including processing, storage, and open access policies following FAIR principles. Participation in ESCAPE could help address KM3NeT's computing and data challenges for its lifetime scale.
The document summarizes a system for integrating crop data and meteorological data using a standardized data exchange framework. The system uses a metadata database and broker service called MetBroker to provide consistent access to heterogeneous weather databases. Crop data from different sources can be uploaded and integrated into a central database. The system then allows users to query the integrated crop and weather data and analyze relationships to support applications like crop modeling.
Solar irradiance data sources & softwareakhtar ali
This document provides an overview of various solar irradiance data sources and analysis software that can be used for renewable energy projects and solar PV system design. It lists numerous global data sources like NASA SSE, Focus Solar, HelioClim-1, NCEP/NCAR, and others that provide satellite-derived solar radiation data at different resolutions. It also summarizes several solar PV software tools from around the world used for modeling and optimizing photovoltaic systems, such as PVsyst, Homer, PV Designer Solmetric, PV F-Chart, and others.
Kickstart your Kafka with Faker Data | Francesco Tisiot, Aiven.ioHostedbyConfluent
We all love to play with the shiny toys, but an event stream with no events is a sorry sight. In this session you’ll see how to create your own streaming dataset for Apache Kafka using Python and the Faker library. You’ll learn how to create a random data producer and define the structure and rate of its message delivery. Randomly-generated data is often hilarious in its own right, and it adds just the right amount of fun to any Kafka and its integrations!
The document describes the Porto Living Lab project in Porto, Portugal which involves three sensing infrastructures: BusNet, HarbourNet, and UrbanSense. UrbanSense is an environmental sensor platform that collects data from over 500 sensors across the city to understand phenomena and their impacts. It involves sensor units that collect data and send it via various wireless networks to a cloud database. The sensors measure air quality, noise, weather and other environmental factors.
The document discusses AusCover, which provides remote sensing datasets and products for the Terrestrial Ecosystem Research Network (TERN). It outlines AusCover's strategic vision to provide a nationally consistent, long-term time series of satellite images and biophysical map products. It describes AusCover's approach to distributed data storage, metadata standards, and tools for data discovery, visualization, subsetting and access. Key goals are to make data discoverable and accessible via open standards and multiple access pathways.
Enabling efficient movement of data into & out of a high-performance analysis...Jisc
From Jisc's campus network engineering for data-intensive science workshop on 19 October 2016.
https://www.jisc.ac.uk/events/campus-network-engineering-for-data-intensive-science-workshop-19-oct-2016
The document provides an overview of the Geo Analytics Canada demonstration platform. It describes how the platform addresses the challenge of analyzing large satellite datasets using traditional desktop tools by bringing algorithms to scalable cloud data and computing resources. Key features highlighted include on-demand compute and storage, tools for querying, discovering and analyzing satellite data, pre-processing pipelines, and personal analytic environments for interactive exploration and scaling of analyses. The platform aims to enable big data analytics of satellite datasets through open-source technologies and partnerships between IT and Earth observation experts.
The ACCESS-Optimization Project is a 3-year effort between NCI, BoM and Fujitsu to optimize and scale up climate and earth system models run on NCI infrastructure. The project aims to address performance and scalability issues, assist with future HPC procurements, and contribute to model development with a focus on performance. Current work involves profiling applications, constructing and testing higher resolution configurations, and reporting on workflow and scalability issues for future weather and climate applications. Methodologies used include tools for performance analysis and scaling tests. Areas of work include high resolution models of the ocean, atmosphere and coupled climate system, as well as data assimilation procedures. Deliverables to date include porting the ocean model to the new
As global warming intensifies, learning how to adapt to climate changes and consequent extreme weather events is gaining urgency. More accurate weather models and intelligent warning systems enable the improvement of the resilience of the local areas and production activities. One way of achieving this is through obtaining more accurate short term weather forecasts tailored for specific applications by analyzing large amounts of publicly available data such as localized meteorological measurements obtained from IoT sensors, open-source forecasts and even Earth observation data. In this talk we will show how we apply machine learning algorithms to efficiently improve and transform weather forecasts obtained from meteorological services and implement them in various decision-making use-cases such as precision agriculture, heating and cooling in buildings, urban infrastructure optimization (water distribution, urban lighting, traffic), logistics optimization and many more.
Contextualizing the Visualization of Climate DataRaquel Alegre
EGU 2014, 27th April - 2nd May 2014, Vienna (Austria)
Session: Techniques and tools for effective visualization and sonification in the geosciences
Category: Earth & Space Science Informatics (ESSI)
This slide will provide an overview of current functionality, techniques, and tips for visualization and query of HDF and netCDF data in ArcGIS, as well as future plans. Hierarchical Data Format (HDF) and netCDF (network Common Data Form) are two widely used data formats for storing and manipulating scientific data. The NetCDF format also supports temporal data by using multidimensional arrays. The basic structure of data in this format and how to work with it will be covered in the context of standardized data structures and conventions. This slide will demonstrate the tools and techniques for ingesting HDF and netCDF data efficiently in ArcGIS, as well as some common workflows to employ the visualization capabilities of ArcGIS for effective animation and analysis of your data.
Semantically-Enabling the Web of Things: The W3C Semantic Sensor Network Onto...Laurent Lefort
Presentation of the SSN XG results at eResearch Australia 2011 https://eresearchau.files.wordpress.com/2012/06/74-semantically-enabling-the-web-of-things-the-w3c-semantic-sensor-network-ontology.pdf
Future manufacturing informatics - typology of manufacturing dataLaurent Lefort
The document discusses developing a roadmap for manufacturing and processing informatics in Australia. It would survey the current situation and international trends to help Australian industry develop use of digital technologies and maintain competitiveness. The roadmap would propose future directions for CSIRO's efforts in manufacturing informatics. It also discusses different types of manufacturing data and the importance of data for different industry types.
Design and generation of Linked Clinical Data Cube (Semantic Stats 2013)Laurent Lefort
This document discusses generating linked clinical data cubes from the Australian Imaging Biomarkers and Lifestyle study. Originally the data was collected and stored in CDISC ODM format, which is difficult for researchers to explore. The authors propose converting the data to RDF data cubes and nested data cubes using the RDF Data Cube and DDI-RDF vocabularies to allow for flexible slicing and analysis of the data. This addresses challenges around the complex study structure and sensitive patient data. Remaining issues include handling missing data and implementing access controls when querying multiple linked data cubes.
This document summarizes various hacks and mashups created at GovHack Canberra, including brief descriptions and links. Some of the projects highlighted include LobbyLens, an in-depth visualization of lobbying groups; WTFGD, which shows the functions of government departments; and My Representatives, an API for finding your elected representatives. It also provides information on the organizers of GovHack Canberra from Web Directions, Government 2.0 Task Force, CSIRO, ANU, and NodeCity.
Presentation made at the Metadata Australia conference, Canberra, May 2010 (also available via metadataaustralia2010.com)
(Light) Introduction to work done in the Semantic Sensor Networks Incubator activity.
Analysis of the commonalities and differences for the adoption of semantic web standards by sensing web and eGov communities of practice.
Description of the work done for the Semantic Markup activity of the Semantic Sensor Networks Incubator activity (at W3C).
Presentation made at the Australian Ontology Workshop, Melbourne, December 2009. The full title of the paper is: "Review of semantic enablement techniques used in geospatial and semantic standards for legacy and opportunistic mashups" (and it is available via crpit.com)
Canberra Semantic Web Meetup, 2 August 2010
The talk objective is to encourage the Meetup members to participate and prepare the Sydney Amped Hack Day (October 16 in Sydney: http://ampedweb.org/ ).
AI 101: An Introduction to the Basics and Impact of Artificial IntelligenceIndexBug
Imagine a world where machines not only perform tasks but also learn, adapt, and make decisions. This is the promise of Artificial Intelligence (AI), a technology that's not just enhancing our lives but revolutionizing entire industries.
Have you ever been confused by the myriad of choices offered by AWS for hosting a website or an API?
Lambda, Elastic Beanstalk, Lightsail, Amplify, S3 (and more!) can each host websites + APIs. But which one should we choose?
Which one is cheapest? Which one is fastest? Which one will scale to meet our needs?
Join me in this session as we dive into each AWS hosting service to determine which one is best for your scenario and explain why!
Cosa hanno in comune un mattoncino Lego e la backdoor XZ?Speck&Tech
ABSTRACT: A prima vista, un mattoncino Lego e la backdoor XZ potrebbero avere in comune il fatto di essere entrambi blocchi di costruzione, o dipendenze di progetti creativi e software. La realtà è che un mattoncino Lego e il caso della backdoor XZ hanno molto di più di tutto ciò in comune.
Partecipate alla presentazione per immergervi in una storia di interoperabilità, standard e formati aperti, per poi discutere del ruolo importante che i contributori hanno in una comunità open source sostenibile.
BIO: Sostenitrice del software libero e dei formati standard e aperti. È stata un membro attivo dei progetti Fedora e openSUSE e ha co-fondato l'Associazione LibreItalia dove è stata coinvolta in diversi eventi, migrazioni e formazione relativi a LibreOffice. In precedenza ha lavorato a migrazioni e corsi di formazione su LibreOffice per diverse amministrazioni pubbliche e privati. Da gennaio 2020 lavora in SUSE come Software Release Engineer per Uyuni e SUSE Manager e quando non segue la sua passione per i computer e per Geeko coltiva la sua curiosità per l'astronomia (da cui deriva il suo nickname deneb_alpha).
Main news related to the CCS TSI 2023 (2023/1695)Jakub Marek
An English 🇬🇧 translation of a presentation to the speech I gave about the main changes brought by CCS TSI 2023 at the biggest Czech conference on Communications and signalling systems on Railways, which was held in Clarion Hotel Olomouc from 7th to 9th November 2023 (konferenceszt.cz). Attended by around 500 participants and 200 on-line followers.
The original Czech 🇨🇿 version of the presentation can be found here: https://www.slideshare.net/slideshow/hlavni-novinky-souvisejici-s-ccs-tsi-2023-2023-1695/269688092 .
The videorecording (in Czech) from the presentation is available here: https://youtu.be/WzjJWm4IyPk?si=SImb06tuXGb30BEH .
Your One-Stop Shop for Python Success: Top 10 US Python Development Providersakankshawande
Simplify your search for a reliable Python development partner! This list presents the top 10 trusted US providers offering comprehensive Python development services, ensuring your project's success from conception to completion.
UiPath Test Automation using UiPath Test Suite series, part 6DianaGray10
Welcome to UiPath Test Automation using UiPath Test Suite series part 6. In this session, we will cover Test Automation with generative AI and Open AI.
UiPath Test Automation with generative AI and Open AI webinar offers an in-depth exploration of leveraging cutting-edge technologies for test automation within the UiPath platform. Attendees will delve into the integration of generative AI, a test automation solution, with Open AI advanced natural language processing capabilities.
Throughout the session, participants will discover how this synergy empowers testers to automate repetitive tasks, enhance testing accuracy, and expedite the software testing life cycle. Topics covered include the seamless integration process, practical use cases, and the benefits of harnessing AI-driven automation for UiPath testing initiatives. By attending this webinar, testers, and automation professionals can gain valuable insights into harnessing the power of AI to optimize their test automation workflows within the UiPath ecosystem, ultimately driving efficiency and quality in software development processes.
What will you get from this session?
1. Insights into integrating generative AI.
2. Understanding how this integration enhances test automation within the UiPath platform
3. Practical demonstrations
4. Exploration of real-world use cases illustrating the benefits of AI-driven test automation for UiPath
Topics covered:
What is generative AI
Test Automation with generative AI and Open AI.
UiPath integration with generative AI
Speaker:
Deepak Rai, Automation Practice Lead, Boundaryless Group and UiPath MVP
Programming Foundation Models with DSPy - Meetup SlidesZilliz
Prompting language models is hard, while programming language models is easy. In this talk, I will discuss the state-of-the-art framework DSPy for programming foundation models with its powerful optimizers and runtime constraint system.
Salesforce Integration for Bonterra Impact Management (fka Social Solutions A...Jeffrey Haguewood
Sidekick Solutions uses Bonterra Impact Management (fka Social Solutions Apricot) and automation solutions to integrate data for business workflows.
We believe integration and automation are essential to user experience and the promise of efficient work through technology. Automation is the critical ingredient to realizing that full vision. We develop integration products and services for Bonterra Case Management software to support the deployment of automations for a variety of use cases.
This video focuses on integration of Salesforce with Bonterra Impact Management.
Interested in deploying an integration with Salesforce for Bonterra Impact Management? Contact us at sales@sidekicksolutionsllc.com to discuss next steps.
5th LF Energy Power Grid Model Meet-up SlidesDanBrown980551
5th Power Grid Model Meet-up
It is with great pleasure that we extend to you an invitation to the 5th Power Grid Model Meet-up, scheduled for 6th June 2024. This event will adopt a hybrid format, allowing participants to join us either through an online Mircosoft Teams session or in person at TU/e located at Den Dolech 2, Eindhoven, Netherlands. The meet-up will be hosted by Eindhoven University of Technology (TU/e), a research university specializing in engineering science & technology.
Power Grid Model
The global energy transition is placing new and unprecedented demands on Distribution System Operators (DSOs). Alongside upgrades to grid capacity, processes such as digitization, capacity optimization, and congestion management are becoming vital for delivering reliable services.
Power Grid Model is an open source project from Linux Foundation Energy and provides a calculation engine that is increasingly essential for DSOs. It offers a standards-based foundation enabling real-time power systems analysis, simulations of electrical power grids, and sophisticated what-if analysis. In addition, it enables in-depth studies and analysis of the electrical power grid’s behavior and performance. This comprehensive model incorporates essential factors such as power generation capacity, electrical losses, voltage levels, power flows, and system stability.
Power Grid Model is currently being applied in a wide variety of use cases, including grid planning, expansion, reliability, and congestion studies. It can also help in analyzing the impact of renewable energy integration, assessing the effects of disturbances or faults, and developing strategies for grid control and optimization.
What to expect
For the upcoming meetup we are organizing, we have an exciting lineup of activities planned:
-Insightful presentations covering two practical applications of the Power Grid Model.
-An update on the latest advancements in Power Grid -Model technology during the first and second quarters of 2024.
-An interactive brainstorming session to discuss and propose new feature requests.
-An opportunity to connect with fellow Power Grid Model enthusiasts and users.
Monitoring and Managing Anomaly Detection on OpenShift.pdfTosin Akinosho
Monitoring and Managing Anomaly Detection on OpenShift
Overview
Dive into the world of anomaly detection on edge devices with our comprehensive hands-on tutorial. This SlideShare presentation will guide you through the entire process, from data collection and model training to edge deployment and real-time monitoring. Perfect for those looking to implement robust anomaly detection systems on resource-constrained IoT/edge devices.
Key Topics Covered
1. Introduction to Anomaly Detection
- Understand the fundamentals of anomaly detection and its importance in identifying unusual behavior or failures in systems.
2. Understanding Edge (IoT)
- Learn about edge computing and IoT, and how they enable real-time data processing and decision-making at the source.
3. What is ArgoCD?
- Discover ArgoCD, a declarative, GitOps continuous delivery tool for Kubernetes, and its role in deploying applications on edge devices.
4. Deployment Using ArgoCD for Edge Devices
- Step-by-step guide on deploying anomaly detection models on edge devices using ArgoCD.
5. Introduction to Apache Kafka and S3
- Explore Apache Kafka for real-time data streaming and Amazon S3 for scalable storage solutions.
6. Viewing Kafka Messages in the Data Lake
- Learn how to view and analyze Kafka messages stored in a data lake for better insights.
7. What is Prometheus?
- Get to know Prometheus, an open-source monitoring and alerting toolkit, and its application in monitoring edge devices.
8. Monitoring Application Metrics with Prometheus
- Detailed instructions on setting up Prometheus to monitor the performance and health of your anomaly detection system.
9. What is Camel K?
- Introduction to Camel K, a lightweight integration framework built on Apache Camel, designed for Kubernetes.
10. Configuring Camel K Integrations for Data Pipelines
- Learn how to configure Camel K for seamless data pipeline integrations in your anomaly detection workflow.
11. What is a Jupyter Notebook?
- Overview of Jupyter Notebooks, an open-source web application for creating and sharing documents with live code, equations, visualizations, and narrative text.
12. Jupyter Notebooks with Code Examples
- Hands-on examples and code snippets in Jupyter Notebooks to help you implement and test anomaly detection models.
Best 20 SEO Techniques To Improve Website Visibility In SERPPixlogix Infotech
Boost your website's visibility with proven SEO techniques! Our latest blog dives into essential strategies to enhance your online presence, increase traffic, and rank higher on search engines. From keyword optimization to quality content creation, learn how to make your site stand out in the crowded digital landscape. Discover actionable tips and expert insights to elevate your SEO game.
Webinar: Designing a schema for a Data WarehouseFederico Razzoli
Are you new to data warehouses (DWH)? Do you need to check whether your data warehouse follows the best practices for a good design? In both cases, this webinar is for you.
A data warehouse is a central relational database that contains all measurements about a business or an organisation. This data comes from a variety of heterogeneous data sources, which includes databases of any type that back the applications used by the company, data files exported by some applications, or APIs provided by internal or external services.
But designing a data warehouse correctly is a hard task, which requires gathering information about the business processes that need to be analysed in the first place. These processes must be translated into so-called star schemas, which means, denormalised databases where each table represents a dimension or facts.
We will discuss these topics:
- How to gather information about a business;
- Understanding dictionaries and how to identify business entities;
- Dimensions and facts;
- Setting a table granularity;
- Types of facts;
- Types of dimensions;
- Snowflakes and how to avoid them;
- Expanding existing dimensions and facts.
1. A Linked Sensor Data Cube
for a 100 year homogenised daily temperature dataset
Laurent Lefort
5th Semantic Sensor Network Workshop, 12 November 2012
CSIRO ICT CENTRE
2. Outline
• ACORN-SAT dataset
• Role of SSN ontology
• Role of RDF Data Cube vocabulary
• Integration of SSN and RDF Data Cube
• Lessons learned
• Conclusions
A Linked Sensor Data Cube for a 100 year homogenised daily temperature 2 | dataset | Laurent Lefort
3. The ACORN-SAT dataset
• Released by Aus. Bureau of Meteorology (23 March 2012)
• Available at http://www.bom.gov.au/climate/change/acorn-sat/
• 112 stations in total - 60 from 1910 to 2011
• Homogenised (adjusted) daily temperatures
• Tabular format (1 file per time series/station)
A Linked Sensor Data Cube for a 100 year homogenised daily temperature 3 | dataset | Laurent Lefort
4. The Linked Data version of ACORN-SAT
• Experimental version of ACORN-SAT data
• Available at http://lab.environment.data.gov.au/
• Developed for the Australian Bureau of Meteorology (BOM) by CSIRO in
cooperation with the Australian Government Information Management Office
(AGIMO)
• Temperature (homogenised) plus Rainfall (not homogenised)
• First version presented at Australian GovHack Day
• Alternative to tabular data
• Last version, uploaded to LOD cloud
• http://thedatahub.org/dataset/acorn-sat
A Linked Sensor Data Cube for a 100 year homogenised daily temperature 4 | dataset | Laurent Lefort
5. Motivation: linked gov. agencies data in Australia
• Linked data (and well managed URIs) to build the bridges between
the different agencies
• Current linked data pilot is one agency (BoM) and one server but
applies solutions and schemes already in place in multi-agencies
and multi-service providers context (e.g. UK)
• Thanks to AGIMO for helping us to set up
http://lab.environment.data.gov.au/
6. SSN Ontology
• SSN-XG report http://www.w3.org/2005/Incubator/ssn/XGR-ssn/
• SSN Ontology http://purl.oclc.org/NET/ssnx/ssn
• Navigable documentation on wiki auto derived
http://www.w3.org/2005/Incubator/ssn/wiki/SSN
A Linked Sensor Data Cube for a 100 year homogenised daily temperature 6 | dataset | Laurent Lefort
8. Specific challenges for the SSN Ontology
• ACORN-SAT data derived from multiple stations with complex history
• Uses homogenisation algorithm to make adjustments to raw data
• “Metadata” used by the algorithm to identify “breakpoints” in time series
– Site changes (moves, building or vegetation having an impact on the quality of
observation), sensor (and sensor screens) changes, procedure changes (hours
of observations)
• BoM station numbering system “somewhat confusing over time”
• Desire to retain a single site number for upper-air observations at obs sites
• Several numbering conventions have been used at one or more locations where
an overlap occurs between an old (comparison) and new site:
– Old site retains old number, new site opens with new number.
– Old site switches to new number for the duration of the comparison, new site
takes over old number from the start of its observations.
– New site opens under new number then switches to old number after end of
comparison.
A Linked Sensor Data Cube for a 100 year homogenised daily temperature 8 | dataset | Laurent Lefort
9. Linked ACORN SAT deployment data with SSN
• Data describing the deployment history
• Available in ACORN-SAT station catalogue (pdf)
• Not available in tabular format distribution
• ACORN-SAT composite stations
– System composed of one or several BoM stations
• BoM (Bureau of Meteorology) stations
– System composed of one or several station sharing the same codes
• Textual description of significant events
• Data describing the detailed conditions of observations
• Sensors
• Screens
• Automatic Weather stations
• Procedures e.g. hours of observation
A Linked Sensor Data Cube for a 100 year homogenised daily temperature 9 | dataset | Laurent Lefort
10. Example (Darwin)
Time series – Weather stations – Sites – (Sensors)
Darwin Post Office
014016 (1910-1942)
Darwin Airport
014015 (1941-2007 & 2001-now)
2 sites – 1km apart – same code used
A Linked Sensor Data Cube for a 100 year homogenised daily temperature 10 | dataset | Laurent Lefort
11. Deployment phases in Darwin
A Linked Sensor Data Cube for a 100 year homogenised daily temperature 11 | dataset | Laurent Lefort
12. RDF Data cube http://purl.org/linked-data/cube
• RDF Data Cube: a method to organise linked data in slices
• A vocabulary published by the W3C Government Linked Data (GLD) Working
Group (Working Draft)
• Also the method used to publish statistics data and environmental data in
Europe e.g. for Bathing Water Quality in UK
http://www.epimorphics.com/web/projects/bathing-water-quality
• Advantages
• Allows multiple views on the same data (similar to OLAP)
• Generic approach which supports the links to domain-specific definitions
• Useable:
• In any browser via Linked Data API (HTML output)
• In JavaScript via Linked Data API (JSON output)
• In R via SPARQL
12 | A Linked Sensor Data Cube for a 100 year homogenised daily temperature dataset | Laurent Lefort
13. From: The RDF Data Cube Vocabulary
W3C Working Draft 05 April 2012
http://www.w3.org/TR/vocab-data-cube/
13 | A Linked Sensor Data Cube for a 100 year homogenised daily temperature dataset | Laurent Lefort
14. Data cube, slice and observation
A Linked Sensor Data Cube for a 100 year homogenised daily temperature 14 | dataset | Laurent Lefort
Dimension d7
Dimension d6
Dimension d1
Dimension d2
Dimension d3
Dimension d4
Dimension d5
Measure m1, m2, …
Attribute a1, a2, …
Cube
Slice
Observation
16. Data Cube Structure:
dimensions, measure, attributes
Current Data Cube structure (and URI/API logic)
Observation
- MinTemperature
- MaxTemperature
- Rainfall
- Booleans for missing data
(2) Year
(3) Month
Day
A Linked Sensor Data Cube for a 100 year homogenised daily temperature 16 | dataset | Laurent Lefort
(1) ACORN-SAT Series/System (station)
• Stations/time series
• Year
• Month
• All linking to observations
17. Slices and URI scheme
A Linked Sensor Data Cube for a 100 year homogenised daily temperature 17 | dataset | Laurent Lefort
18. Coupling SSN and RDF Data Cube
A Linked Sensor Data Cube for a 100 year homogenised daily temperature 18 | dataset | Laurent Lefort
20. Access to data with Elda via
http://lab.environment.data.gov.au/
ssn:hasSubSystem
ssn:hasDeployment
ssn:observedBy ssn:deploymentProcessPart
A Linked Sensor Data Cube for a 100 year homogenised daily temperature 20 | dataset | Laurent Lefort
21. Mashups
• Display the station locations and their average temperature
readings on a map
• http://lab.environment.data.gov.au/mashup/drilldown
• Select a Date range for climate readings for a given location
• http://lab.environment.data.gov.au/mashup
A Linked Sensor Data Cube for a 100 year homogenised daily temperature 21 | dataset | Laurent Lefort
22. Lessons learned
• Flexible URI scheme
• ELDA-friendly, UK-style: using nested list endpoints and item endpoints
– http://lab.environment.data.gov.au/data/acorn/climate/slice/station
– http://lab.environment.data.gov.au/data/acorn/climate/slice/station/014015
• Extra slice(s) easy to add to allow multiple access to the same observations
• RDF Data Cube vocabulary (QB)
• Some clarifications needed for qb:structure, qb:sliceKey, qb:sliceStructure,
qb:component and qb:componentAttachment properties e.g. through the
publication of validation rules
• Coupling of SSN ontology and RDF Data Cube vocabulary
• Different ecosystems (OWL vs. RDF/RDFS)
– OK for RDF Data Cube, not OK for other reused vocabularies e.g. UK Intervals
(Jena Eyeball used for validation)
• Observed properties are classes in the SSN ontology and properties in the RDF
Data Cube
– Possibility to reuse/extend the qb:concept properties defined to manage
references to skos:Concept in QB
A Linked Sensor Data Cube for a 100 year homogenised daily temperature 22 | dataset | Laurent Lefort
23. Conclusions
• Approach is applicable to all climate time series
• Several climate-specific issues not addressed
• Transparency/reproducibility of homogenisation process
– Require raw data plus extra (meta)data (sensors, screen types, sensors
exposure, “qualified” observed properties during a specific observation
interval), plus data used/generated during homogenisation algorithm (ACORN-SAT
uses different values for different value distribution percentiles)
– More ontology work needed (compared to SSN) on homogenisation algorithms
parameters, types of breakpoints and types of adjustment lookup table
• Opportunities to link to other datasets (Australia, World)
• Geo-features (e.g. GeoNames - done) for weather station sites, districts
• Other climate data e.g. regional and world climate data archives, cyclone tracks
(not yet available as linked data)
• Other environmental data (not yet available as linked data)
A Linked Sensor Data Cube for a 100 year homogenised daily temperature 23 | dataset | Laurent Lefort
24. Thank you
Division/Unit Name
Laurent Lefort
Ontologist
t +61 2 9123 4567
e laurent.lefort@csiro.au
w ict.csiro.au
CSIRO ICT CENTRE
25. Images credits
• Blair Trewin The ACORN-SAT station at Butlers Gorge in central
Tasmania (surfacetemperatures.blogspot.com.au )
A Linked Sensor Data Cube for a 100 year homogenised daily temperature 25 | dataset | Laurent Lefort
26. Reused ontologies
Ontology Short Description URL
DOLCE Ultra
Lite (DUL)
A lightweight foundational ontology for
modeling either physical or social contexts
http://www.loa-cnr.
it/ontologies/DUL.owl
Semantic
Sensor Network
An ontology for the description of sensors
and observations, and related concepts.
http://purl.oclc.org/NET/ssnx/ssn
RDF Data Cube
A vocabulary for the publication of multi-dimensional
data as linked data
http://purl.org/linked-data/cube
OWL Time An ontology of temporal concepts http://www.w3.org/2006/time
Intervals
A vocabulary (and URI scheme) for the
definition of instants and intervals.
http://reference.data.gov.uk/def/in
tervals
WGS84_Pos
A vocabulary for representing latitude,
longitude and altitude information in the
WGS84 geodetic reference datum
http://www.w3.org/2003/01/geo/w
gs84_pos
GeoNames
An ontology for the description of
geographical features, their characteristics
and relationships
http://www.geonames.org/ontolog
y/ontology_v3.01.rdf
VoID (Vocabula-ry
of Interlinked
Datasets)
A vocabulary for expressing metadata
about RDF datasets
http://vocab.deri.ie/void
A Linked Sensor Data Cube for a 100 year homogenised daily temperature 26 | dataset | Laurent Lefort
27. Developed ontologies
Ontology Short Description URL
ETCCDI
Indicators defined by the joint
CCl/CLIVAR/JCOMM Expert Team on
Climate Change Detection and Indices
A Linked Sensor Data Cube for a 100 year homogenised daily temperature 27 | dataset | Laurent Lefort
http://purl.oclc.org/NET/ssnx/etccdi
Rainfall
districts and
states
Geographical areas defined as part of the
Bureau's numbering system for observation
sites
http://lab.environment.data.gov.au/
def/stations/raindist
…/rainstate
BoM Station
Definition for the weather stations
registered in the Bureau’s Weather Station
Directory
http://lab.environment.data.gov.au/
def/stations/station
Surface Air
Temperature
ACORN-SAT observation (temperature,
rainfall) for one day
http://lab.environment.data.gov.au/
def/acorn/sat
Time Series
Time series data defined as data cube
slices (aggregated at different levels)
http://lab.environment.data.gov.au/
def/acorn/time-series
ACORN-SAT
deployment
Phases and sub-phases recorded in the
ACORN-SAT documentation pack
http://lab.environment.data.gov.au/
def/acorn/deployment
ACORN-SAT
system
The sensing asset used for a deployment
phases (or sub-phase)
http://lab.environment.data.gov.au/
def/acorn/system
ACORN-SAT
site
The site used for a deployment phase (or
sub-phase)
http://lab.environment.data.gov.au/
def/acorn/site
28. RDF Data Cube (qb:ComponentAttachement)
A Linked Sensor Data Cube for a 100 year homogenised daily temperature 28 | dataset | Laurent Lefort
29. Reference to skos:Concept
A Linked Sensor Data Cube for a 100 year homogenised daily temperature 29 | dataset | Laurent Lefort
Editor's Notes
The ACORN-SAT dataset replaces the previously released long term climate time series datasets released by the bureau (eg High Quality dataset)
OWL2 ontology, SRIQ(D)
41 concepts & 39 object properties, organised into ten conceptual modules
117 concepts and 142 object properties in total, including DUL
Aligned to DOLCE UltraLite
Working Draft http://www.w3.org/TR/vocab-data-cube/