This study develops a regression-based model to predict students' learning styles by analyzing a dataset from 72 students using a VARK questionnaire. Unlike traditional classification methods, the proposed model offers a probabilistic approach that can handle learners with mixed learning styles effectively. Results indicate that regression techniques outperform classification algorithms, providing more accurate insights into students' preferred learning styles, thus aiding educational institutions in personalizing teaching methods.
![Indonesian Journal of Electrical Engineering and Computer Science
Vol. 25, No. 2, February 2022, pp. 1177~1185
ISSN: 2502-4752, DOI: 10.11591/ijeecs.v25.i2.pp1177-1185 1177
Journal homepage: http://ijeecs.iaescore.com
Predicting students' learning styles using regression techniques
Ahmad Mousa Altamimi1
, Mohammad Azzeh2
, Mahmoud Albashayreh1
1
Department of Computer Science, Applied Science Private University, Amman, Jordan
2
Department of Data Science, Princess Sumaya University for Technology, Amman, Jordan
Article Info ABSTRACT
Article history:
Received Aug 10, 2021
Revised Nov 23, 2021
Accepted Dec 1, 2021
Traditional learning systems have responded quickly to the COVID
pandemic and moved to online or distance learning. Online learning requires
a personalization method because the interaction between learners and
instructors is minimal, and learners have a specific learning method that
works best for them. One of the personalization methods is detecting the
learners' learning style. To detect learning styles, several works have been
proposed using classification techniques. However, the current detection
models become ineffective when learners have no dominant style or a mix of
learning styles. Thus, the objective of this study is twofold. Firstly,
constructing a prediction model based on regression analysis provides a
probabilistic approach for inferring the preferred learning style. Secondly,
comparing regression models and classification models for detecting
learning style. To ground our conceptual model, a set of machine learning
algorithms have been implemented based on a dataset collected from a
sample of 72 students using visual, auditory, reading/writing, and kinesthetic
(VARK's) inventory questionnaire. Results show that regression techniques
are more accurate and representative for real-world scenarios than
classification algorithms, where students might have multiple learning styles
but with different probabilities. We believe that this research will help
educational institutes to engage learning styles in the teaching process.
Keywords:
Classification techniques
Learning styles
Regression analysis
VARK
This is an open access article under the CC BY-SA license.
Corresponding Author:
Ahmad Mousa Altamimi
Department of Computer Science, Applied Science Private University
21 Al Arab st., Amman 11931, Jordan
Email: a_altamimi@asu.edu.jo
1. INTRODUCTION
Due to the COVID pandemic, the largest disruption to education in history has been recorded, which
has had a nearly universal impact on learners and educators worldwide [1]. As a result, learning systems have
successfully undergone critical changes and used new models (i.e., online learning or distance learning)
supported by information and communication technologies [2]. Online learning enriches conventional
learning by offering flexibility and self-paced learning with an efficient way to deliver knowledge through
virtual communication and collaboration [3]. However, it requires a personalization method as learners have
different backgrounds, knowledge, and various learning environments [4]. One of the personalization
methods is detecting the learners' learning style as it influences individual academic achievement [5]. The
concept of learning style was coined during the mid of 70's and is formally defined as: "an individual's mode
of gaining knowledge" [6]. It is the best method a person uses to learn.
Many learning styles' theories have been introduced in the field of education and widespread
recognition in education theory and learning strategies [7]. These theories include ones that classify people
according to their own distinguishing features that differentiate one from others. The widespread theories are
motivated by the fact that knowing a learner's learning style can enable instructors to maximize learners'](https://image.slidesharecdn.com/26818-52216-1-pb-240917071601-af88483d/85/Predicting-students-learning-styles-using-regression-techniques-1-320.jpg)
![Indonesian Journal of Electrical Engineering and Computer Science
Vol. 25, No. 2, February 2022, pp. 1177~1185
ISSN: 2502-4752, DOI: 10.11591/ijeecs.v25.i2.pp1177-1185 1177
Journal homepage: http://ijeecs.iaescore.com
Predicting students' learning styles using regression techniques
Ahmad Mousa Altamimi1
, Mohammad Azzeh2
, Mahmoud Albashayreh1
1
Department of Computer Science, Applied Science Private University, Amman, Jordan
2
Department of Data Science, Princess Sumaya University for Technology, Amman, Jordan
Article Info ABSTRACT
Article history:
Received Aug 10, 2021
Revised Nov 23, 2021
Accepted Dec 1, 2021
Traditional learning systems have responded quickly to the COVID
pandemic and moved to online or distance learning. Online learning requires
a personalization method because the interaction between learners and
instructors is minimal, and learners have a specific learning method that
works best for them. One of the personalization methods is detecting the
learners' learning style. To detect learning styles, several works have been
proposed using classification techniques. However, the current detection
models become ineffective when learners have no dominant style or a mix of
learning styles. Thus, the objective of this study is twofold. Firstly,
constructing a prediction model based on regression analysis provides a
probabilistic approach for inferring the preferred learning style. Secondly,
comparing regression models and classification models for detecting
learning style. To ground our conceptual model, a set of machine learning
algorithms have been implemented based on a dataset collected from a
sample of 72 students using visual, auditory, reading/writing, and kinesthetic
(VARK's) inventory questionnaire. Results show that regression techniques
are more accurate and representative for real-world scenarios than
classification algorithms, where students might have multiple learning styles
but with different probabilities. We believe that this research will help
educational institutes to engage learning styles in the teaching process.
Keywords:
Classification techniques
Learning styles
Regression analysis
VARK
This is an open access article under the CC BY-SA license.
Corresponding Author:
Ahmad Mousa Altamimi
Department of Computer Science, Applied Science Private University
21 Al Arab st., Amman 11931, Jordan
Email: a_altamimi@asu.edu.jo
1. INTRODUCTION
Due to the COVID pandemic, the largest disruption to education in history has been recorded, which
has had a nearly universal impact on learners and educators worldwide [1]. As a result, learning systems have
successfully undergone critical changes and used new models (i.e., online learning or distance learning)
supported by information and communication technologies [2]. Online learning enriches conventional
learning by offering flexibility and self-paced learning with an efficient way to deliver knowledge through
virtual communication and collaboration [3]. However, it requires a personalization method as learners have
different backgrounds, knowledge, and various learning environments [4]. One of the personalization
methods is detecting the learners' learning style as it influences individual academic achievement [5]. The
concept of learning style was coined during the mid of 70's and is formally defined as: "an individual's mode
of gaining knowledge" [6]. It is the best method a person uses to learn.
Many learning styles' theories have been introduced in the field of education and widespread
recognition in education theory and learning strategies [7]. These theories include ones that classify people
according to their own distinguishing features that differentiate one from others. The widespread theories are
motivated by the fact that knowing a learner's learning style can enable instructors to maximize learners'](https://image.slidesharecdn.com/26818-52216-1-pb-240917071601-af88483d/75/Predicting-students-learning-styles-using-regression-techniques-1-2048.jpg)
![ ISSN: 2502-4752
Indonesian J Elec Eng & Comp Sci, Vol. 25, No. 2, February 2022: 1177-1185
1178
learning by using adapted teaching methods and allowing them to recognize their learning styles to find what
study methods and activities help them learn best [8]. Thus, the awareness of the learning styles roles in the
education process is very important for both learners and researchers [9].
Inventories are used to recognize individuals' learning styles, typically take the form of a
questionnaire assessment, where a series of questions are asked and then scored the results to illustrate the
dominant learning styles. There are many popular learning style inventories proposed in the literature, such
as fleming's visual, auditory, reading/writing, and kinesthetic (VARK) learning style questionnaire [10],
Kolb's learning style inventory (LSI) [11], Jackson's learning styles profiler (LSP) [12], and other. Each of
these proposed a set of questions to identify the learners' different styles. For example, according to VARK,
learners are categorized into four different types: visual, auditory, reading/writing, and kinesthetic [10]. On
the other hand, Kolb's is also one of the widely used inventories identifying four learning styles [11].
More recently, considerable research has been devoted to automatically detecting the learning style
[13]-[15]. In fact, educational data mining is the leading approach concerned with applying machine learning
to the collected information from educational settings. Here, both classification and clustering algorithms
have been applied. While the classification technique is applied for discrete variables, the regression
technique is applied for continuous variables. Classification algorithms were the dominate into two
approaches: clustering and classification. For example, Aissaoui et al. [15] utilized the K-modes clustering
algorithm to improve the e-learning system. The model was implemented based on the Felder and Silverman
learning style model using a dataset extracted from an e-learning system's log file.
Other classification algorithms have also been used. The decision tree (DT) was used in [16] to
detect the learners' learning styles from students' weblogs. Pantho [17] also used the decision tree C4.5
algorithm to identify the learning styles. Here, the sample was collected from 1,205 students using the VARK
questionnaire. Other algorithms have also been utilized. The neural networks was employed in [18], where
Felder-Silverman's model was used to identify four dimensions of learning styles. These dimensions are
sensing or intuitive, active or reflective, visual or verbal, and sequential or global. Felder-Silverman's model
was also used in [14], but the fuzzy C-means was employed as a clustering algorithm to detect learners' styles
based on their data stored in the log files.
On the other hand, Genetic algorithms were employed to describe learning styles. Yannibelli et al. [19]
define a group of chromosomes and assign the learner's action to each gene. Then used these genes generate
new populations of chromosomes that describe learning styles. In the same vein, the work of [20] classified
learners based on their learning styles by combining genetic algorithms with k-nearest neighbors (K-NN). In
this work, the learners' behaviours are represented in an n-dimensional space. Learners are then considered to
have the same learning style if they have a shorter distance to others. Lwande et al. [21] combined both
felder-silverman learning style model and cognitive trait model to estimate learning styles from learning
management system (LMS). Results showed a possible estimation for the learning styles. Another study [22]
have conducted that used different machine learning models to predict learning outcome. The study read
records from e-learning platform to get the relevant features.
Recently, educational data mining has been extensively considered in the literature. The educational
data mining community defines it as an emerging discipline concerned with developing methods for
exploring unique educational data types to understand students' learning settings better [23]. The spreading of
educational data mining is due to the emergence of numerous public data mining tools such as R, waikato
environment for knowledge analysis (WEKA), RapidMiner, and konstanz information miner (KNIME) [24].
Wahbeh et al. [25] demonstrated a comparison between these tools, and it concludes that each of these tools
has its advantages and disadvantages. Educational data mining was also used to predict students' performance
using classification and regression techniques [26]. While the classification technique is applied for discrete
variables, the regression technique is applied for continuous variables [27]. Lincke et al. [22] employed the
artificial neural network with a sample of 316 undergraduate students to predict academic performance.
Results showed that students' performance in the course is improved when considering their learning styles.
Aissaoui et al. [28] utilized multiple linear regression (MLR) to build a student' performance prediction
model. The obtained results show that the model outperforms the other constructed models.
As one can be noticed, almost all of the proposed works were designed to detect the learners'
learning styles and identify a single learning style for each learner. However, in practice, learners might have
a single or multiple learning styles, where one can equally prefer both visual and auditory learning styles. For
learners with a mix of learning styles (with probability) or with no dominant style of learning, detecting a
single learning style is becoming ineffective. This was supported by Azzi et al. [29], where the researchers
proved that learners have different learning styles, and thus, no single system can serve well with all learners.
Therefore, the current approaches do not support this trend, and thus a new learning style detection system
has been proposed to solve this issue based on regression analysis. To the best of our knowledge, no work](https://image.slidesharecdn.com/26818-52216-1-pb-240917071601-af88483d/85/Predicting-students-learning-styles-using-regression-techniques-2-320.jpg)
![ ISSN: 2502-4752
Indonesian J Elec Eng & Comp Sci, Vol. 25, No. 2, February 2022: 1177-1185
1184
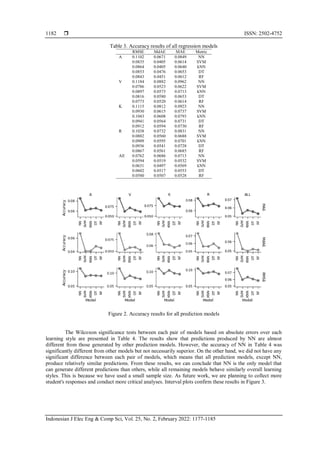
for predicting the probabilities of all learning styles. To examine the effectiveness of our approach, the same
set of machine learning algorithms were used to develop classification models for predicting the learning
style label. We aimed to compare the finding with the classification-based approach. We observed that the
accuracies of all classification models are relatively low. The RF showed the best accuracy with 0.53 to
predict learning style (A). Moreover, the overall results are not encouraging, suggesting that none of the
models can produce highly accurate predictions. So, we conclude that regression algorithms are more
accurate and representative for predicting learning styles' probabilities. As future work, we plan to apply
different techniques to our dataset and collect more students' responses to conduct more critical analyses.
ACKNOWLEDGEMENTS
The authors are grateful to the Applied Science Private University, Amman-Jordan, for the full
financial support granted to cover the publication fee of this research article.
REFERENCES
[1] M. S. Hasibuan, L. E. Nugroho, and P. I. Santosa, “Model detecting learning styles with artificial neural network,” Journal of
Technology and Science Education, vol. 9, no. 1, pp. 85–95, 2019, doi: 10.3926/jotse.540.
[2] E. Goh and M. Sigala, “Integrating Information & Communication Technologies (ICT) into classroom instruction: teaching tips
for hospitality educators from a diffusion of innovation approach,” Journal of Teaching in Travel and Tourism, vol. 20, no. 2,
pp. 156–165, Apr. 2020, doi: 10.1080/15313220.2020.1740636.
[3] J. L. Moore, C. Dickson-Deane, and K. Galyen, “E-Learning, online learning, and distance learning environments: Are they the
same?,” Internet and Higher Education, vol. 14, no. 2, pp. 129–135, 2011, doi: 10.1016/j.iheduc.2010.10.001.
[4] J. Bernard, T. W. Chang, E. Popescu, and S. Graf, “Learning style Identifier: Improving the precision of learning style
identification through computational intelligence algorithms,” Expert Systems with Applications, vol. 75, pp. 94–108, 2017,
doi: 10.1016/j.eswa.2017.01.021.
[5] G. Cheng and J. Chau, “Exploring the relationships between learning styles, online participation, learning achievement and course
satisfaction: An empirical study of a blended learning course,” British Journal of Educational Technology, vol. 47, no. 2,
pp. 257–278, Mar. 2016, doi: 10.1111/bjet.12243.
[6] M. Rais, F. Aryani, and A. S. Ahmar, “The influence of the inquiry learning model and learning style on the drawing technique of
students,” Global Journal of Engineering Education, vol. 20, no. 1, pp. 64–68, 2018, doi: 10.26858/gjeev20i1y2018p6468.
[7] J. W. Keefe, Learning style theory and practice. 1987.
[8] T. R. Frame, S. M. Cailor, R. J. Gryka, A. M. Chen, M. E. Kiersma, and L. Sheppard, “Student perceptions of team-based
learning vs traditional lecture-based learning,” American Journal of Pharmaceutical Education, vol. 79, no. 4, 2015,
doi: 10.5688/ajpe79451.
[9] A. Bhagat, R. Vyas, and T. Singh, “Students awareness of learning styles and their perceptions to a mixed method approach for
learning,” International Journal of Applied and Basic Medical Research, vol. 5, no. 4, p. 58, 2015, doi: 10.4103/2229-
516x.162281.
[10] N. D. Fleming and D. Baume, “Learning Styles Again: VARKing up the right tree!,” Educational Developments, SEDA Ltd,
vol. 7, no. 4, pp. 4–7, 2006.
[11] D. C. Kayes, “Internal validity and reliability of Kolb’s learning style inventory version 3 (1999),” Journal of Business and
Psychology, vol. 20, no. 2, pp. 249–257, 2005, doi: 10.1007/s10869-005-8262-4.
[12] F. Coffield, D. Moseley, E. Hall, and K. Ecclestone, “Learning styles and pedagogy in post-16 learning: A systematic and critical
review. National Centre for Vocational Education Research (NCVER),” 2004.
[13] F. Rasheed and A. Wahid, “Learning style detection in E-learning systems using machine learning techniques,” Expert Systems
with Applications, vol. 174, 2021, doi: 10.1016/j.eswa.2021.114774.
[14] O. El Aissaoui, Y. El Alami El Madani, L. Oughdir, and Y. El Allioui, “A fuzzy classification approach for learning style
prediction based on web mining technique in e-learning environments,” Education and Information Technologies, vol. 24, no. 3,
pp. 1943–1959, May 2019, doi: 10.1007/s10639-018-9820-5.
[15] O. El Aissaoui, Y. E. A. El Madani, L. Oughdir, and Y. El Allioui, “Combining supervised and unsupervised machine learning
algorithms to predict the learners’ learning styles,” in Procedia Computer Science, 2019, vol. 148, pp. 87–96, doi:
10.1016/j.procs.2019.01.012.
[16] G. A. M. Kalhoro, A. Ahmed, and S. Rajper, “Detection of E-Learners’ Learning Styles: An Automatic Approach using Decision
Tree,” International Journal of Computer Science and Information Security, vol. 14, no. 8, p. 420, 2016.
[17] O. Pantho, “Using Decision Tree C4. 5 Algorithm to Predict VARK Learning Styles,” International Journal of the Computer, the
Internet and Management, vol. 24, no. 2, pp. 58–63, 2016.
[18] B. Hmedna, A. El Mezouary, and O. Baz, “Identifying and tracking learning styles in MOOCs: A neural networks approach,”
Advances in Intelligent Systems and Computing, vol. 520, no. 2, pp. 125–134, 2017, doi: 10.1109/ICMCS.2016.7905606.
[19] V. Yannibelli, D. Godoy, and A. Amandi, “A genetic algorithm approach to recognise students’ learning styles,” Interactive
Learning Environments, vol. 14, no. 1, pp. 55–78, Apr. 2006, doi: 10.1080/10494820600733565.
[20] Y. C. Chang, W. Y. Kao, C. P. Chu, and C. H. Chiu, “A learning style classification mechanism for e-learning,” Computers and
Education, vol. 53, no. 2, pp. 273–285, 2009, doi: 10.1016/j.compedu.2009.02.008.
[21] C. Lwande, L. Muchemi, and R. Oboko, “Identifying learning styles and cognitive traits in a learning management system,”
Heliyon, vol. 7, no. 8, p. e07701, Aug. 2021, doi: 10.1016/j.heliyon.2021.e07701.
[22] A. Lincke, M. Jansen, M. Milrad, and E. Berge, “The performance of some machine learning approaches and a rich context model
in student answer prediction,” Research and Practice in Technology Enhanced Learning, vol. 16, no. 1, pp. 1–16, Dec. 2021, doi:
10.1186/S41039-021-00159-7/TABLES/5.
[23] C. Romero and S. Ventura, “Educational data mining and learning analytics: An updated survey,” Wiley Interdisciplinary
Reviews: Data Mining and Knowledge Discovery, vol. 10, no. 3, p. e1355, May 2020, doi: 10.1002/widm.1355.](https://image.slidesharecdn.com/26818-52216-1-pb-240917071601-af88483d/85/Predicting-students-learning-styles-using-regression-techniques-8-320.jpg)
![Indonesian J Elec Eng & Comp Sci ISSN: 2502-4752
Predicting students' learning styles using regression techniques (Ahmad Mousa Altamimi)
1185
[24] A. Jović, K. Brkić, and N. Bogunović, “An overview of free software tools for general data mining,” in 2014 37th International
Convention on Information and Communication Technology, Electronics and Microelectronics, MIPRO 2014 - Proceedings,
2014, pp. 1112–1117, doi: 10.1109/MIPRO.2014.6859735.
[25] A. H. Wahbeh, Q. A. Al-Radaideh, M. N. Al-Kabi, and E. M. Al-Shawakfa, “A Comparison Study between Data Mining Tools
over some Classification Methods,” International Journal of Advanced Computer Science and Applications, vol. 1, no. 3, 2011,
doi: 10.14569/specialissue.2011.010304.
[26] A. M. Shahiri, W. Husain, and N. A. Rashid, “A Review on Predicting Student’s Performance Using Data Mining Techniques,” in
Procedia Computer Science, Jan. 2015, vol. 72, pp. 414–422, doi: 10.1016/j.procs.2015.12.157.
[27] H. Aldowah, H. Al-Samarraie, and W. M. Fauzy, “Educational data mining and learning analytics for 21st century higher
education: A review and synthesis,” Telematics and Informatics, vol. 37, pp. 13–49, Apr. 2019, doi:
10.1016/J.TELE.2019.01.007.
[28] O. El Aissaoui, Y. El Alami El Madani, L. Oughdir, A. Dakkak, and Y. El Allioui, “A Multiple Linear Regression-Based
Approach to Predict Student Performance,” in Advances in Intelligent Systems and Computing, Jul. 2020, vol. 1102 AISC,
pp. 9–23, doi: 10.1007/978-3-030-36653-7_2.
[29] I. Azzi, A. Jeghal, A. Radouane, A. Yahyaouy, and H. Tairi, “A robust classification to predict learning styles in adaptive E-
learning systems,” Education and Information Technologies, vol. 25, no. 1, pp. 437–448, Jan. 2020, doi: 10.1007/s10639-019-
09956-6.
BIOGRAPHIES OF AUTHORS
Ahmad Mousa Altamimi is an associate professor of computer science at
Applied Science Private University. He has been received his PhD degree in Computer
Science from Concordia University-Montreal, Canada, in 2014. His research interests are
primarily in machine learning, Cybersecurity, and online education. Dr Altamimi participated
in the organization of many conferences. He has many publications in reputable journals and
international conferences. He can be contacted at email: a_altamimi@asu.edu.jo.
Mohammad Azzeh is a professor of Computing at Princess Sumaya University
for Technology. He holds PhD in computing from the University of Bradford, UK and MSc in
Software Engineering from the University of the West of England, UK. His research interests
focus on Data Science, Mining Software Repositories, Machine Learning for Software
Engineering Problems, and Software Cost Estimation. Dr. Azzeh is an invited referee for high-
quality journals and published over 50 research articles in reputable journals and conferences.
He can be contacted at email: m.azzeh@psut.edu.jo.
Mahmood AlBashayreh is a PhD holder in Software Engineering since 2014.
His research interests include reuse-based software engineering, context-aware computing,
mobile patient monitoring systems, application frameworks, and conceptual modelling of
information systems. Dr Mahmoud has recently focused on using machine learning and deep
learning techniques for Natural Language Processing (NLP). He can be contacted at email:
m_albashayreh@asu.edu.jo.](https://image.slidesharecdn.com/26818-52216-1-pb-240917071601-af88483d/85/Predicting-students-learning-styles-using-regression-techniques-9-320.jpg)