Download to read offline
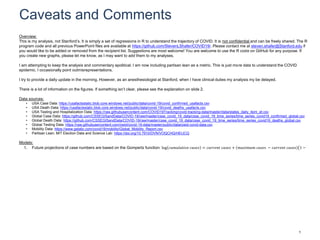
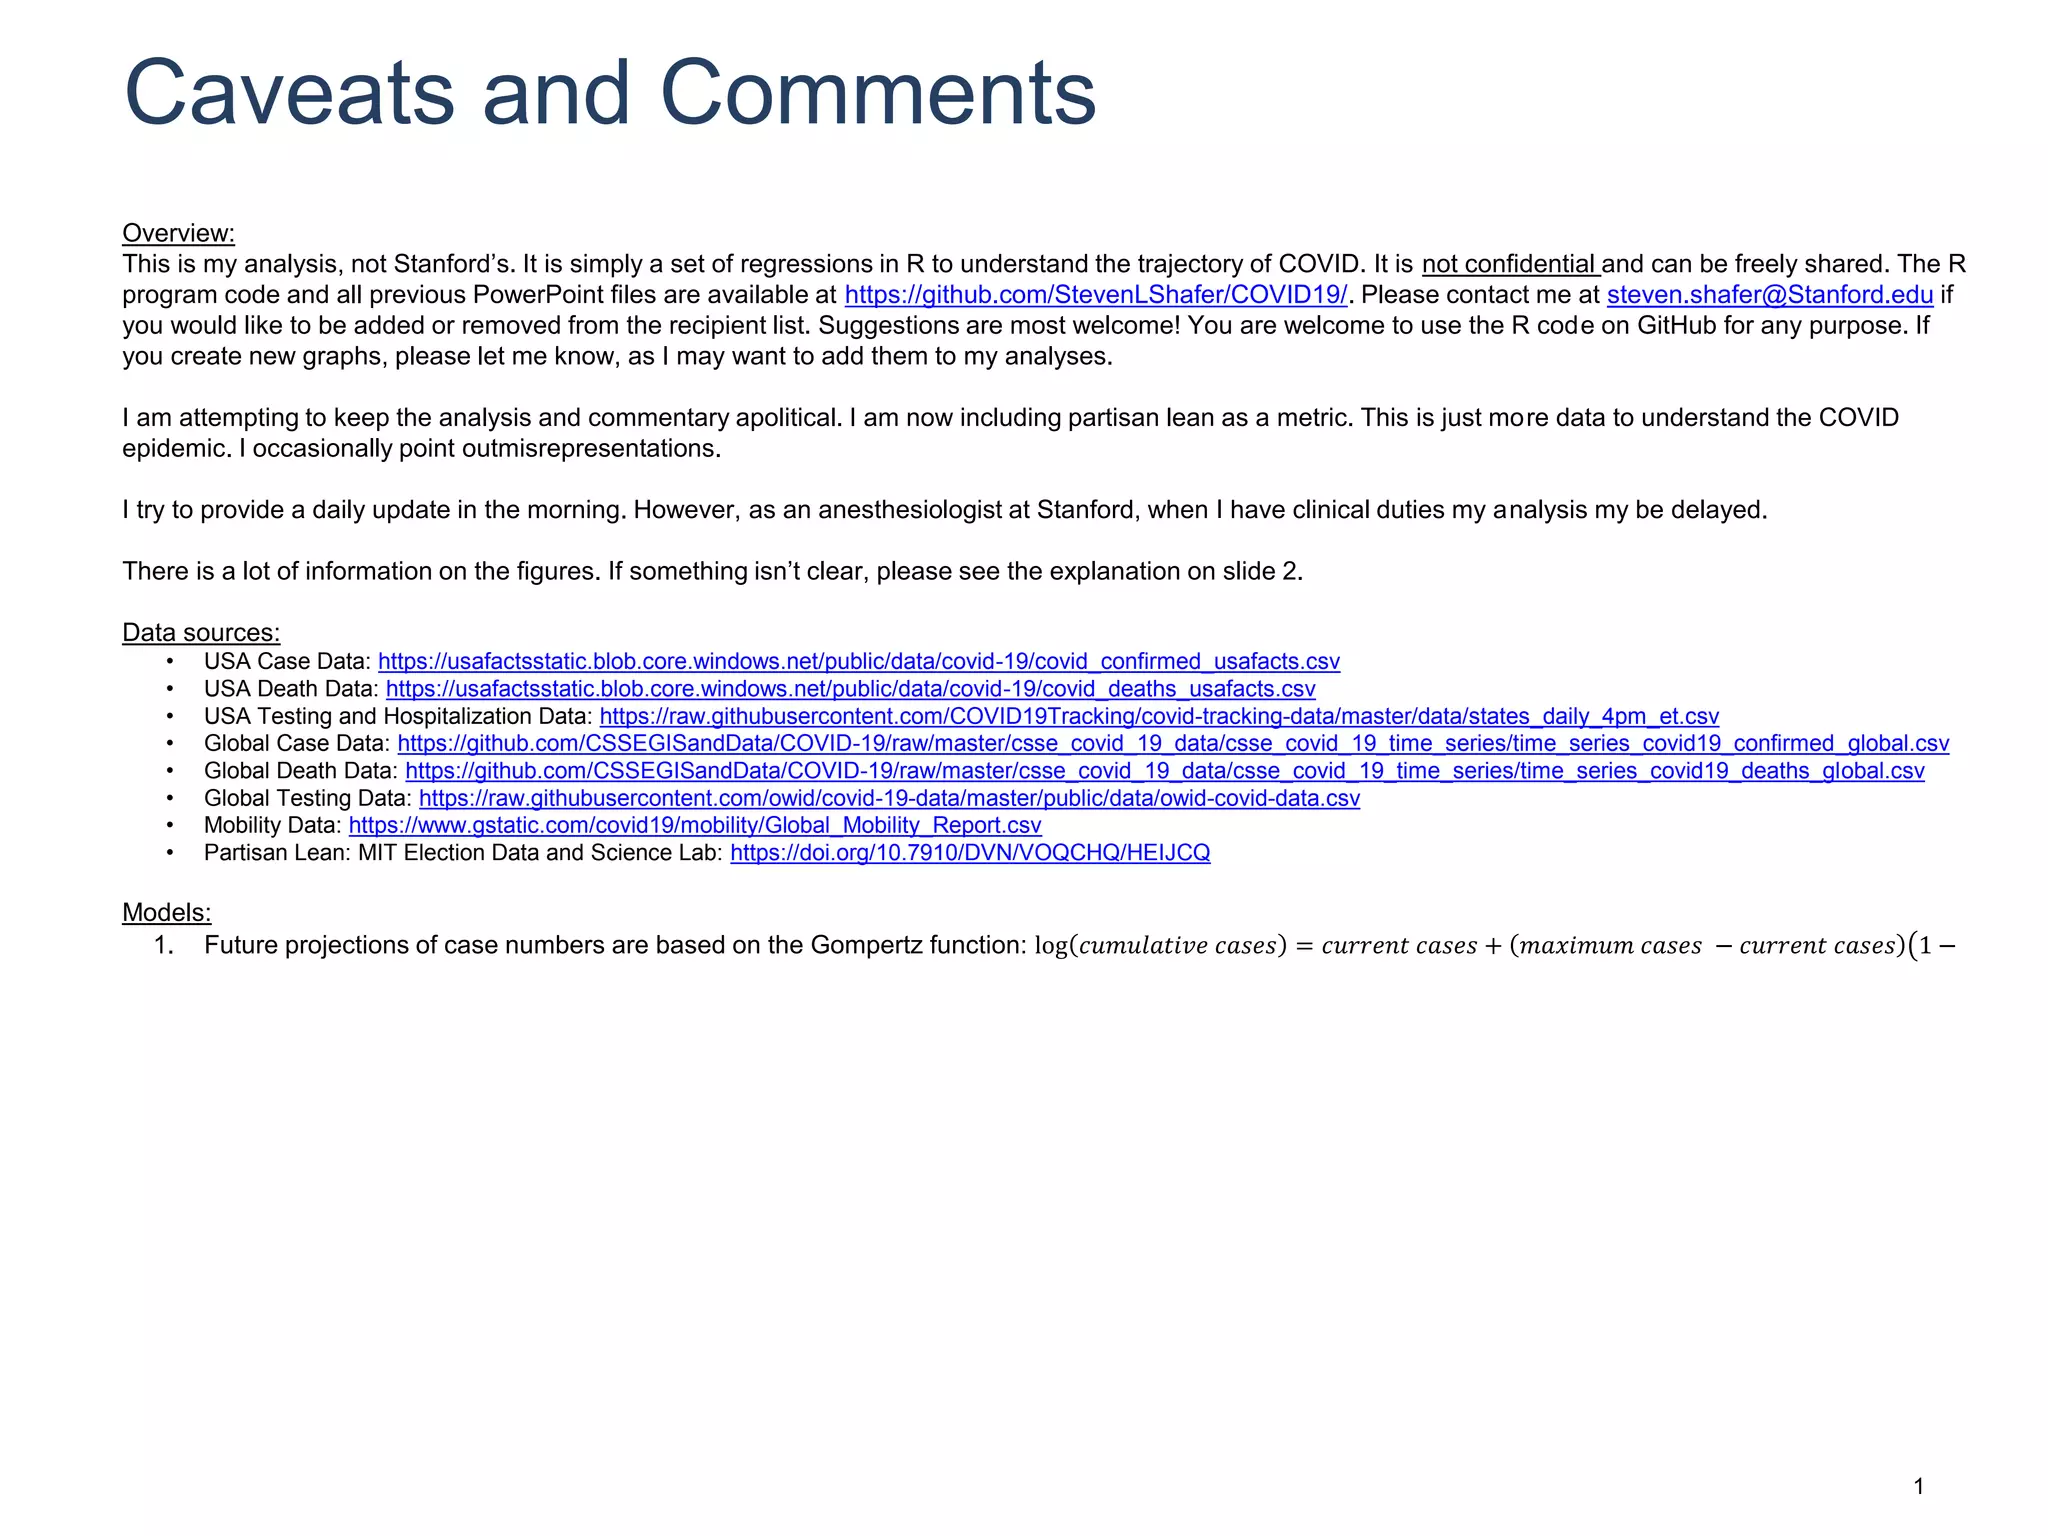
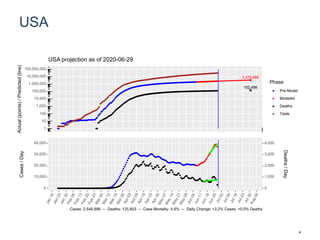
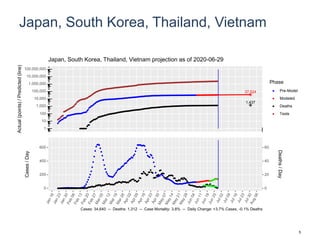
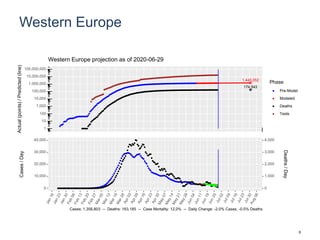

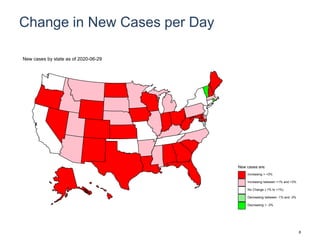
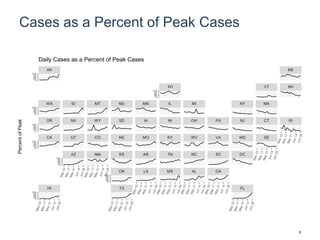
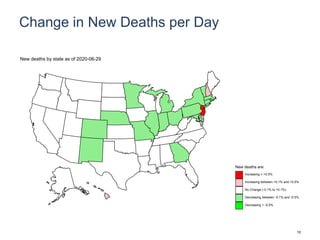
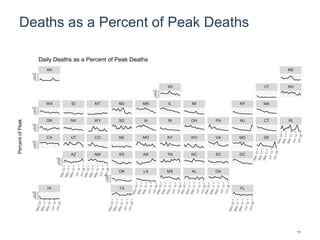
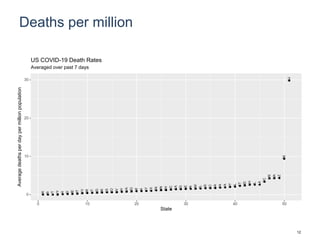
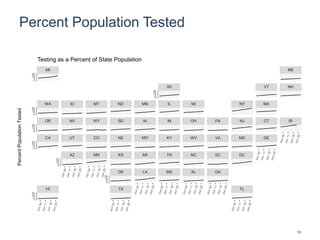
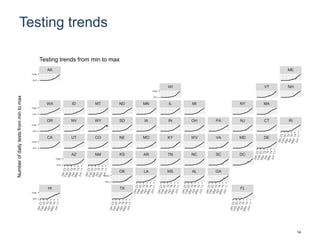

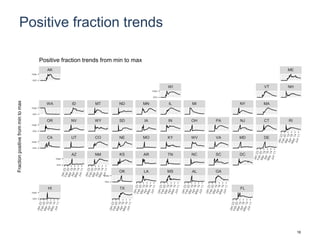
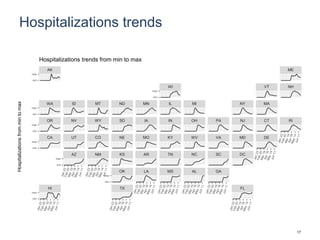
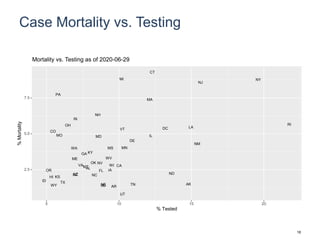
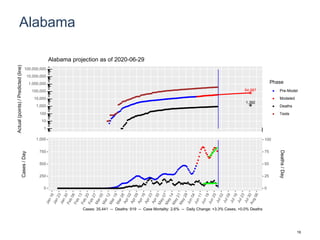
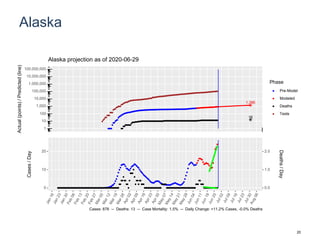
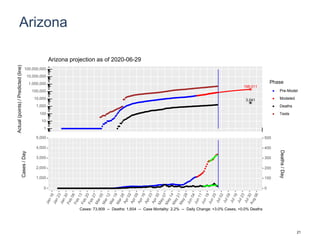
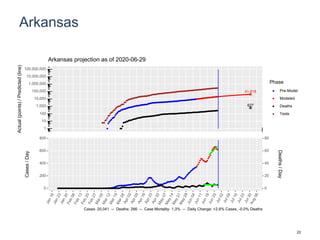
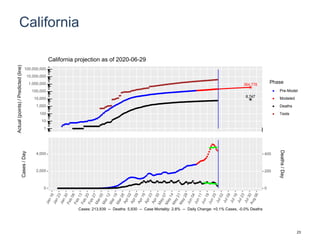
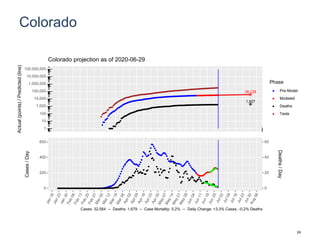
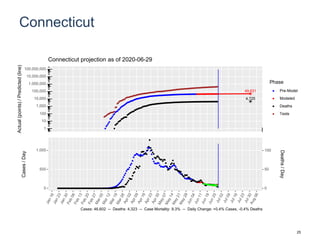
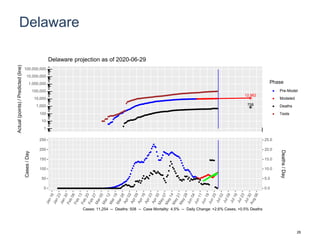
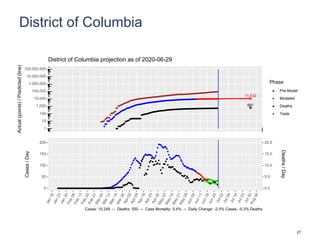
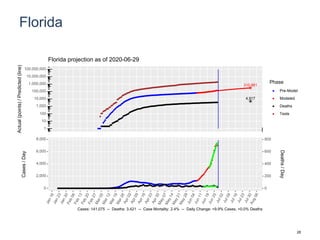
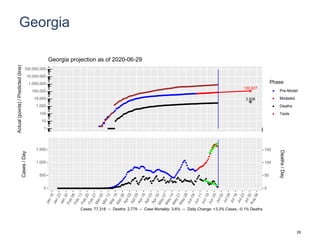
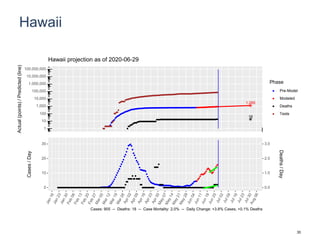
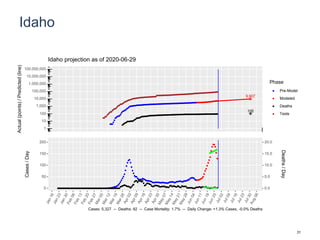
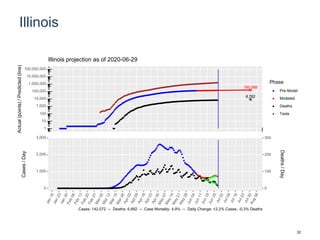
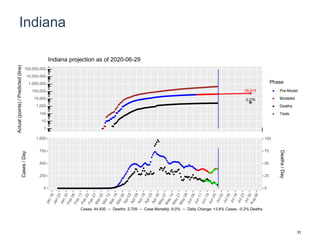
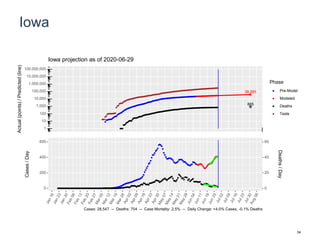
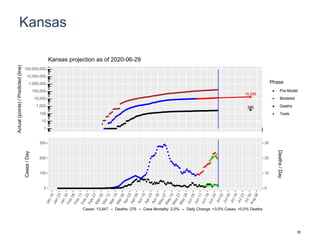
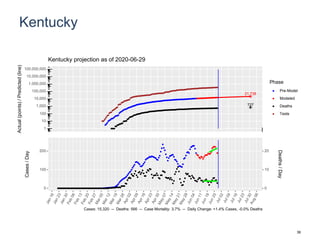
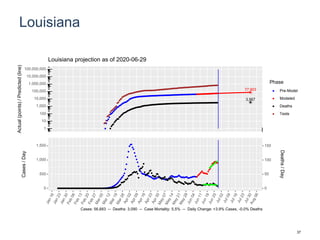
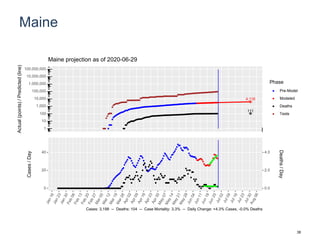
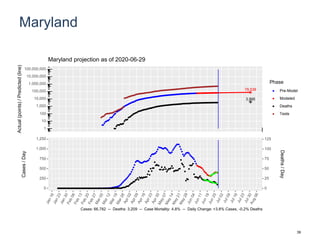
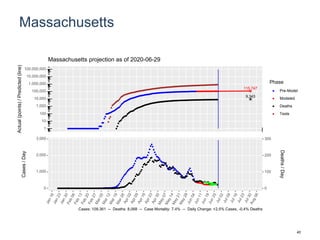
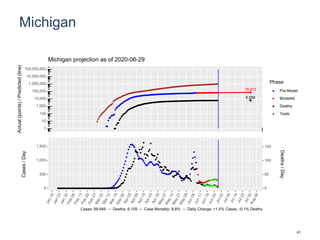
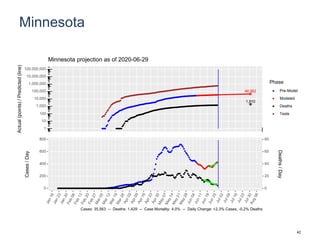
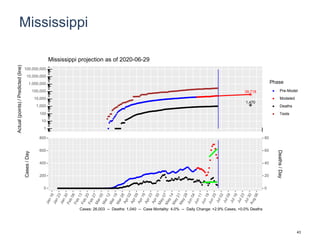
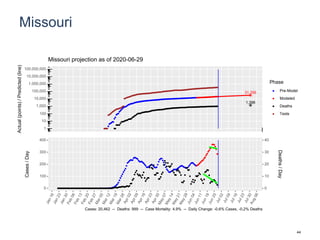
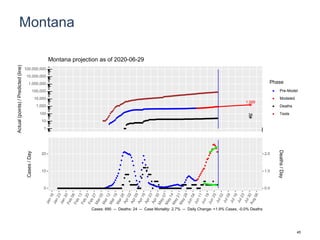
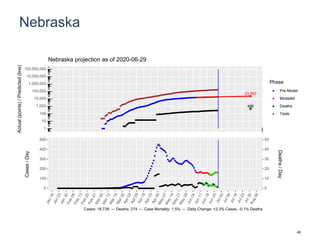
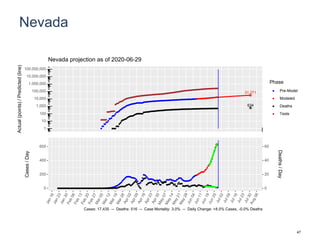
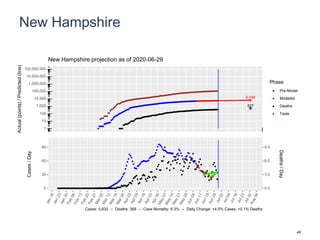
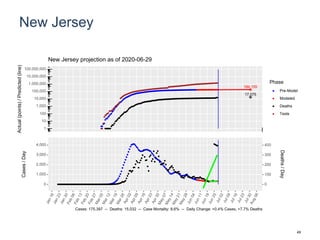
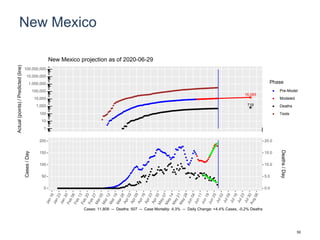
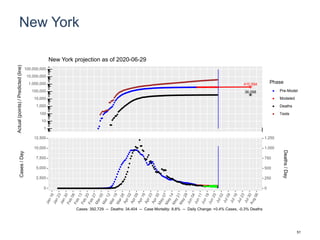
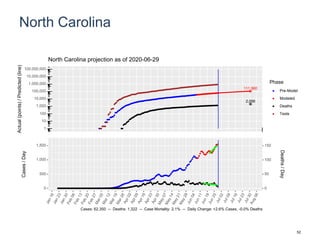
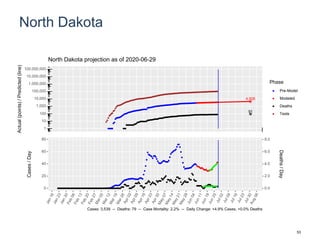
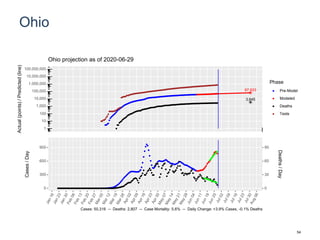
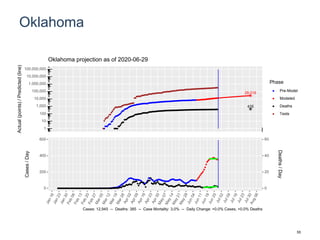
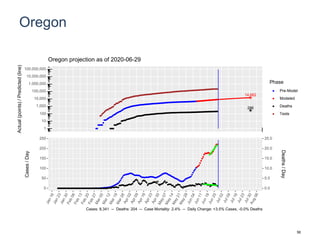
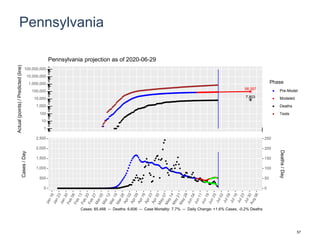
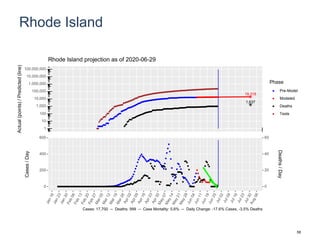
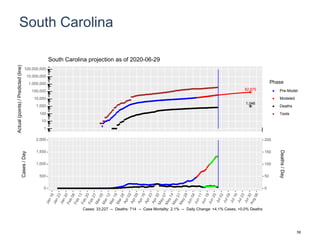
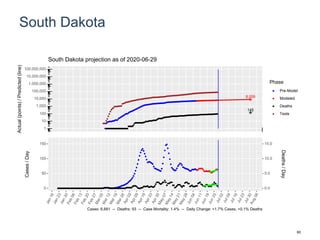
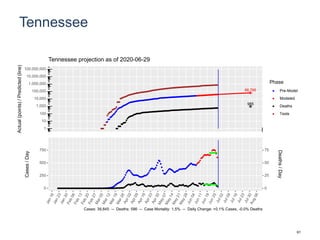
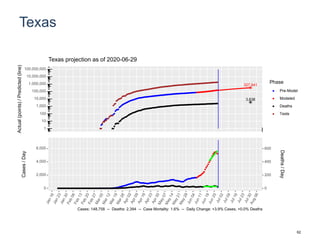
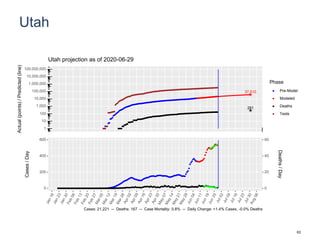
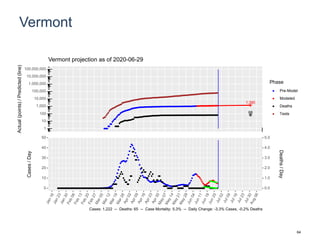
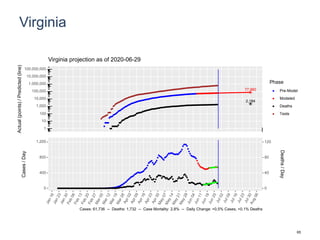
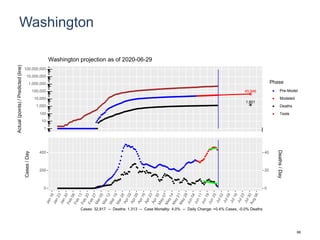
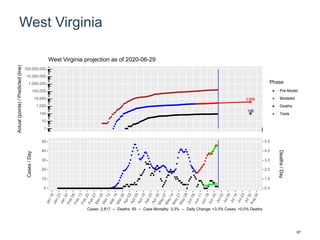
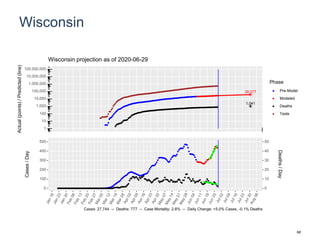
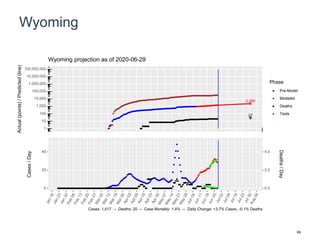
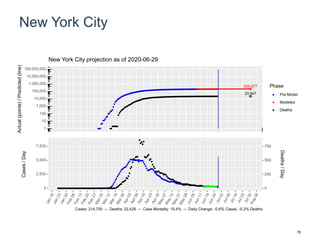
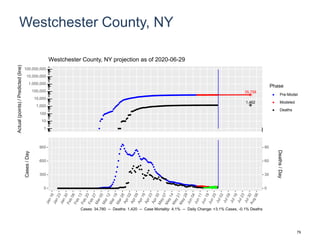
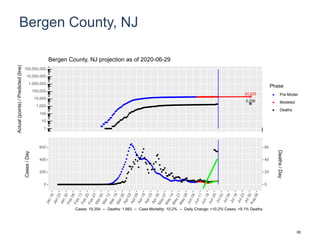
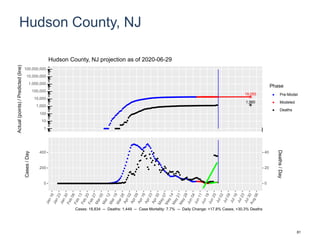
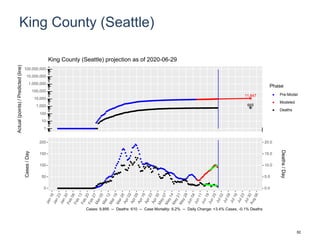
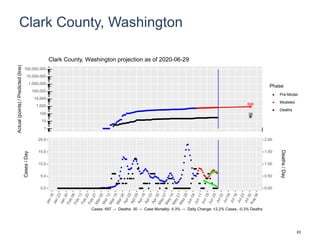
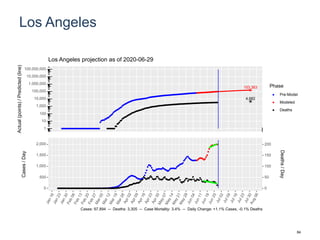
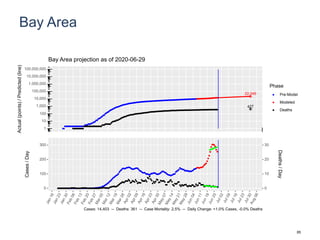
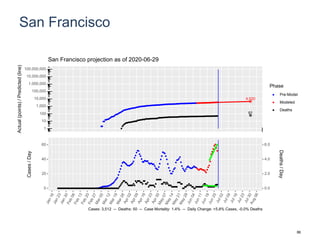
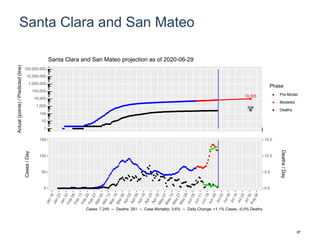
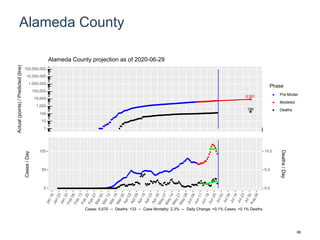
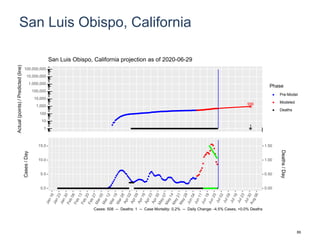
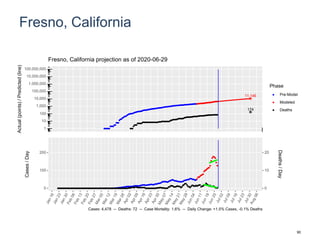
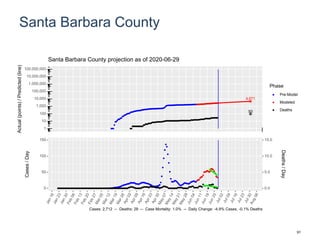

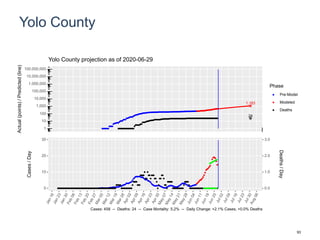
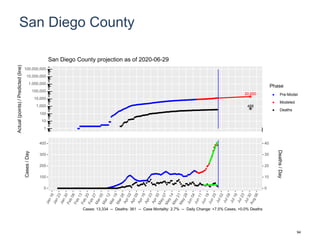
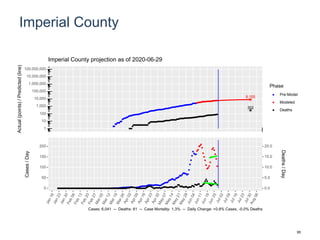
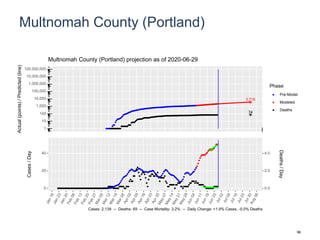
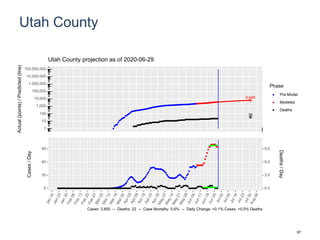
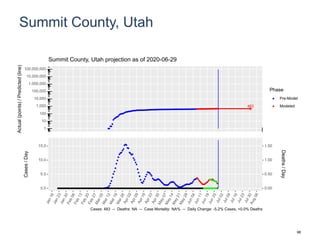
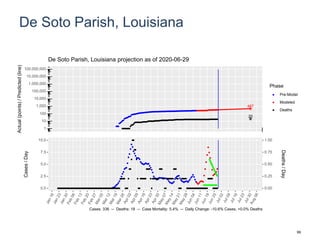
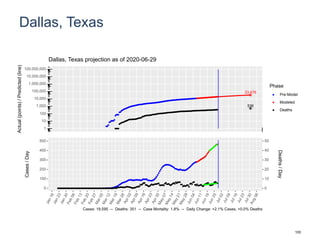
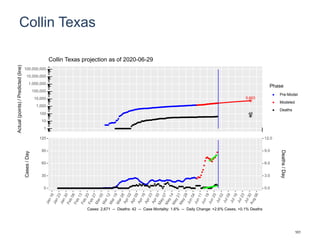
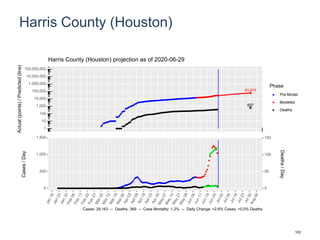
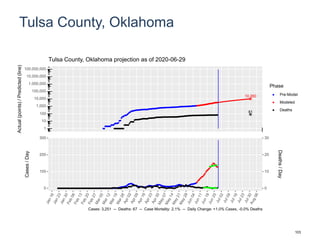
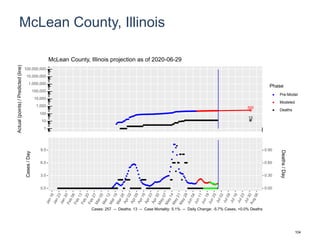
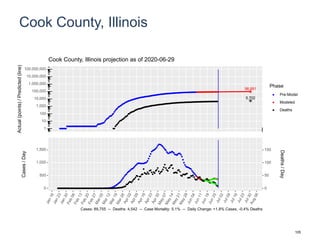
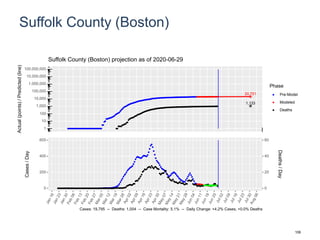
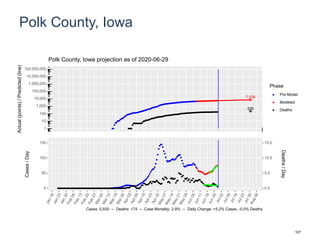
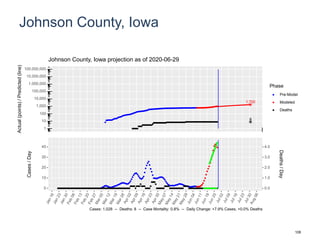
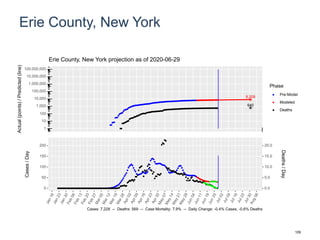
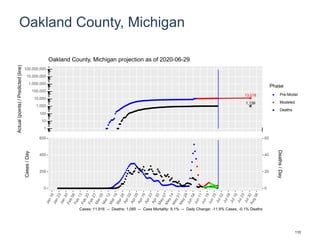
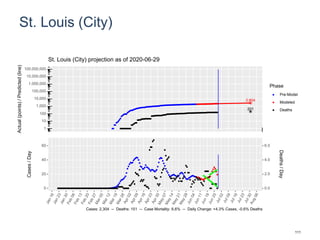
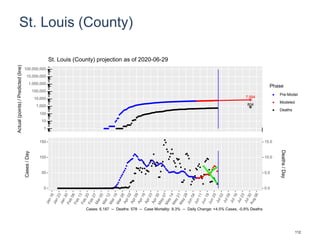
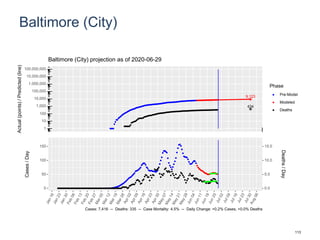
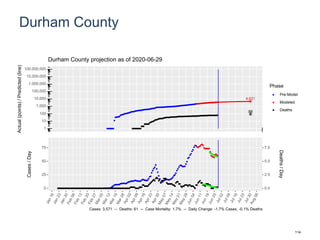
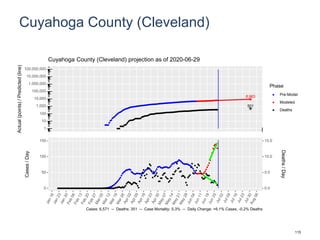
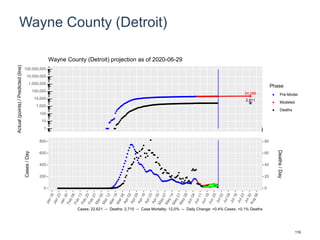
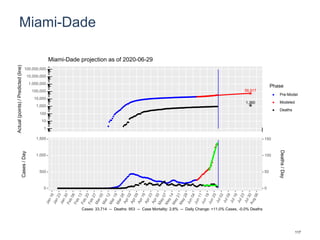
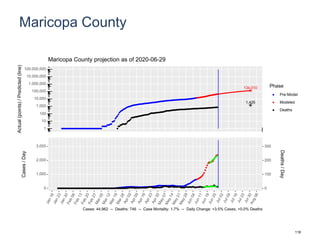
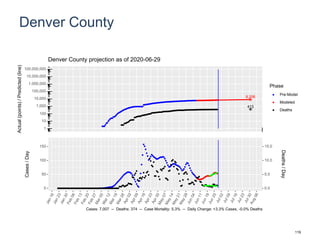
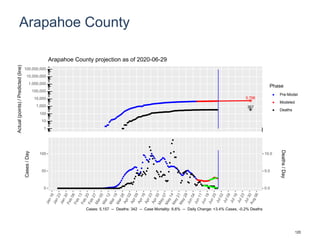
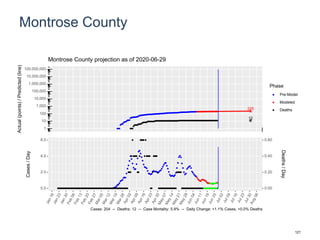

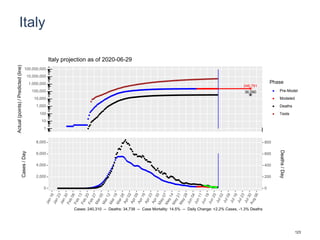
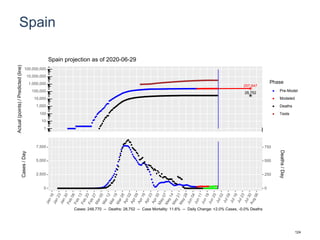
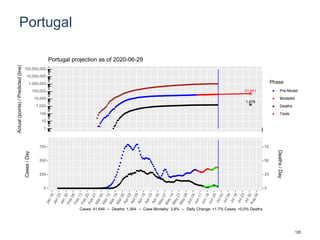
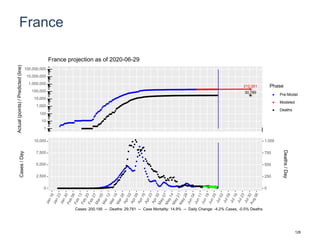
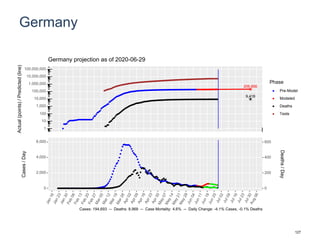
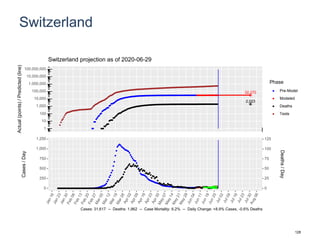
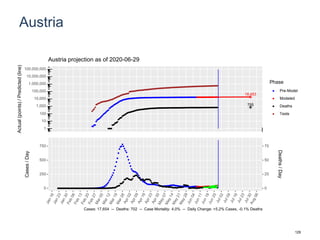
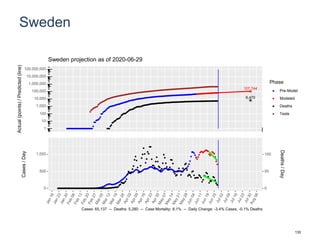
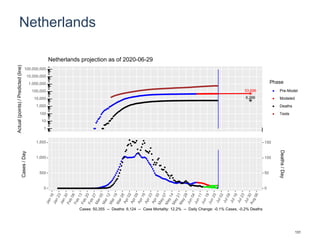
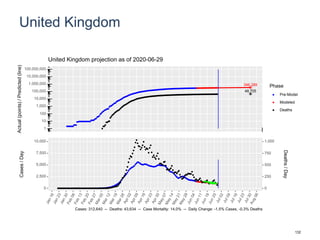
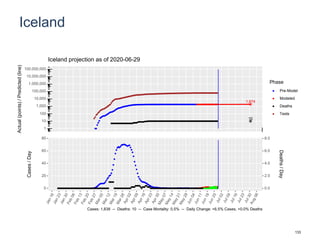
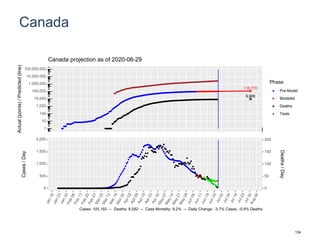
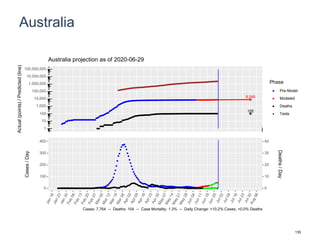
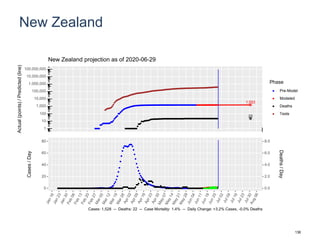
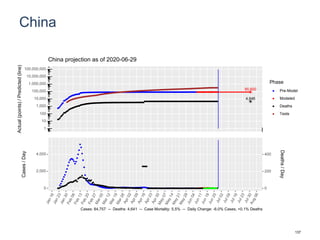
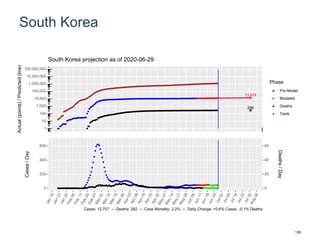
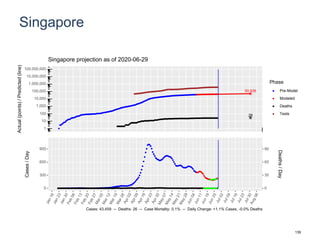
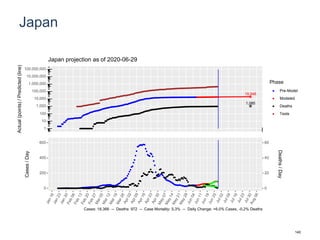
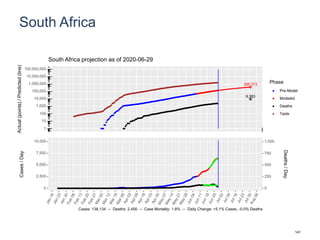
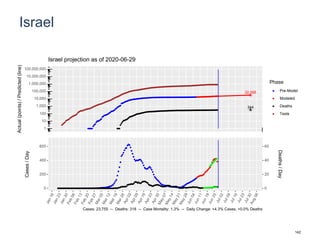
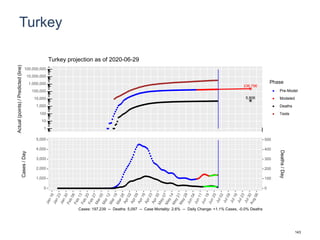
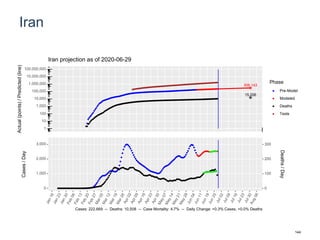
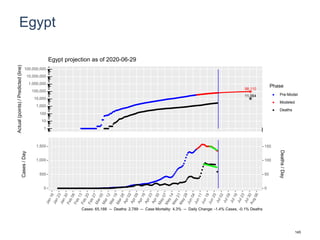
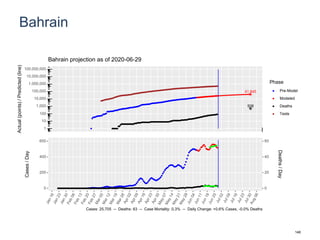
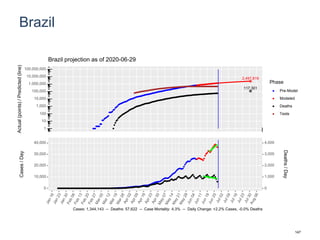
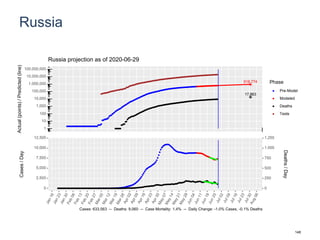
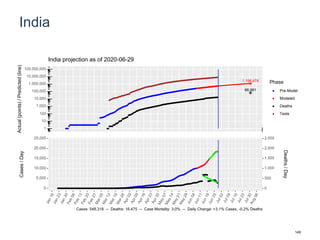
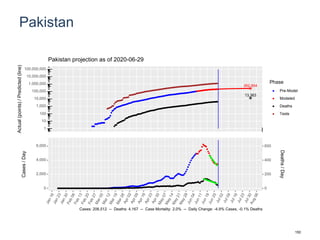
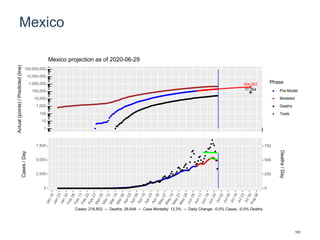
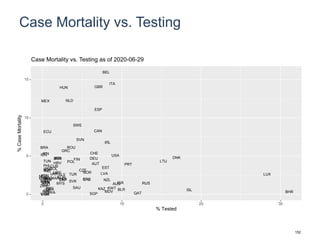

This document provides an analysis of COVID-19 cases in the United States and around the world. It includes 13 figures with charts and graphs projecting case numbers, death counts, testing rates, and other metrics for different states and regions. The analysis is conducted by an anesthesiologist at Stanford University for informational purposes and is updated daily. Data sources and modeling approaches are described.


