Download to read offline

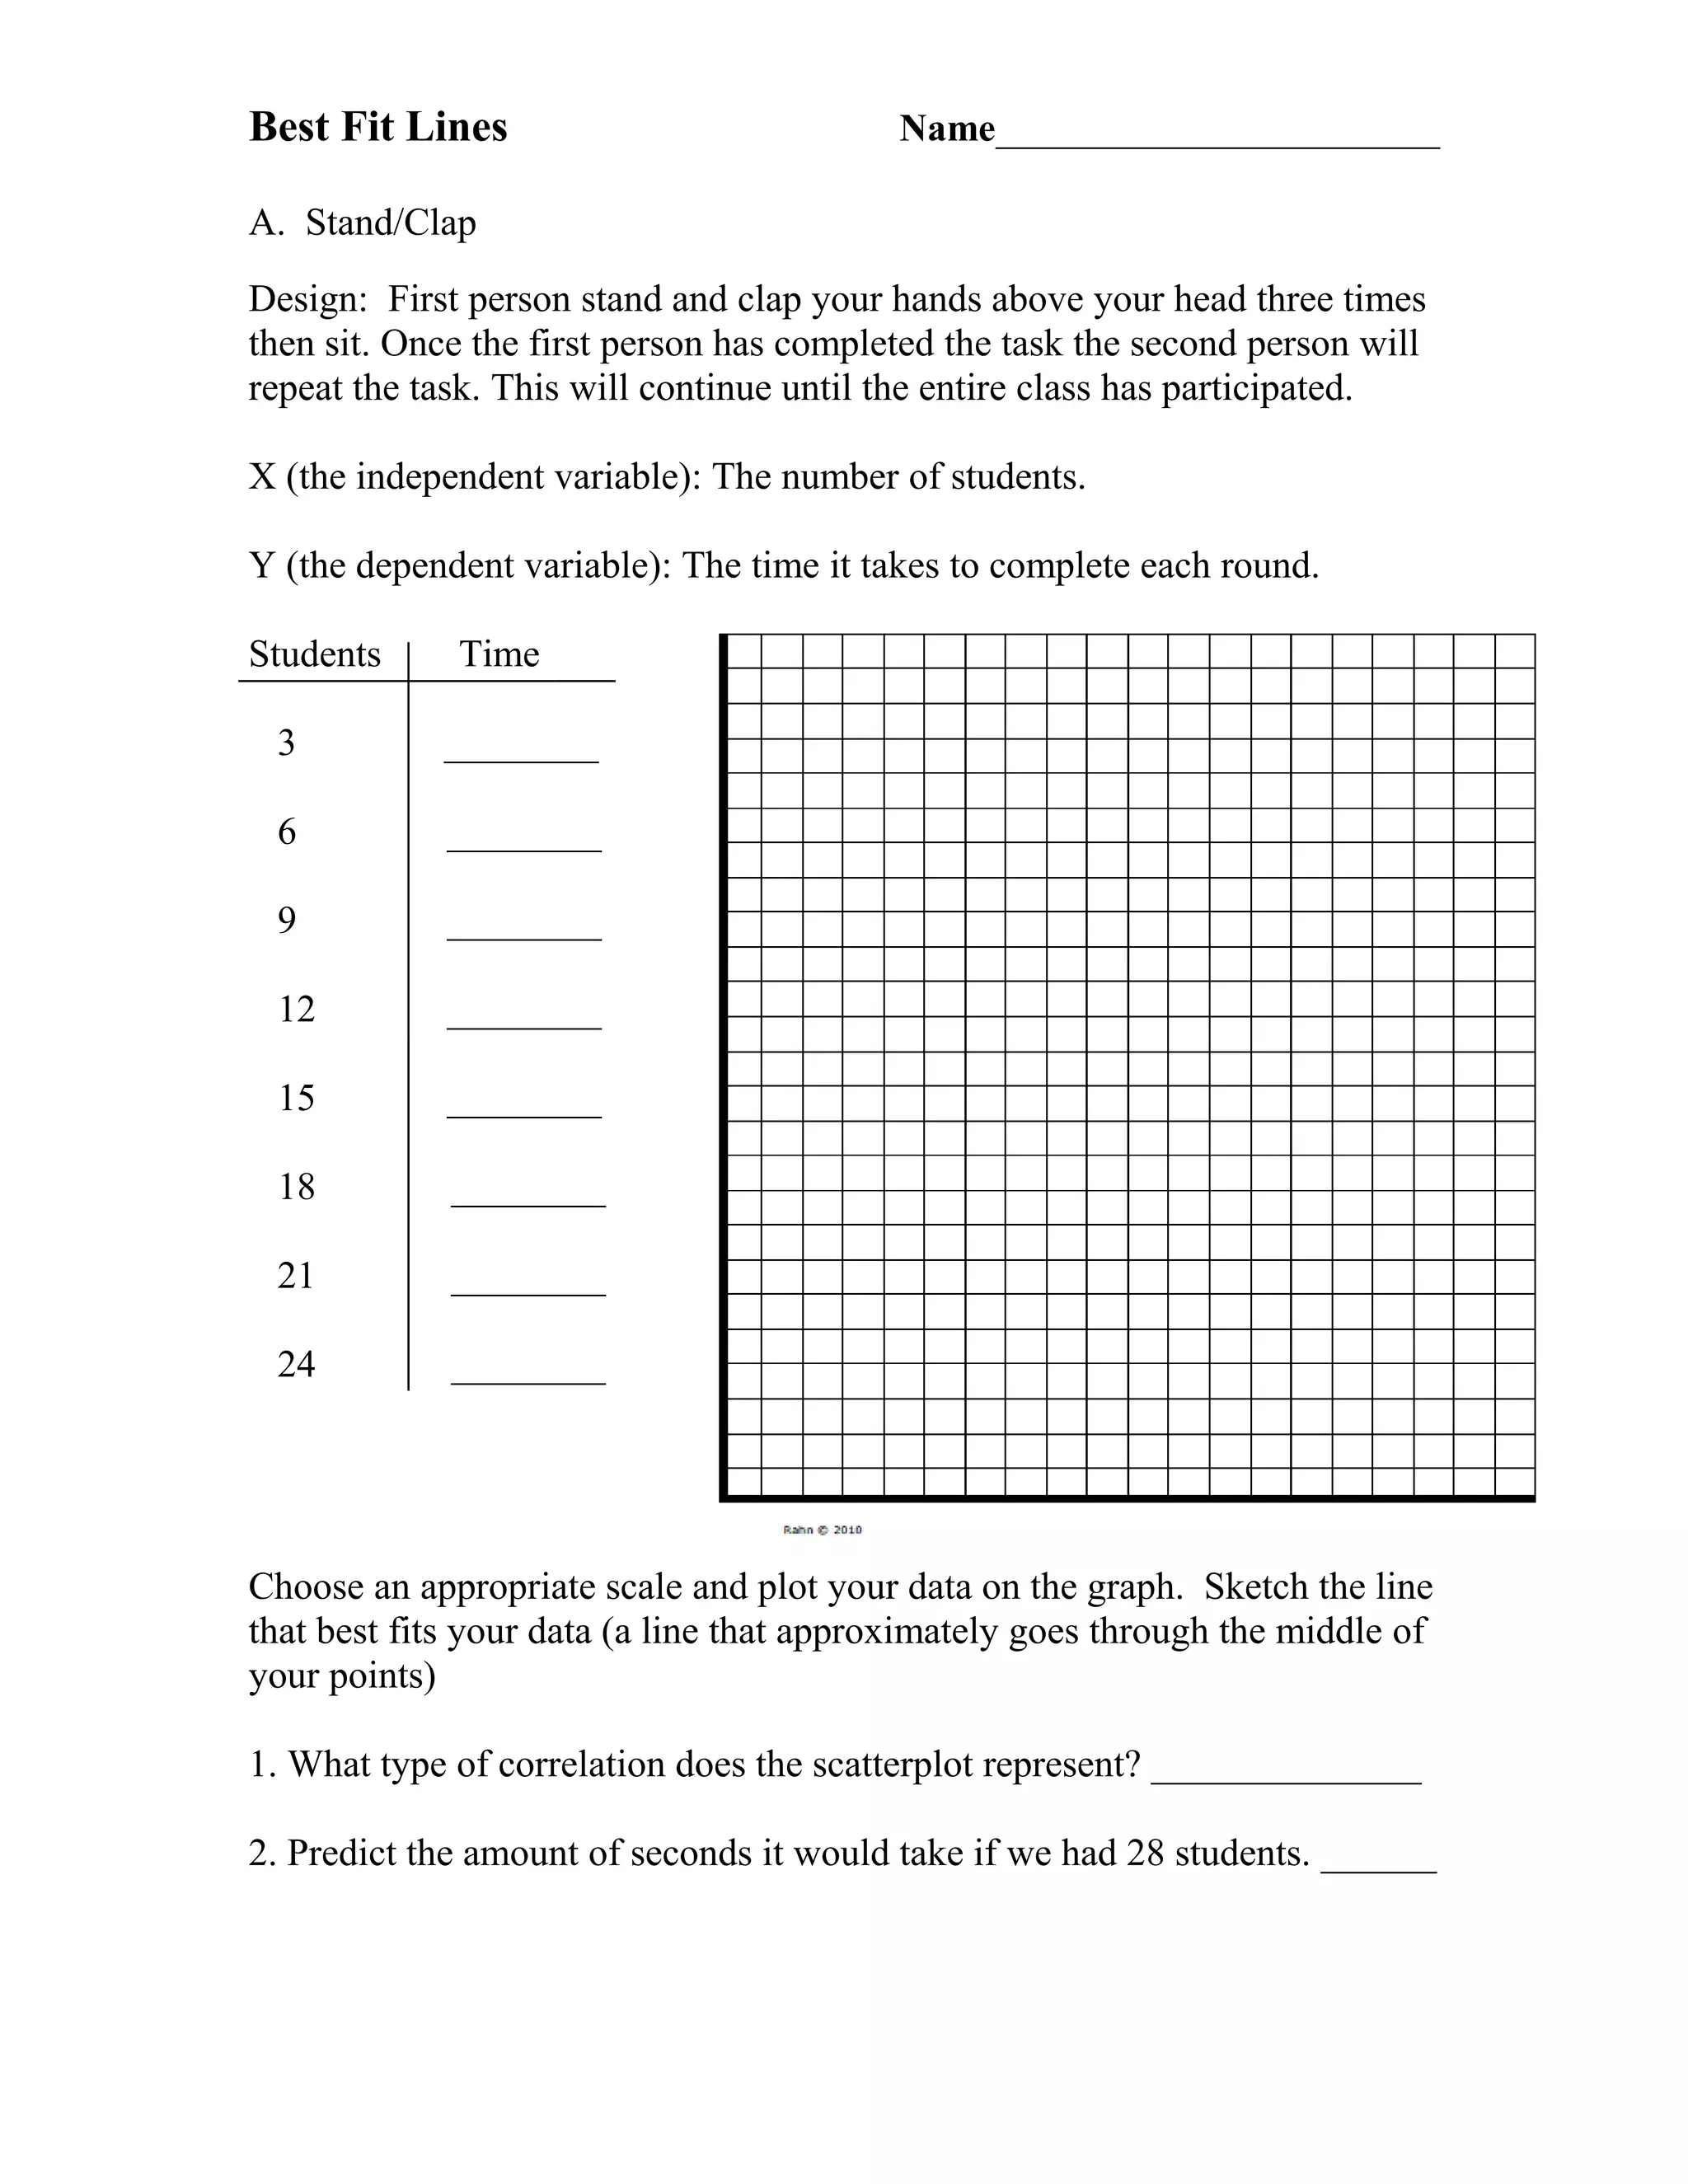

This document contains instructions for an experiment to measure the time it takes for a varying number of students to complete a task of standing, clapping, and sitting. Students will take turns performing the task until all have participated, and the time to complete each round will be recorded. The number of students is the independent variable and time is the dependent variable. Data for groups of 3 to 24 students will be plotted on a graph and the best fit line drawn to analyze the correlation between more students and longer completion times.


