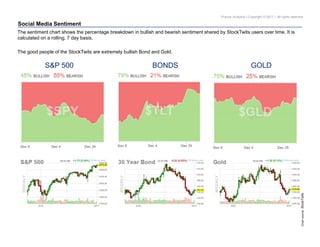
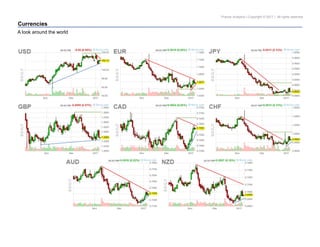
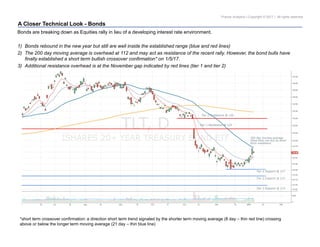
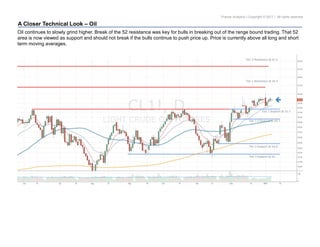
Pravda
Analytics
Pravda
Analytics
Pravda Markets Report
Technicals Monthly
January 2017 Edition
Pravda Analytics | Copyright © 2017 | All rights reserved
Market Index Overview
S&P 500 (SPY) index – as of close on Friday 1/6/17
Markets continue to consolidate near highs as we enter the new year. See additional notes below:
Don’t forget the big picture and
observe the monthly chart
Pravda Analytics | Copyright © 2017 | All rights reserved
Market Direction Confirmation via Transports Sector Observation as per Dow Theory
Key premise of the theory states that both
the broad equity market index as well as
the transports index need to align in
market direction to confirm a bullish or
bearish trend. (additional rules apply)
Dow theory
Market Direction: Bullish
 Dow Jones Industrial Average (DIA) is
above key moving averages.
 Dow Jones Transports Average (IYT) is
above key moving averages.
Current Analysis
A confirmed bullish market is when:
 Both indexes are exhibiting higher price
peaks and valleys on long term charts
 Both indexes are above their respective
200 day moving average (orange)
 Additional level of confirmation: index
above 50 day moving average (blue)
The Approach
Dow Jones Index Transports Index
Transports and the Dow are holding strong above both key moving averages indicating a Bullish environment.
Pravda Analytics | Copyright © 2017 | All rights reserved
Inverse Put Call Ratio
A unique oscillating indicator based on options activity coupled with a Bollinger Band to view overextended signals.
Options activity is neutral as the put-call ratio is close to 1 and in the middle if the range.
Pravda Analytics | Copyright © 2017 | All rights reserved
Social Media Sentiment
Chartsource:StockTwits
S&P 500 BONDS GOLD
The sentiment chart shows the percentage breakdown in bullish and bearish sentiment shared by StockTwits users over time. It is
calculated on a rolling, 7 day basis.
The good people of the StockTwits are extremely bullish Bond and Gold.
Pravda Analytics | Copyright © 2017 | All rights reserved
Currencies
A look around the world
Pravda Analytics | Copyright © 2017 | All rights reserved
A Closer Technical Look - Bonds
Bonds are breaking down as Equities rally in lieu of a developing interest rate environment.
1) Bonds rebound in the new year but still are well inside the established range (blue and red lines)
2) The 200 day moving average is overhead at 112 and may act as resistance of the recent rally. However, the bond bulls have
finally established a short term bullish crossover confirmation* on 1/5/17.
3) Additional resistance overhead is at the November gap indicated by red lines (tier 1 and tier 2)
*short term crossover confirmation: a direction short term trend signaled by the shorter term moving average (8 day – thin red line) crossing
above or below the longer term moving average (21 day – thin blue line)
Pravda Analytics | Copyright © 2017 | All rights reserved
A Closer Technical Look – Oil
Oil continues to slowly grind higher. Break of the 52 resistance was key for bulls in breaking out of the range bound trading. That 52
area is now viewed as support and should not break if the bulls continue to push price up. Price is currently above all long and short
term moving averages.
Pravda Analytics | Copyright © 2017 | All rights reserved
A Closer Technical Look - Gold
Gold continues to correlate with the bond market and similarly underwent a sharp recovery since mid December lows.
1. Some heavy resistance is ahead as gold moves closer to a declining 200 day moving average (blue line).
2. A bullish short term crossover confirmation* is forming after the gap up to 112.5 level (blue arrow) in the first week of the year.
3. Overall gold is still shuffling between some key moving averages.
4. Special attention is to be paid to overhead resistance like the 200 day moving average (blue line) and the red tier 1 resistance
line at 115.3.
*short term crossover confirmation: a direction short term trend signaled by the shorter term moving average (8 day – thin red line) crossing
above or below the longer term moving average (21 day – thin blue line)
Note: below is the GLD gold ETF chart as opposed to the /GC gold futures contract which is a x10 price multiple.
Pravda Analytics | Copyright © 2017 | All rights reserved
Hook of death
https://fred.stlouisfed.org
10-Year Treasury Constant Maturity Minus 3-Month Treasury Constant Maturity.
Inverted yield curve often precedes a major market decline. So far so good.
Pravda Analytics | Copyright © 2017 | All rights reserved
Rate Watch
Chartsource:cmegroup
 Fed Funds Rate @ 0.75: market projects a 97% chance that there will not be a rate hike in February
 Prime Rate @ 3.75: a quarter percent move up from a year ago
 FOMC’s Rate Projection from the Dot Plot: currently projecting 2017 @ 1.50 % and 2018 @ 2.00%
Pravda Analytics | Copyright © 2017 | All rights reserved
Sector Analysis: year to date performance
Outperformers: Health Care and Consumer Discretionary
Underperformers: Utilities and Energy
Pravda Analytics | Copyright © 2017 | All rights reserved
Stock Averages
Number of Stocks Above 20-Day Moving Average
The market is in a neutral state with a near 50/50 split of stock trending up and down.
Pravda Analytics | Copyright © 2017 | All rights reserved
Economic Calendar
http://www.bloomberg.com/markets/economic-calendar/
http://www.marketwatch.com/Economy-Politics/Calendars/Economic
Nonfarm payrolls rose a lower-than-expected 156,000 in December but revisions added a net 19,000 to the two prior months.
The issue is another 0.4 percent rise in average hourly earnings for the second time in three months. The year-on-year rate is now at
2.9 percent which is a cycle high. A 3 percent rate and above is widely seen as feeding overall inflation.
The unemployment rate is very low though it did tick up 1 tenth to 4.7 percent. Keeping the rate down is low labor participation, at
62.7 percent with the prior month revised down 1 tenth to 62.6 percent.
Pravda Analytics | Copyright © 2017 | All rights reserved
Headlines of the week
Notable covers and headlines from world’s most read publications
As Princeton economist Paul Krugman wryly noted, "Whom the Gods would destroy, they first put on the cover of Business Week."
Pravda Analytics | Copyright © 2017 | All rights reserved
Personal Finance - The Richest Man in Babylon
Make thy gold
multiply
Make of thy
dwelling a
profitable
investment
Guard thy
treasures from
loss
Seven Cures for a
Lean Purse
Start thy purse
to fattening
Control thy
expenditures
Increase thy
ability to earn
Insure a future
income
Goddess of Good Luck smiles upon those who
work hard, save their money, and invest well.
She doesn't really patronize professional
gamblers, who always seem to end up poor
Meet the Goddess of Good Luck Five Laws of Gold (Money)
• Mentors, Books
• Seminars, ExperienceLearn
• Business, Investment
• Knowledge, Attitude, SkillsMaster
Pay
• Yourself first
• Save 10% of earnings
Invest
• Business
• Real estate
• Stocks
• Scams
• Trickeries
• Get rich schemes
Avoid
The Richest Man in Babylon is a book by George S. Clason which dispenses financial advice through a
collection of parables. Through their experiences in business and managing personal finance, the
characters in the parables learn simple lessons in financial wisdom.
Pravda Analytics | Copyright © 2017 | All rights reserved
Investing & Trading Blueprint
http://www.investors.com
IBD's 10 Secrets to Success – great blueprint to improve your trading, investing, as well as every day
activities and personal goals:
Pravda
Analytics
Pravda
Analytics

Pravda analytics technical monthly review for january 2017

  • 1.
  • 2.
    Pravda Analytics |Copyright © 2017 | All rights reserved Market Index Overview S&P 500 (SPY) index – as of close on Friday 1/6/17 Markets continue to consolidate near highs as we enter the new year. See additional notes below: Don’t forget the big picture and observe the monthly chart
  • 3.
    Pravda Analytics |Copyright © 2017 | All rights reserved Market Direction Confirmation via Transports Sector Observation as per Dow Theory Key premise of the theory states that both the broad equity market index as well as the transports index need to align in market direction to confirm a bullish or bearish trend. (additional rules apply) Dow theory Market Direction: Bullish  Dow Jones Industrial Average (DIA) is above key moving averages.  Dow Jones Transports Average (IYT) is above key moving averages. Current Analysis A confirmed bullish market is when:  Both indexes are exhibiting higher price peaks and valleys on long term charts  Both indexes are above their respective 200 day moving average (orange)  Additional level of confirmation: index above 50 day moving average (blue) The Approach Dow Jones Index Transports Index Transports and the Dow are holding strong above both key moving averages indicating a Bullish environment.
  • 4.
    Pravda Analytics |Copyright © 2017 | All rights reserved Inverse Put Call Ratio A unique oscillating indicator based on options activity coupled with a Bollinger Band to view overextended signals. Options activity is neutral as the put-call ratio is close to 1 and in the middle if the range.
  • 5.
    Pravda Analytics |Copyright © 2017 | All rights reserved Social Media Sentiment Chartsource:StockTwits S&P 500 BONDS GOLD The sentiment chart shows the percentage breakdown in bullish and bearish sentiment shared by StockTwits users over time. It is calculated on a rolling, 7 day basis. The good people of the StockTwits are extremely bullish Bond and Gold.
  • 6.
    Pravda Analytics |Copyright © 2017 | All rights reserved Currencies A look around the world
  • 7.
    Pravda Analytics |Copyright © 2017 | All rights reserved A Closer Technical Look - Bonds Bonds are breaking down as Equities rally in lieu of a developing interest rate environment. 1) Bonds rebound in the new year but still are well inside the established range (blue and red lines) 2) The 200 day moving average is overhead at 112 and may act as resistance of the recent rally. However, the bond bulls have finally established a short term bullish crossover confirmation* on 1/5/17. 3) Additional resistance overhead is at the November gap indicated by red lines (tier 1 and tier 2) *short term crossover confirmation: a direction short term trend signaled by the shorter term moving average (8 day – thin red line) crossing above or below the longer term moving average (21 day – thin blue line)
  • 8.
    Pravda Analytics |Copyright © 2017 | All rights reserved A Closer Technical Look – Oil Oil continues to slowly grind higher. Break of the 52 resistance was key for bulls in breaking out of the range bound trading. That 52 area is now viewed as support and should not break if the bulls continue to push price up. Price is currently above all long and short term moving averages.
  • 9.
    Pravda Analytics |Copyright © 2017 | All rights reserved A Closer Technical Look - Gold Gold continues to correlate with the bond market and similarly underwent a sharp recovery since mid December lows. 1. Some heavy resistance is ahead as gold moves closer to a declining 200 day moving average (blue line). 2. A bullish short term crossover confirmation* is forming after the gap up to 112.5 level (blue arrow) in the first week of the year. 3. Overall gold is still shuffling between some key moving averages. 4. Special attention is to be paid to overhead resistance like the 200 day moving average (blue line) and the red tier 1 resistance line at 115.3. *short term crossover confirmation: a direction short term trend signaled by the shorter term moving average (8 day – thin red line) crossing above or below the longer term moving average (21 day – thin blue line) Note: below is the GLD gold ETF chart as opposed to the /GC gold futures contract which is a x10 price multiple.
  • 10.
    Pravda Analytics |Copyright © 2017 | All rights reserved Hook of death https://fred.stlouisfed.org 10-Year Treasury Constant Maturity Minus 3-Month Treasury Constant Maturity. Inverted yield curve often precedes a major market decline. So far so good.
  • 11.
    Pravda Analytics |Copyright © 2017 | All rights reserved Rate Watch Chartsource:cmegroup  Fed Funds Rate @ 0.75: market projects a 97% chance that there will not be a rate hike in February  Prime Rate @ 3.75: a quarter percent move up from a year ago  FOMC’s Rate Projection from the Dot Plot: currently projecting 2017 @ 1.50 % and 2018 @ 2.00%
  • 12.
    Pravda Analytics |Copyright © 2017 | All rights reserved Sector Analysis: year to date performance Outperformers: Health Care and Consumer Discretionary Underperformers: Utilities and Energy
  • 13.
    Pravda Analytics |Copyright © 2017 | All rights reserved Stock Averages Number of Stocks Above 20-Day Moving Average The market is in a neutral state with a near 50/50 split of stock trending up and down.
  • 14.
    Pravda Analytics |Copyright © 2017 | All rights reserved Economic Calendar http://www.bloomberg.com/markets/economic-calendar/ http://www.marketwatch.com/Economy-Politics/Calendars/Economic Nonfarm payrolls rose a lower-than-expected 156,000 in December but revisions added a net 19,000 to the two prior months. The issue is another 0.4 percent rise in average hourly earnings for the second time in three months. The year-on-year rate is now at 2.9 percent which is a cycle high. A 3 percent rate and above is widely seen as feeding overall inflation. The unemployment rate is very low though it did tick up 1 tenth to 4.7 percent. Keeping the rate down is low labor participation, at 62.7 percent with the prior month revised down 1 tenth to 62.6 percent.
  • 15.
    Pravda Analytics |Copyright © 2017 | All rights reserved Headlines of the week Notable covers and headlines from world’s most read publications As Princeton economist Paul Krugman wryly noted, "Whom the Gods would destroy, they first put on the cover of Business Week."
  • 16.
    Pravda Analytics |Copyright © 2017 | All rights reserved Personal Finance - The Richest Man in Babylon Make thy gold multiply Make of thy dwelling a profitable investment Guard thy treasures from loss Seven Cures for a Lean Purse Start thy purse to fattening Control thy expenditures Increase thy ability to earn Insure a future income Goddess of Good Luck smiles upon those who work hard, save their money, and invest well. She doesn't really patronize professional gamblers, who always seem to end up poor Meet the Goddess of Good Luck Five Laws of Gold (Money) • Mentors, Books • Seminars, ExperienceLearn • Business, Investment • Knowledge, Attitude, SkillsMaster Pay • Yourself first • Save 10% of earnings Invest • Business • Real estate • Stocks • Scams • Trickeries • Get rich schemes Avoid The Richest Man in Babylon is a book by George S. Clason which dispenses financial advice through a collection of parables. Through their experiences in business and managing personal finance, the characters in the parables learn simple lessons in financial wisdom.
  • 17.
    Pravda Analytics |Copyright © 2017 | All rights reserved Investing & Trading Blueprint http://www.investors.com IBD's 10 Secrets to Success – great blueprint to improve your trading, investing, as well as every day activities and personal goals:
  • 18.