- Stocks ended 2013 strongly but started 2014 weakly, dropping on the first trading day. However, one day trends do not determine the year's direction.
- The 10-year Treasury yield rose above 3% for the first time since 2011 but higher rates have not negatively impacted stocks so far.
- Gold rebounded sharply against the normal pattern of declining with higher rates, which may indicate anticipation of future inflation.
- Chinese and emerging market stocks declined on weak economic data, raising concerns about the health of the global recovery.
« Market Perspectives » est notre revue mensuelle des marchés. Elle présente de la façon la plus synthétique possible :
- notre analyse des principaux faits marquants et indicateurs macro susceptibles de dessiner les marchés sur le mois.
- notre vision sur les différentes classes d’actifs
Cette revue sera continument enrichie avec nos indicateurs quantitatifs.
La plupart de nos analyses sont disponibles sur www.finlightresearch.com
Our monthly publication “Market Perspectives” presents a synthetic view of all the asset classes we cover.
The report is composed of six sections covering Macro, Equities, FI & credit, FX, Commodities and Alternatives.
Each section is preceded by a summary of our views on the related asset class.
Most of our publications are available on our web site www.finlightresearch.com
The MNI Russia Consumer Indicator fell sharply in November, led by a steep decline in respondents’ willingness to purchase a large household item and their expectations for future business conditions.
The rise in bond yields in developed economies in the past 6 weeks remains one of the over-riding themes as we head into the last seven days of the US presidential campaigns.
Markets are now fretting about the implications for global growth and asset valuations and ultimately whether elevated global risk appetite will correct more forcefully.
Higher international commodity prices, a pick-up in global GDP growth in Q3 and early Q4 and easing deflation fears suggest that interest rate policies in developed economies may have reached an important inflexion point – in line with the view I expressed six weeks ago.
Developed central banks may refrain from loosening monetary policy further near-term, with the exception of the RBNZ and possibly ECB. At the very least, policy-makers will tweak a discourse which has largely focused on doing “whatever it takes”.
Recent US data have paved the paved the way for a 14th December Fed hike, conditional on Democrat candidate Hilary Clinton wining the 8th November US presidential elections.
But with the exception of the Fed and possibly a handful of EM central banks, rate hikes are a story for the latter part of 2017 (perhaps) while further rate cuts remain on the cards in Brazil, Russia, Indonesia and India.
Higher global yields and still uncertain US election outcome are taming global equities and volatility has spiked but EM currencies have still managed to eek out modest gains.
Assuming Hilary Clinton wins next week, I would expect the initial reaction to be a rally in global equities, EM currencies and Dollar and an underperformance of safe-haven assets.
But I would also expect market pricing for a December Fed hike to rise a little further, which could in turn eventually curtail any rally in global equities and EM currencies.
In this scenario, the Dollar would likely end the year stronger, as per my January forecast of a third consecutive year of albeit more modest Dollar gains.
Whether global risk appetite avoids its early 2016 fate will depend on the interconnected factors of underlying macro data and the Fed’s credibility. In any case, market volatility could spike in the run-up to March 2017.
The self-reinforcing sell-off in Sterling and UK bonds has only very recently abated, with markets seemingly taken some comfort from a number of factors including the only modest slowdown in UK GDP growth to 0.5% qoq in Q3.
But optimism over UK GDP data is not warranted as growth has become more unbalanced and slowed in August-September despite a significant easing in UK monetary policy.
Olivier DEsbarres: What to expect in 2016 – same, same, but worseOlivier Desbarres
It is clear that markets so far this year are trading on sentiment, more specifically fear, with hard-data playing second fiddle. Or more accurately, price action suggests that markets are focusing on disappointing December numbers (e.g. US ISM) or even reasonably uneventful data (Chinese manufacturing PMI) and ignoring strong data such as U.S non-farm payrolls, Chinese services PMI and exports (see Figure 1). The hit-and-miss approach of Chinese policy-makers to stabilise equity markets (and ultimately growth) have done little to restore confidence. I nevertheless flag in Figure 37 some of the key data and events to focus on this year.
London, 22 November 2013 MNI RUSSIA BUSINESS SENTIMENT EMBARGOED UNTIL 9.45 A.M. MOSCOW TIME. MNI Russia Business Indicator Falls to 51.5 In November from 56.3 in October. Future Expectations Hit A New Low. The MNI Russia Business Indicator declined for the second consecutive month, while expectations for the future hit their lowest level since the series began in March.
LBS Asset Allocation August Update - July 28, 2017Mark MacIsaac
Global economic data continue to point to robust and synchronized economic growth with the release of stronger-than-expected ISM surveys, German IFO business climate survey and Chinese Q2 real GDP growth data.
Tier one data key with dollar strength setting up again Hantec Markets
A clutch of tier one data will enable traders to take a view on the path of US rate cuts for the remainder of the year. The US dollar remains a key outperformer of the major currencies and we consider the impact across forex, equities and commodities. We also look into key Brexit developments.
Politics and major central banks are key this week Richard Perry
Politics and central bank is high on the agenda this week as markets continue to react to protectionist moves from Donald Trump, the Italian election over the weekend and look forward to four major central banks announcing their latest monetary policy decisions. We consider the outlook for forex, equities and commodities markets in the coming days.
2011 promises to be the year of commodities. Every global event in the last three
years has either been triggered by commodities or has, in a roundabout way, led to
increased influence of commodity prices on the macro-economic environment.
The recent events in Egypt are a case in point. Even in the ongoing currency wars,
commodity currencies like the Australian Dollar and Brazilian Real have shown genuine
muscle and there is nothing on the horizon to show that the trend is changing.
« Market Perspectives » est notre revue mensuelle des marchés. Elle présente de la façon la plus synthétique possible :
- notre analyse des principaux faits marquants et indicateurs macro susceptibles de dessiner les marchés sur le mois.
- notre vision sur les différentes classes d’actifs
Cette revue sera continument enrichie avec nos indicateurs quantitatifs.
La plupart de nos analyses sont disponibles sur www.finlightresearch.com
Our monthly publication “Market Perspectives” presents a synthetic view of all the asset classes we cover.
The report is composed of six sections covering Macro, Equities, FI & credit, FX, Commodities and Alternatives.
Each section is preceded by a summary of our views on the related asset class.
Most of our publications are available on our web site www.finlightresearch.com
Edulight is a skill Training and Education company which has multiple courses in ICT, Banking, Accounts and various other job-driven courses to be offered to students who are aiming at their first job immediately after completion of their graduation. Edulight has a specific focus on Rural markets and believes that the true growth of India can emerge only if the rural markets become self-sustaining. We are the bridge between rural India and modern skills-based courses to be offered in rural India. We undertake skilling projects and work towards the last mile of providing these skilled resources with jobs in their local area.
On the Education space, Edulight is a leading player in the Distance Education realm and provides MBA courses for working professionals. These are formal education courses and degrees are awarded by government recognized universities. As we speak more than 3500 students have been a part of our formal education division.
Edulight also has a corporate training division which focuses on reskilling and upskilling the existing workforce of leading companies. We focus on training them on IT subjects, Behavioral training, and a host of functional training programs. We are an array of clients who trust our ability to enhance the productivity of their workforce through our structured corporate training programs.
We have a unique 360* Delivery model wherein we have introduced blending learning in a unique and special manner thus augmenting the learning process of our students and making them more job enabled and execution focused. Our students are Operationally ready thus making their job probability very high whilst ensuring better productivity from day one on the job. Our Delivery strategy is to make freshers as good as 1 year experienced candidate in terms of their output through our innovative methodology of teaching and intense focus on practice and placements. In simple words, we specifically cater to those who come to us to get prepared for their first job. We also engage with companies for their staff reskilling needs at various advanced levels.
The investment duo of Mark and Michele bravely tackle the popular Investment Myths head on.
Need to know if a trading myth is true or false? Call the Investment Mythbusters! Inspired by the popular TV series with a surprisingly similar name, Vunani Private Clients' Investment Managers Mark Weetman and Michele Santangelo have devoted themselves to combining elements of science, statistics, investment theory and some good old-fashioned luck to determine if popular investment beliefs are true or false.
Join the Vunani Private Clients’ team on the 21st May 2014 when they expose financial myths to their intensive analysis. No financial scuttle bug is safe when these professionals are around. Any bar room stock tips, trading strategy or Investment advice that you need testing, give these guys a call – or at least drop an email!
So join our trading team, who will be either busting or confirming some popular investment myths, including:
• Sell in May - like the soothsayer famously warned Julius Caesar, you need to “beware the Ides of March”, sorry that should have been the Ides of “May” with the sell in May myth.
• As Goes January, So Goes The Year!
• What has happened to Doctor Copper?
• Whether the Santa Clause rally will bring you the financial present you want, or will the Grinch will once again steal Xmas
And then they will show you how to trade them!
US inflation in focus with bond markets increasingly keyHantec Markets
There has been a significant shift in the outlook on bond markets and this is impacting across asset classes. How this plays out in the coming days could be key for the medium term outlook. Focus is on US inflation data this week. We consider the outlook on forex, equities and commodities markets.
Could a turnaround last the distance for major markets? Hantec Markets
After a tumultuous period of trading on financial markets is a turning point about to be seen? If so, how long can it last? We consider the outlook for forex, equities and commodities in the coming days.
Market fears remain, Brexit in focus stillHantec Markets
As markets have been gripped by increased fear we consider the outlook on forex, equities and commodities this week. We also look at the latest developments in Brexit.
« Market Perspectives » est notre revue mensuelle des marchés. Elle présente de la façon la plus synthétique possible :
- notre analyse des principaux faits marquants et indicateurs macro susceptibles de dessiner les marchés sur le mois.
- notre vision sur les différentes classes d’actifs
Cette revue sera continument enrichie avec nos indicateurs quantitatifs.
La plupart de nos analyses sont disponibles sur www.finlightresearch.com
Our monthly publication “Market Perspectives” presents a synthetic view of all the asset classes we cover.
The report is composed of six sections covering Macro, Equities, FI & credit, FX, Commodities and Alternatives.
Each section is preceded by a summary of our views on the related asset class.
Most of our publications are available on our web site www.finlightresearch.com
Non-farm Payrolls, tariffs and geopolitics to impact this weekHantec Markets
The first week of the month is always dense with tier one data for the major markets to ponder, with PMIs and Non-farm Payrolls set to feature highly. However, add in the geopolitical tensions of trade tariffs and the migrant issue across the EU and there is a raft of factors set to impact. We consider the outlook for forex, equities and commodities markets this week.
Escalation of the trade dispute remains key this weekHantec Markets
With Donald Trump continuing to escalate his protectionist rhetoric in the trade dispute with China, the geopolitical risks remain paramount for traders this week. How does this impact on the US dollar and emerging markets? We look at the impact on forex majors, equities and commodities markets in the coming days.
Lattice Energy LLC-Larsen Memo re Stock Indexes vs Gold Price Ratios-August 1...Lewis Larsen
Memo prompted by anomalies in price of Gold versus price of stocks (DJIA/Gold ratio) that occurred in August 2011. Quoting: “Gold is not presently expensive because of a soon-to-be rapid acceleration in overall rate of inflation. In my view, that scenario is very unlikely, especially given the reduction in government fiscal stimulus now starting in the U.S. and Europe. Recent behavior of U.S. Treasury securities supports that notion --- yields on the long-end of the debt markets (which Fed has very little direct control over) have actually gone down significantly since the latest market break began. As of mid-session this morning, the 30-year US Treasury bond was being priced to yield 3.53%; if a pending inflationary surge were the underlying factor spooking today’s equity markets, long bond yields would be going up not down. Three-month T-bill rates are within a rounding-error of zero %; no hints of inflationary pressures there either. The fact is that the U.S. economy is still quite weak and there is little demand for short-term credit --- U.S. consumers aren't in good enough financial shape to help run-up hard asset prices and create inflationary pressures.”
how can I sell pi coins after successfully completing KYCDOT TECH
Pi coins is not launched yet in any exchange 💱 this means it's not swappable, the current pi displaying on coin market cap is the iou version of pi. And you can learn all about that on my previous post.
RIGHT NOW THE ONLY WAY you can sell pi coins is through verified pi merchants. A pi merchant is someone who buys pi coins and resell them to exchanges and crypto whales. Looking forward to hold massive quantities of pi coins before the mainnet launch.
This is because pi network is not doing any pre-sale or ico offerings, the only way to get my coins is from buying from miners. So a merchant facilitates the transactions between the miners and these exchanges holding pi.
I and my friends has sold more than 6000 pi coins successfully with this method. I will be happy to share the contact of my personal pi merchant. The one i trade with, if you have your own merchant you can trade with them. For those who are new.
Message: @Pi_vendor_247 on telegram.
I wouldn't advise you selling all percentage of the pi coins. Leave at least a before so its a win win during open mainnet. Have a nice day pioneers ♥️
#kyc #mainnet #picoins #pi #sellpi #piwallet
#pinetwork
what is the best method to sell pi coins in 2024DOT TECH
The best way to sell your pi coins safely is trading with an exchange..but since pi is not launched in any exchange, and second option is through a VERIFIED pi merchant.
Who is a pi merchant?
A pi merchant is someone who buys pi coins from miners and pioneers and resell them to Investors looking forward to hold massive amounts before mainnet launch in 2026.
I will leave the telegram contact of my personal pi merchant to trade pi coins with.
@Pi_vendor_247
Seminar: Gender Board Diversity through Ownership NetworksGRAPE
Seminar on gender diversity spillovers through ownership networks at FAME|GRAPE. Presenting novel research. Studies in economics and management using econometrics methods.
What price will pi network be listed on exchangesDOT TECH
The rate at which pi will be listed is practically unknown. But due to speculations surrounding it the predicted rate is tends to be from 30$ — 50$.
So if you are interested in selling your pi network coins at a high rate tho. Or you can't wait till the mainnet launch in 2026. You can easily trade your pi coins with a merchant.
A merchant is someone who buys pi coins from miners and resell them to Investors looking forward to hold massive quantities till mainnet launch.
I will leave the telegram contact of my personal pi vendor to trade with.
@Pi_vendor_247
USDA Loans in California: A Comprehensive Overview.pptxmarketing367770
USDA Loans in California: A Comprehensive Overview
If you're dreaming of owning a home in California's rural or suburban areas, a USDA loan might be the perfect solution. The U.S. Department of Agriculture (USDA) offers these loans to help low-to-moderate-income individuals and families achieve homeownership.
Key Features of USDA Loans:
Zero Down Payment: USDA loans require no down payment, making homeownership more accessible.
Competitive Interest Rates: These loans often come with lower interest rates compared to conventional loans.
Flexible Credit Requirements: USDA loans have more lenient credit score requirements, helping those with less-than-perfect credit.
Guaranteed Loan Program: The USDA guarantees a portion of the loan, reducing risk for lenders and expanding borrowing options.
Eligibility Criteria:
Location: The property must be located in a USDA-designated rural or suburban area. Many areas in California qualify.
Income Limits: Applicants must meet income guidelines, which vary by region and household size.
Primary Residence: The home must be used as the borrower's primary residence.
Application Process:
Find a USDA-Approved Lender: Not all lenders offer USDA loans, so it's essential to choose one approved by the USDA.
Pre-Qualification: Determine your eligibility and the amount you can borrow.
Property Search: Look for properties in eligible rural or suburban areas.
Loan Application: Submit your application, including financial and personal information.
Processing and Approval: The lender and USDA will review your application. If approved, you can proceed to closing.
USDA loans are an excellent option for those looking to buy a home in California's rural and suburban areas. With no down payment and flexible requirements, these loans make homeownership more attainable for many families. Explore your eligibility today and take the first step toward owning your dream home.
how to sell pi coins in South Korea profitably.DOT TECH
Yes. You can sell your pi network coins in South Korea or any other country, by finding a verified pi merchant
What is a verified pi merchant?
Since pi network is not launched yet on any exchange, the only way you can sell pi coins is by selling to a verified pi merchant, and this is because pi network is not launched yet on any exchange and no pre-sale or ico offerings Is done on pi.
Since there is no pre-sale, the only way exchanges can get pi is by buying from miners. So a pi merchant facilitates these transactions by acting as a bridge for both transactions.
How can i find a pi vendor/merchant?
Well for those who haven't traded with a pi merchant or who don't already have one. I will leave the telegram id of my personal pi merchant who i trade pi with.
Tele gram: @Pi_vendor_247
#pi #sell #nigeria #pinetwork #picoins #sellpi #Nigerian #tradepi #pinetworkcoins #sellmypi
BYD SWOT Analysis and In-Depth Insights 2024.pptxmikemetalprod
Indepth analysis of the BYD 2024
BYD (Build Your Dreams) is a Chinese automaker and battery manufacturer that has snowballed over the past two decades to become a significant player in electric vehicles and global clean energy technology.
This SWOT analysis examines BYD's strengths, weaknesses, opportunities, and threats as it competes in the fast-changing automotive and energy storage industries.
Founded in 1995 and headquartered in Shenzhen, BYD started as a battery company before expanding into automobiles in the early 2000s.
Initially manufacturing gasoline-powered vehicles, BYD focused on plug-in hybrid and fully electric vehicles, leveraging its expertise in battery technology.
Today, BYD is the world’s largest electric vehicle manufacturer, delivering over 1.2 million electric cars globally. The company also produces electric buses, trucks, forklifts, and rail transit.
On the energy side, BYD is a major supplier of rechargeable batteries for cell phones, laptops, electric vehicles, and energy storage systems.
when will pi network coin be available on crypto exchange.DOT TECH
There is no set date for when Pi coins will enter the market.
However, the developers are working hard to get them released as soon as possible.
Once they are available, users will be able to exchange other cryptocurrencies for Pi coins on designated exchanges.
But for now the only way to sell your pi coins is through verified pi vendor.
Here is the telegram contact of my personal pi vendor
@Pi_vendor_247
Lecture slide titled Fraud Risk Mitigation, Webinar Lecture Delivered at the Society for West African Internal Audit Practitioners (SWAIAP) on Wednesday, November 8, 2023.
Abhay Bhutada Leads Poonawalla Fincorp To Record Low NPA And Unprecedented Gr...Vighnesh Shashtri
Under the leadership of Abhay Bhutada, Poonawalla Fincorp has achieved record-low Non-Performing Assets (NPA) and witnessed unprecedented growth. Bhutada's strategic vision and effective management have significantly enhanced the company's financial health, showcasing a robust performance in the financial sector. This achievement underscores the company's resilience and ability to thrive in a competitive market, setting a new benchmark for operational excellence in the industry.
The Evolution of Non-Banking Financial Companies (NBFCs) in India: Challenges...beulahfernandes8
Role in Financial System
NBFCs are critical in bridging the financial inclusion gap.
They provide specialized financial services that cater to segments often neglected by traditional banks.
Economic Impact
NBFCs contribute significantly to India's GDP.
They support sectors like micro, small, and medium enterprises (MSMEs), housing finance, and personal loans.
The Evolution of Non-Banking Financial Companies (NBFCs) in India: Challenges...
Markets limp into 2014
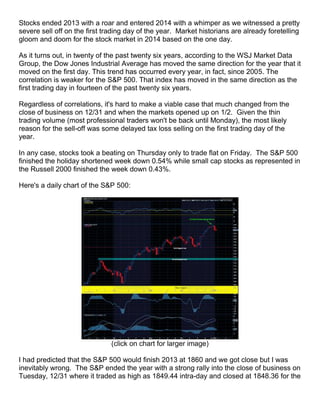
1. Stocks ended 2013 with a roar and entered 2014 with a whimper as we witnessed a pretty
severe sell off on the first trading day of the year. Market historians are already foretelling
gloom and doom for the stock market in 2014 based on the one day.
As it turns out, in twenty of the past twenty six years, according to the WSJ Market Data
Group, the Dow Jones Industrial Average has moved the same direction for the year that it
moved on the first day. This trend has occurred every year, in fact, since 2005. The
correlation is weaker for the S&P 500. That index has moved in the same direction as the
first trading day in fourteen of the past twenty six years.
Regardless of correlations, it's hard to make a viable case that much changed from the
close of business on 12/31 and when the markets opened up on 1/2. Given the thin
trading volume (most professional traders won't be back until Monday), the most likely
reason for the sell-off was some delayed tax loss selling on the first trading day of the
year.
In any case, stocks took a beating on Thursday only to trade flat on Friday. The S&P 500
finished the holiday shortened week down 0.54% while small cap stocks as represented in
the Russell 2000 finished the week down 0.43%.
Here's a daily chart of the S&P 500:
(click on chart for larger image)
I had predicted that the S&P 500 would finish 2013 at 1860 and we got close but I was
inevitably wrong. The S&P ended the year with a strong rally into the close of business on
Tuesday, 12/31 where it traded as high as 1849.44 intra-day and closed at 1848.36 for the
2. year. So, I came up a little under 12 points short of my prediction. I had misjudged the
weakness we saw in early December which was the primary reason for my shortfall.
Treasuries finished the year piercing a milestone in interest rates. The Ten Year Treasury
yield popped its head above the 3% level on Tuesday only to fall back, closing on Friday
at 2.99%. The Ten Year yield hadn't traded that high since July, 2011 right before the
threat of Euro zone implosion sent yields to historic lows.
We're on the cusp of the interest rate that many market prognosticators warned would be
the death knell of the stock market. So far, equities are taking the higher rates in stride.
Here's a weekly chart of the Ten Year Treasury yield:
(click on chart for larger image)
Interest rates are clearly moving higher which will have eventual implications for the US
Dollar and stocks. However, I don't see higher rates having any significant impact on the
economy and stocks in the short term. I'll be expanding on this more below.
In the face of the Ten Year breaching the 3% level, gold defied the traditional inter market
relationship between higher interest rates and lower gold prices and staged quite a
comeback this week. The buying commenced on Tuesday with what could not be
technically classified as a key reversal day but had all the earmarks of one, gapping
higher on Thursday with significant follow through on Friday. Here's a daily chart of the
SPDR Gold Trust Shares ETF (GLD):
3. (click on chart for larger image)
While it did broach an important downtrend line with the move this week it is still too early
to call this a positive change in the yellow metal's direction after the worst year it has had
in thirty years.
Regular readers of my commentary know that I have placed much significance to gold's
price movements in 2013, not just as a predictor of inflation, but more importantly as a
deflationary indicator. And as such, I cannot dismiss the price action this week. Many
attributed the gains to increased Chinese buying before their Lunar New Year, which,
beside the Chinese fixation with gold is something they traditionally do. Some attributed
the pop in precious metals to capital flows out of stocks to beaten up asset classes.
However, I think Michael Gayed hit the nail on the head this week when he commented
on CNBC that gold may be anticipating inflationary pressures. Ordinarily, low interest
rates encourage gold buying when gross interest rates minus inflation turn into negative
real interest rates. This had been the prevailing phenomena of the past four years but had
seemingly changed in 2013 when interest rates started rising in May. But with the
anticipation of inflationary pressures mounting we may well be in a negative real interest
rate environment once again.
Admittedly, the thesis outlined above could be labeled as a "cart before the horse"
argument because there is no apparent inflation on the horizon. Vast swaths of the global
economy are still in a disinflationary or deflationary environment. But proponents argue
under the thesis that the market, which is the sum total of all the knowledge, wisdom, fear
and greed of all its participants, anticipates future events in its price action.
Well, if meaningful inflation is on the horizon the Velocity of Money is certainly not letting
on that there is. Below are the latest readings as of 12/20/2013. The first chart shows the
velocity of M2 since the Fed started tracking it in 1958. The second chart focuses on just
the past five years:
4. (click on chart for larger image)
(click on chart for larger image)
The most we can say as we focus on the second chart is that the trajectory of the decline
is waning.
We will see whether gold's rally this past week was simply a counter trend rally in an
ongoing bear market for the precious metal or whether the gold market is being prescient
regarding inflation in the global economy.
Industrial commodities have stirred a bit in the past month but we are still not seeing the
upward momentum in these metals that would suggest that the global economy is
regaining its footing. I'm going to post two charts which tell two different stories. The first
is a weekly chart of the iPath Dow Jones-AIG Aluminum Total Return Sub Index (JJU)
with a weekly chart of Alcoa (AA) superimposed upon it:
5. (click on chart for larger image)
Alcoa, which is the world’s leading producer of primary and fabricated aluminum, as well
as the world’s largest miner of bauxite and refiner of alumina, has been in rally mode since
September while the metal itself has been languishing. An argument can be made that
the low price of aluminum has made Alcoa more profitable. But then why wouldn't the
stock have been doing well for the past five years while the metal continued in its own
price deflation? The chart clearly shows that the company's fortunes have been closely
correlated to the price of the metal. CEO Klaus Kleinfeld is universally recognized as a
top notch executive who has done everything in his power to make the company as
profitable as it has been since the great commodity deflation started. So, is the price of
the stock anticipating higher prices for aluminum or is the market getting ahead of itself?
Here's the second chart. The price of steel is highly correlated with Chinese economic
activity. The chart below is a weekly chart of the Market Vectors Steel ETF (SLX) and I've
added in the bottom panel a price relative comparison of SLX with the Shanghai
Composite:
6. (click on chart for larger image)
Steel has been in an uptrend since mid-2013 while the price of the metal is clearly
outperforming Chinese stocks. So, is the price of the metal predicting stronger Chinese
economic growth? If so, how many more months do we have to wait to see the Chinese
economy catch up?
Traditionally, I'd take the position that the price of the commodity predicts where the stock
and the pace of economic activity goes. Simple supply/demand dictates the price of the
commodity reflecting, in the case of steel and aluminum, greater demand due to greater
economic activity. However, in the examples above, that logic is inverted. Until I start to
see some meaningful movement in industrial commodities it is difficult for me to get
excited about the progress of global economic growth.
In my last commentary on 12/20 I identified a temporary liquidity issue in China which the
PBoC (People's Bank of China) finally addressed comprehensively right around
Christmas. In the past two weeks we have received some disappointing economic data
from the world's second largest exporting economy (we're still the first) that has sent their
stock market reeling. The latest was a disappointing Services PMI (Purchasing Manager's
Index) on the heels of an equally weak manufacturing PMI. Here's a weekly chart of the
Shanghai Composite:
7. (click on chart for larger image)
We've clearly broken down under an uptrend line that had formed over the prior six
months and the momentum indicators in the top panels are bearish. More and more
pundits are warning that China has problems that are not going away but getting worse.
George Soros was the latest to sound the alarm this week over the internal contradiction
in China's growth engine.
At the same time, Emerging Markets have been battered over the past two months as
seen in the chart below of the iShares MSCI Emerging Markets ETF (EEM). It looks as
though the volume spike we had on Thursday and Friday (see lower panel) is a
"capitulation spike" and mirrors the volume spike we had in late June when the effects of
"taper talk" had decimated the emerging market currencies and their stock market:
8. (click on chart for larger image)
Does this mean EM is ready for a bounce? I'm still wary of EM. They are still trapped
under the specter of a liquidity squeeze as our central bank starts to unwind the historic
monetary stimulus implemented during the dark days of the GFC (Great Financial Crisis).
Analysis
When I made my prediction that the S&P 500 would reach the 1860 level by the New Year
I also said we would have to reassess the situation at that time. Certainly, the first two
trading days of 2014 which I've highlighted above has given me much to think about. But
with light trading volume and many professional traders not back from the holidays it
would be premature to make decisions based on some of the anomalies we have seen
this week.
Regardless of theses, there is no rational way to explain gold's drastic about face this
week while events in China and capitulation selling in Emerging Markets give me cause
for concern. The selloff in the US stock market on Thursday was also unsettling though
tax loss selling accompanied by light volume was the most likely culprit.
As we peer into the future, what can we deduce regarding the direction of financial
markets? While NOTHING is guaranteed here's a few predictions I feel fairly comfortable
making:
1. The US Dollar will strengthen in 2014. Assuming the Fed continues to taper its asset
buying program this year the Dollar will appreciate against the other major foreign
currencies. Currency strength under normal economic conditions is usually positive for
that country's equity markets. The test will be whether we are truly back to "normal
economic" conditions. I think we are getting there.
2. Interest rates will trend higher as the Fed takes its foot off the liquidity pedal. This will
manifest itself mostly in the "belly" of the yield curve (five to seven year maturities) and
there will be some pressure on longer term interest rates as well although I believe rising
long term rates will be muted to some extent. So I don't see significantly higher mortgage
rates.
3. China and the Emerging Markets (EM) are huge question marks in 2014. To the extent
that China can resolve the excesses in its shadow banking system and that EM can
overcome the effects of the liquidity drain of Fed tapering will speak volumes on the
strength of the "global recovery".
4. Gold will tell us much about the shape of the global recovery in 2014. Any positive
traction in the yellow metal will be predictive of inflationary forces building in the global
economy. As stated in many commentaries before, inflation is a necessary consequence
of economic growth and prosperity in a fiat currency system. The fact that inflation has
9. been so low speaks to the tepid nature of global economic growth. Gold's recent bounce
off the $1,200.00 level set up a "double bottom" on the chart (see below) and if we can get
momentum above 60 on the RSI (top panel) it will validate the strength of this move:
(click on chart for larger image)
There are several "moving parts" that will decide where gold will go in 2014. However,
assuming my prediction for a muted rise in interest rates in 2014 is correct, then US Dollar
strength will be somewhat muted and gold should be a valuable indicator as to the
strength of the global economy. Whether you are a "gold bug" or not, you should be
welcoming higher gold prices in 2014 because it will be telling you (outside of any
exogenous shocks on the planet) that the global recovery is for real.
That's it for now. I'm looking forward to next week when all participants will be back so I
can try to make sense of the first two trading days of the year.
I hope everyone has a prosperous 2014!