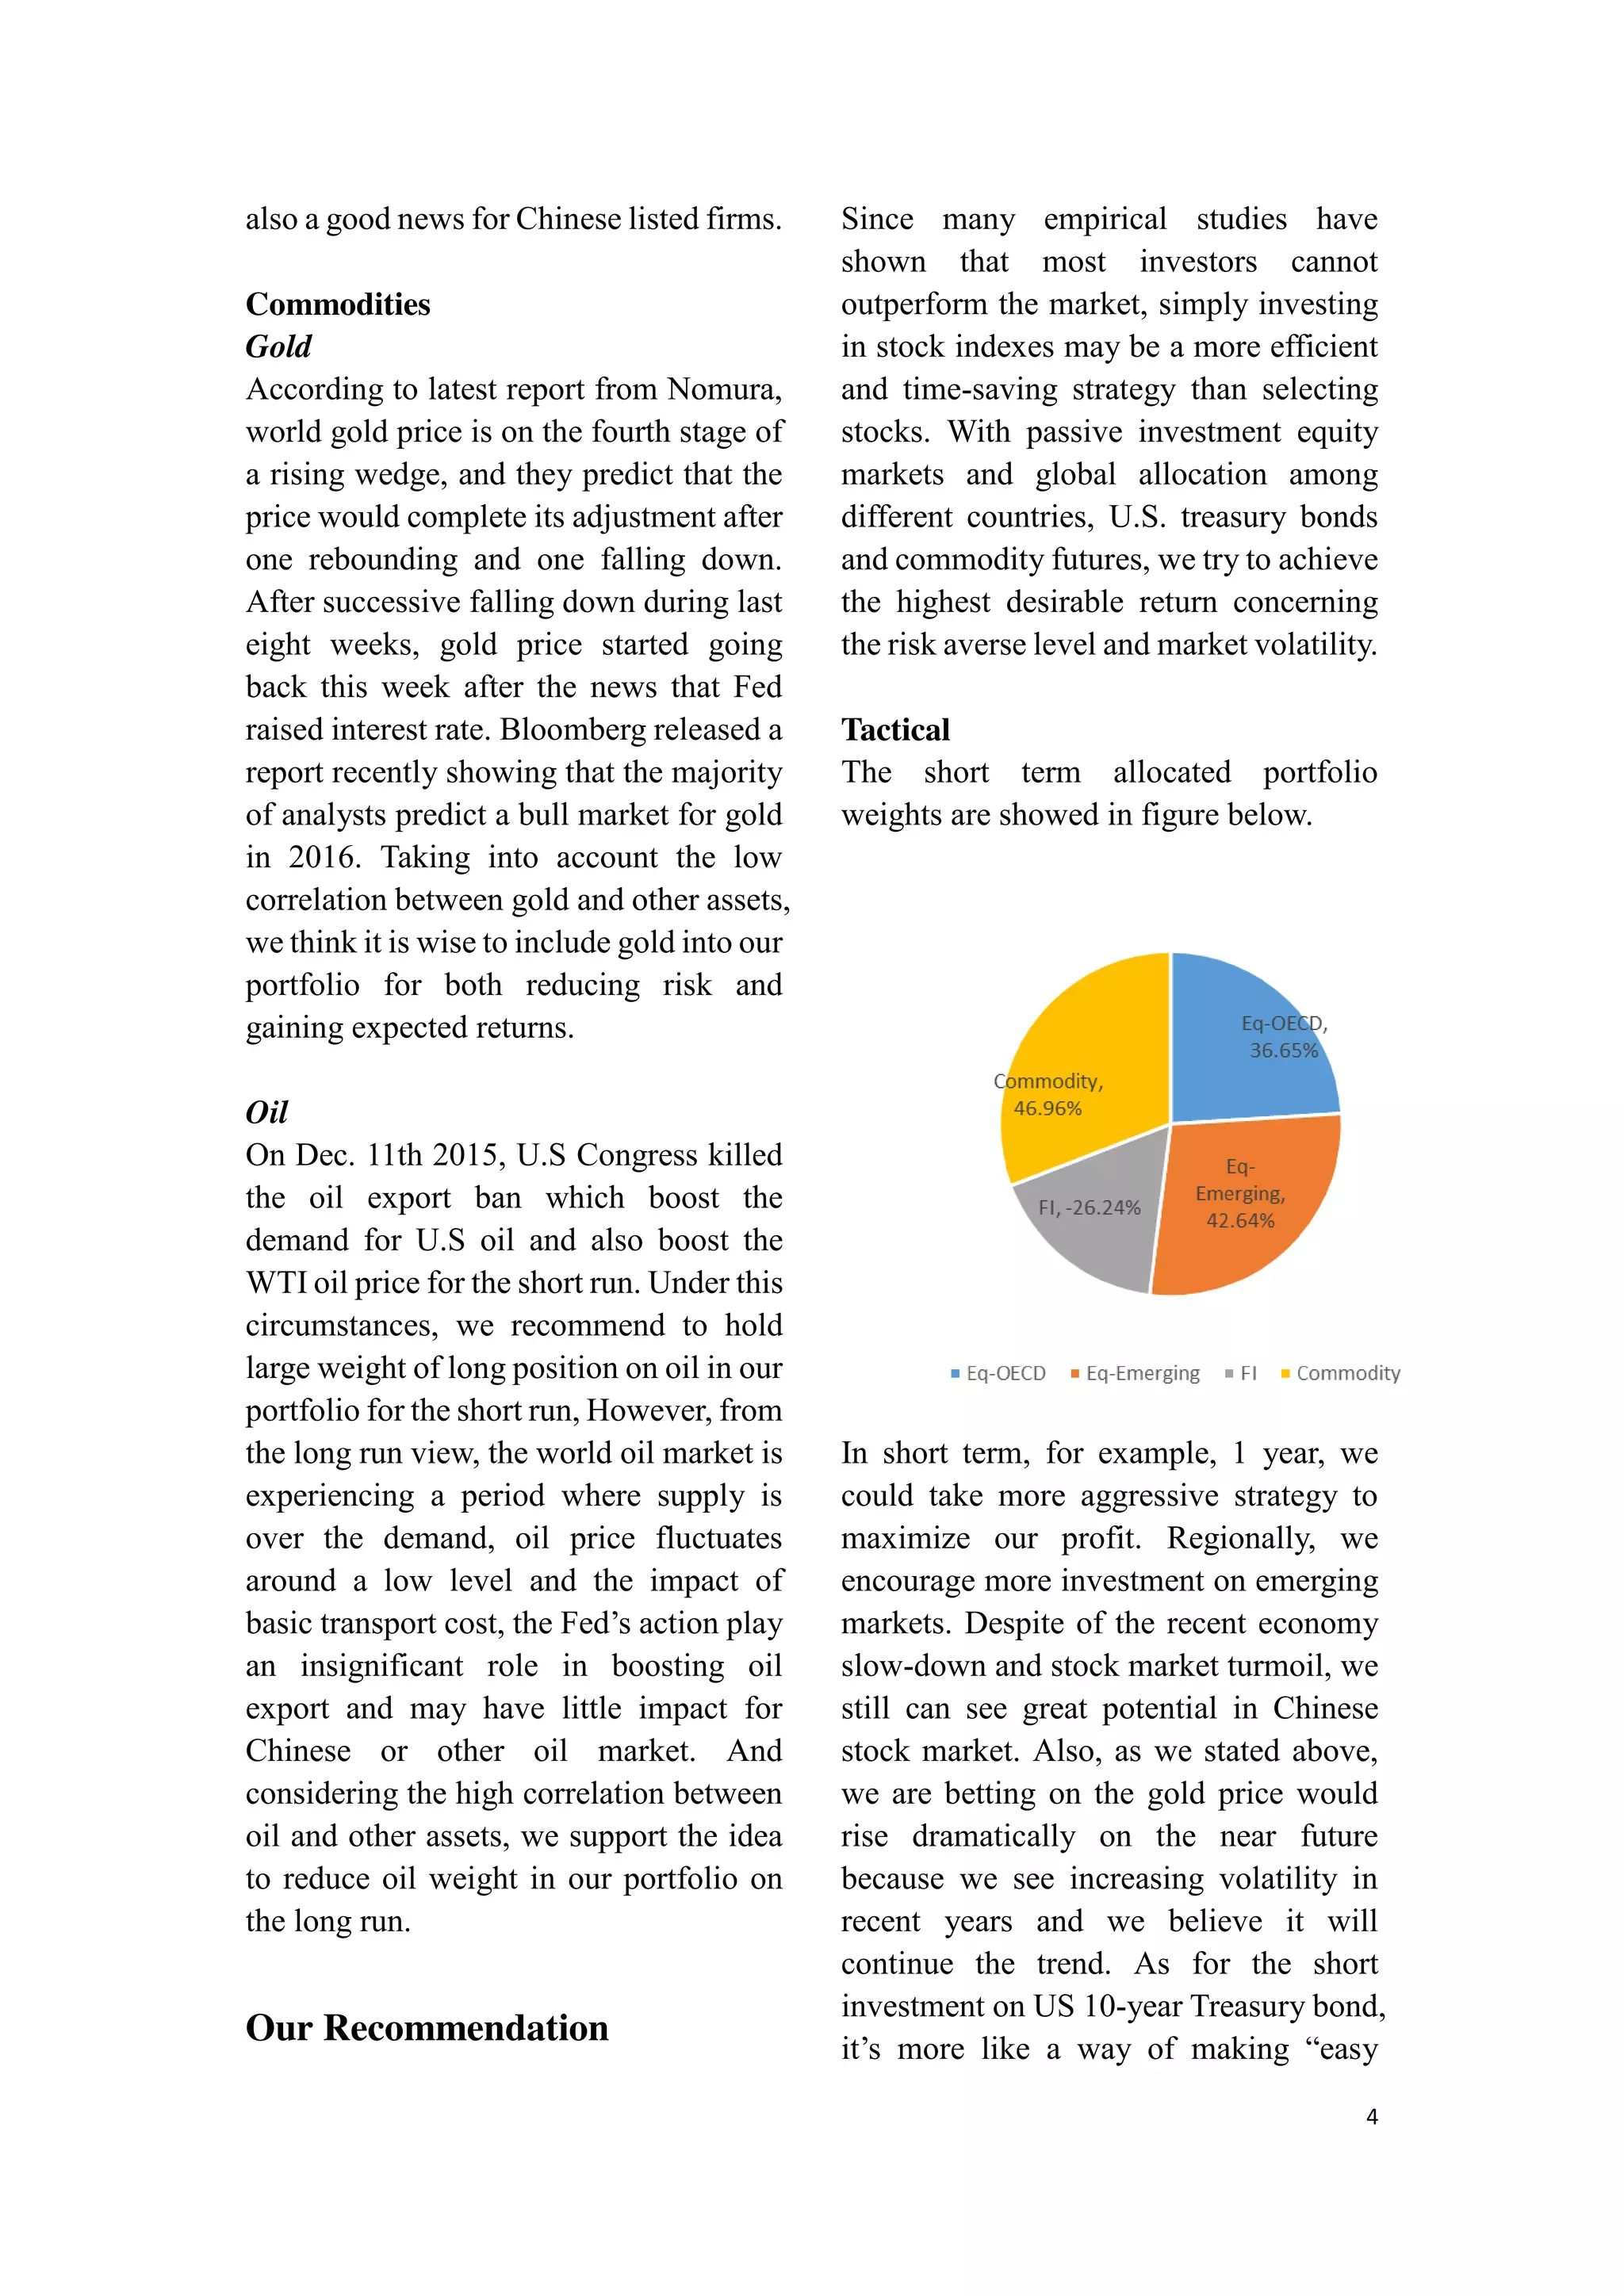
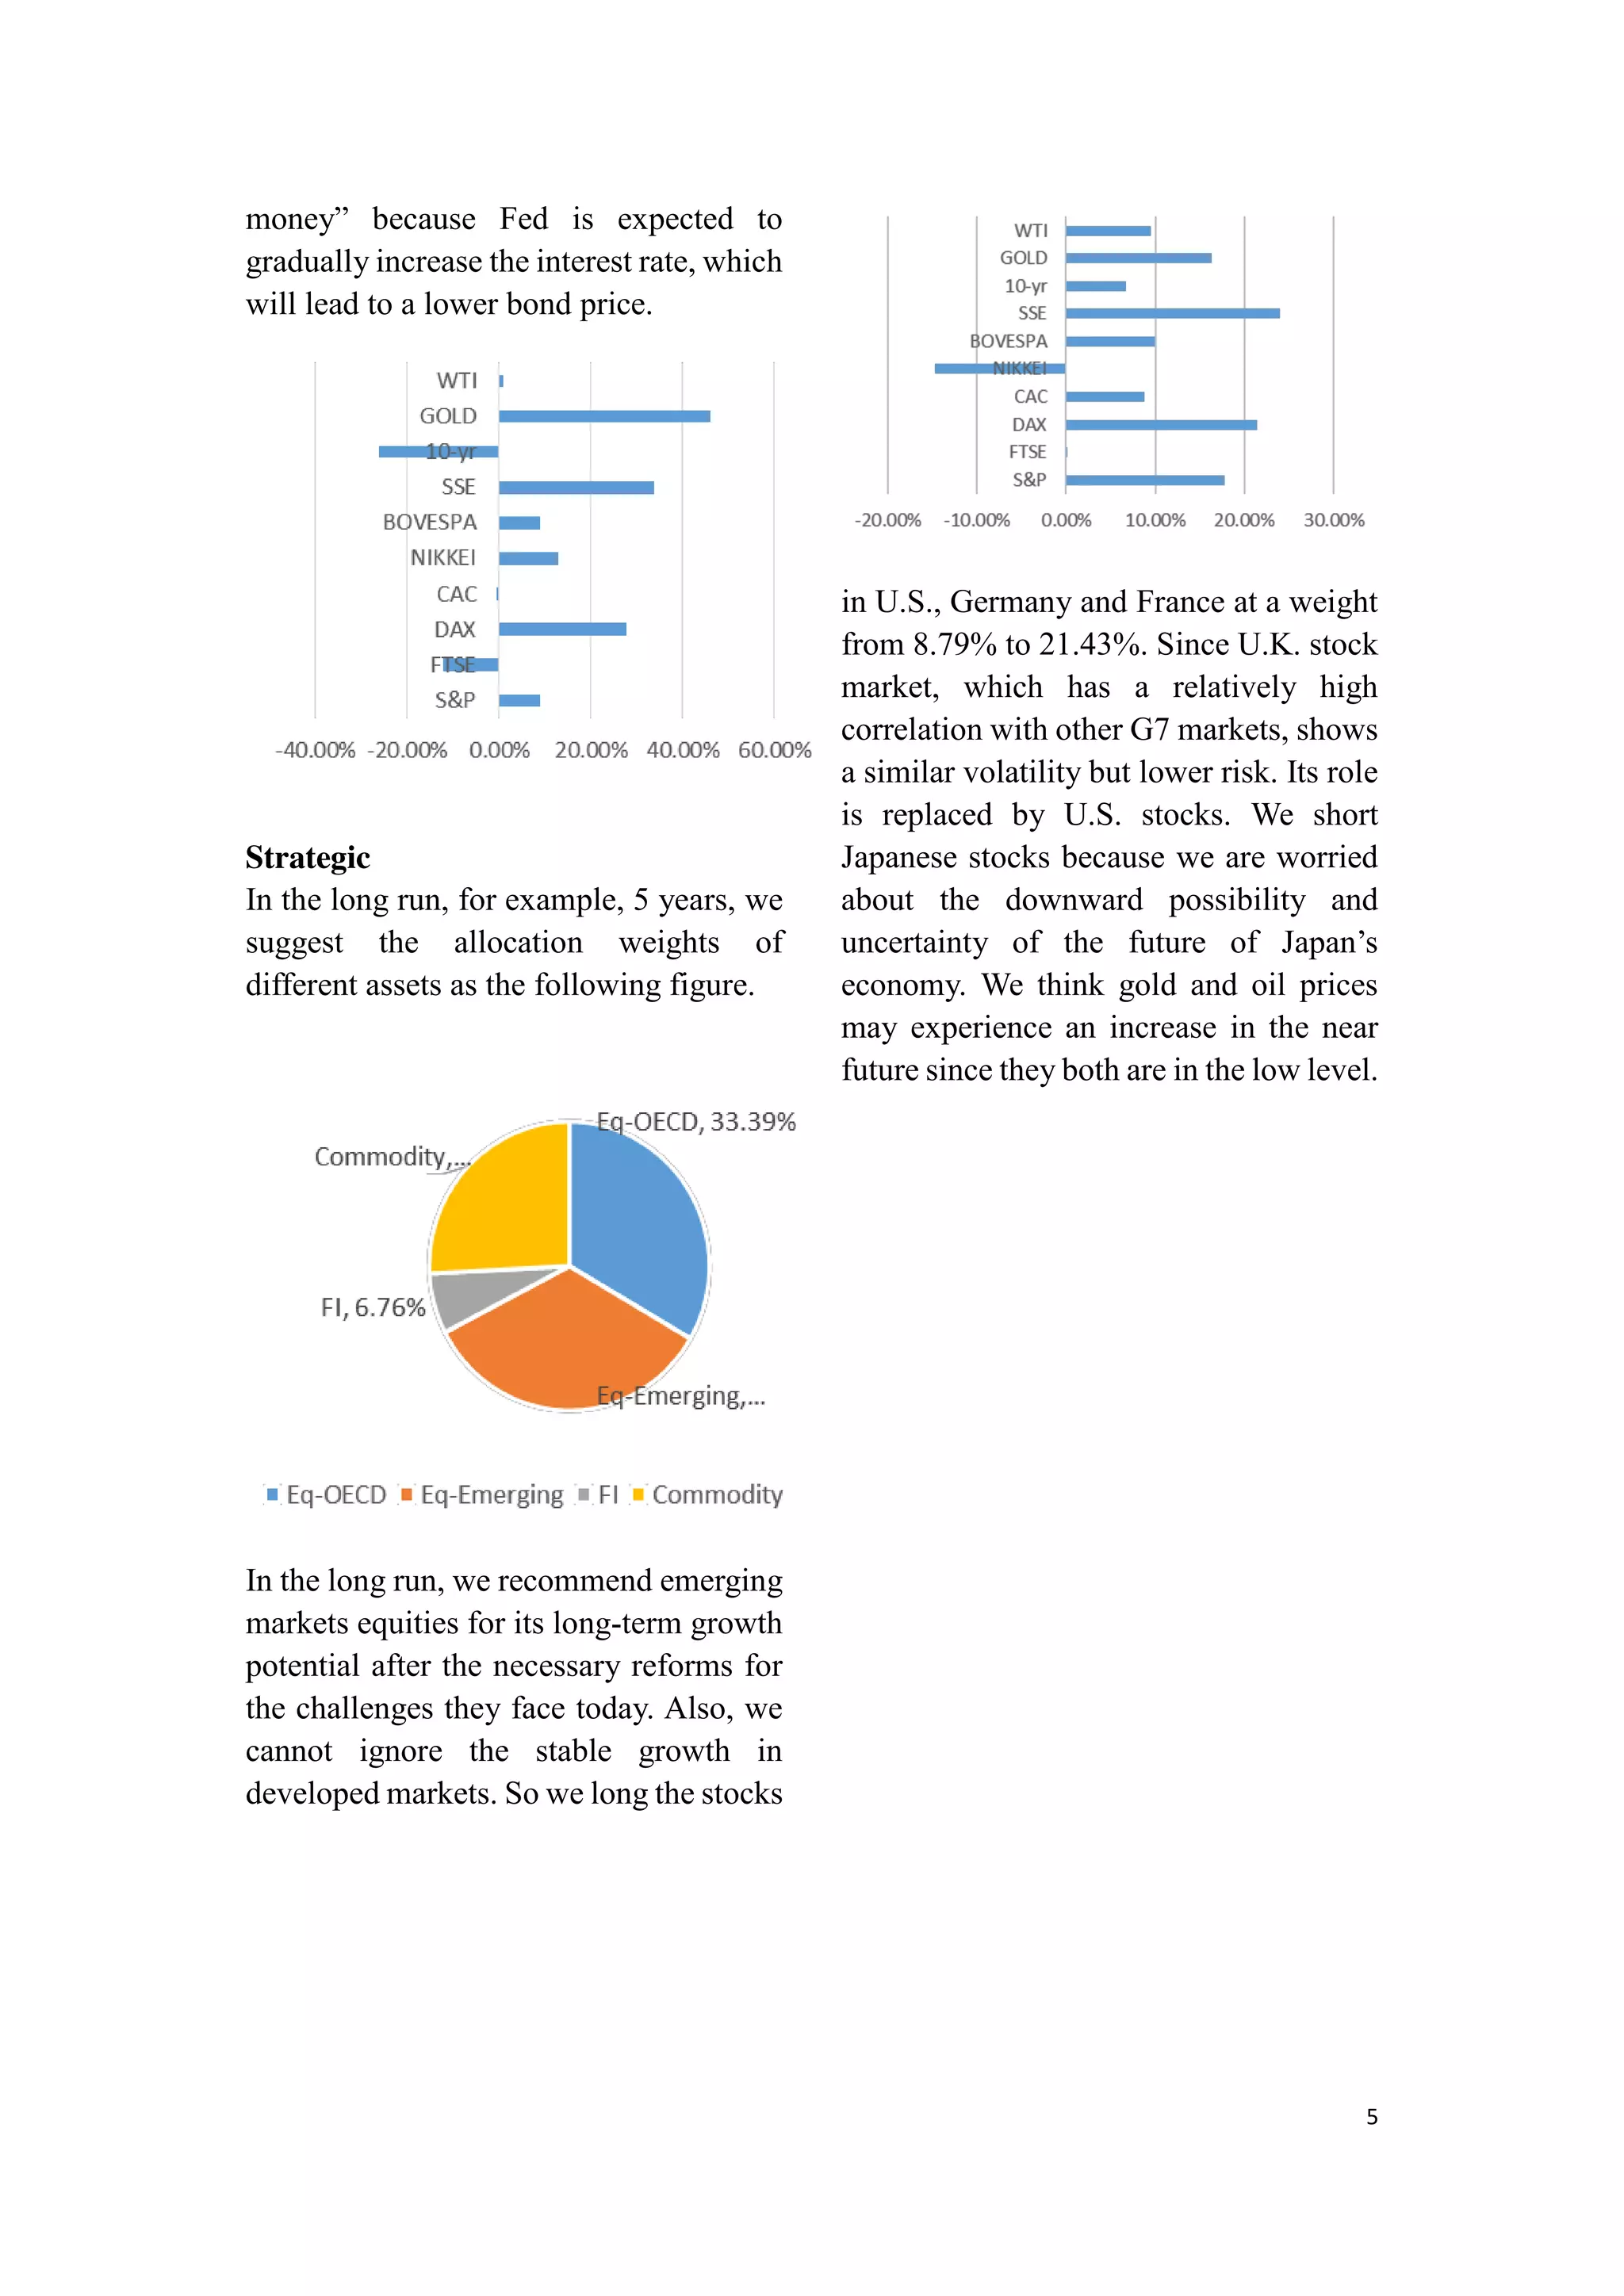
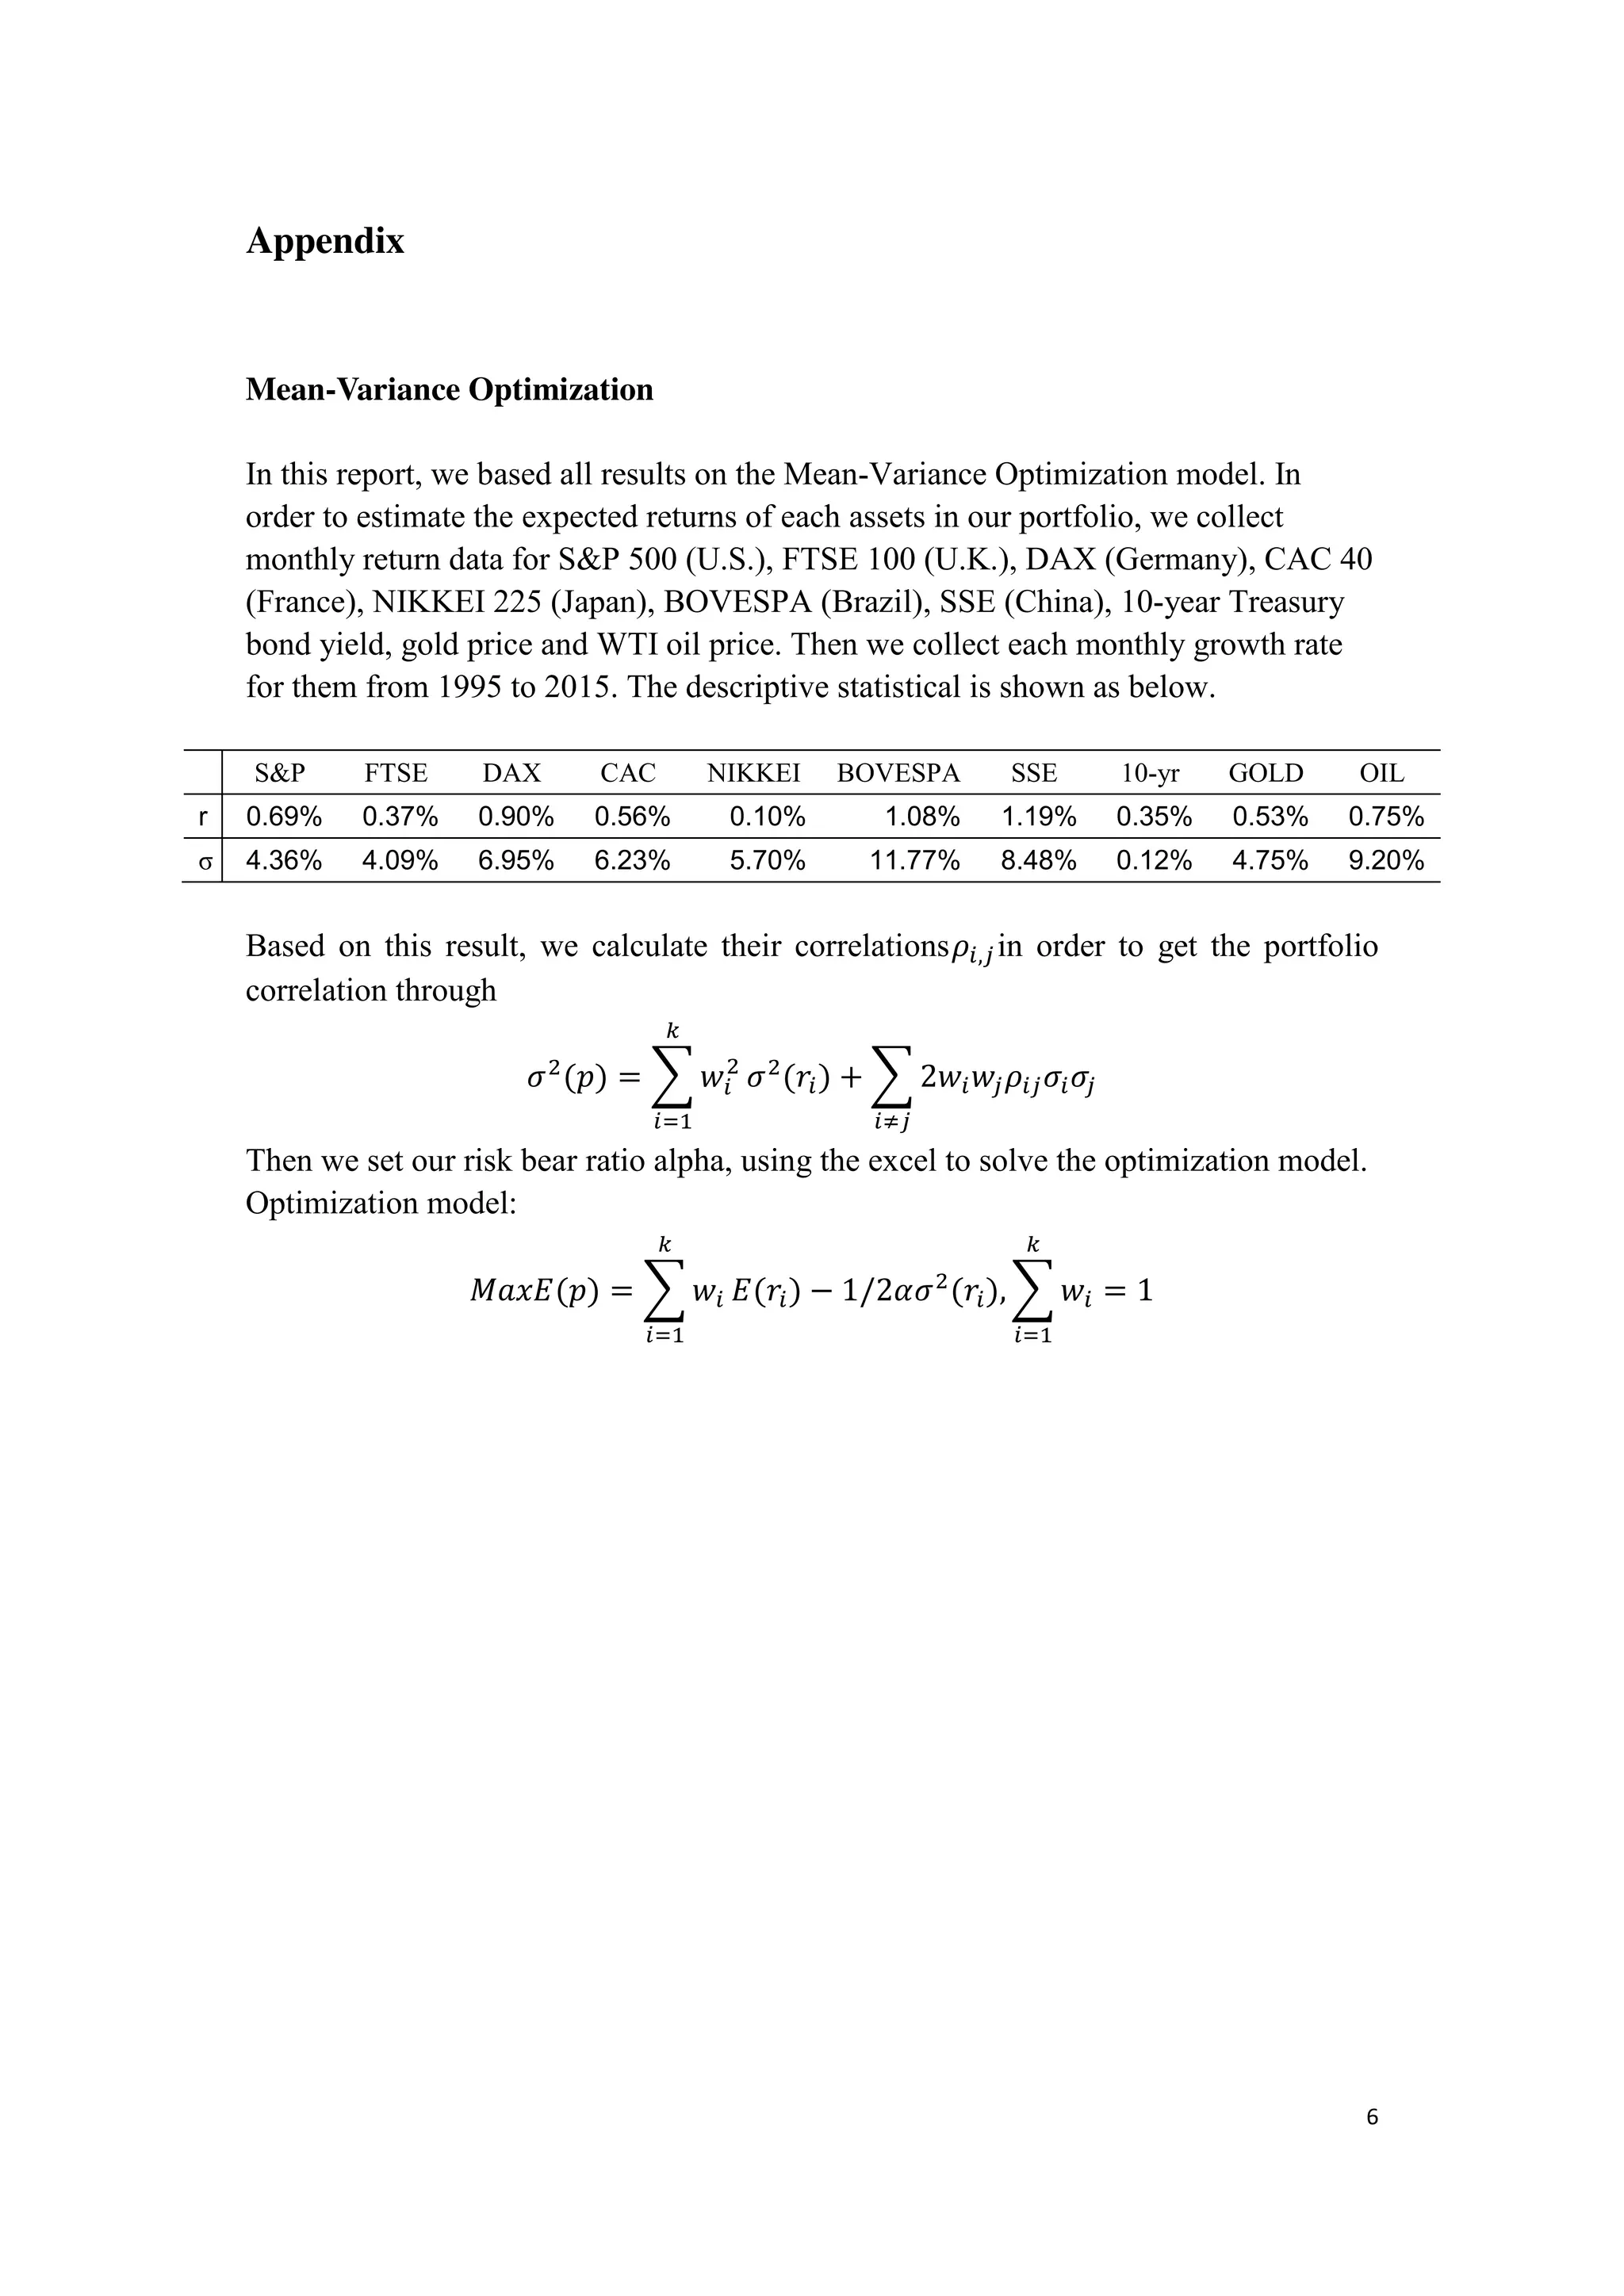
SlideShare a Scribd company logo
1 of 6
Download to read offline
Global Asset Allocation Report
Finance 614 Fall 2015
Prepared by Shan He, Erhai Liu, Ran Zhang
December 19, 2015
2
Our Principles and Strategies
In a more and more globalized, dynamic
and uncertain financial market, we need
to have an ideas of asset allocation to
achieve an ideal return with controllable
risks. To diversify our investment and
manage the risks, we need to know about
the performance and trends of different
assets and markets. In general, stock
markets of G7 countries can provide
stable returns and risks. Emerging
markets (like BRIC nations) are more
risky with higher expected returns along
with higher volatility. U.S. treasury
bonds can be considered as a risk-free
asset with stable although relatively low
return. Also, commodities play an
essential role which has to be considered.
Since the more and more frequent
volatile fluctuations during these years,
we think commodities like gold and oil
cannot be simply considered as hedge
assets.
With the information of each asset, we
can get a recommended weight by mean-
variance optimization. The weights
differs in different time horizons since
tactical investors may be more aggressive
and strategic investors are more risk
averse.
A Brief View of the World
G7 Countries
U.S.
U.S. economy has experienced slow but
stable recovery and growth after the
financial crisis with GDP growth rate of
about 2% a year and relatively low
inflation rate (less than 1% in the year of
2015). Benefited from the stable
economic growth, U.S. stock market has
been growing from the low level in crisis
to the highest level in history. For
example, S&P 500 has increased from
683 in May 2009 to more than 2000 now.
Generally, U.S. stock market can always
provide stable return with controllable
risks which proves to be a good choice
for equity investment. Though U.S.
stocks may face downside adjustments in
the short term due to its historical high
level now, it will enjoy another round of
steady growth in the future.
Moreover, U.S. treasury bonds is famous
for its undoubtable credits which can be
considered as a risk-free asset. So it is
also an important alternative for risk
management and diversification.
U.K.
Since 2010, U.K. economy has kept
growing at a rate of 0%~1%, which is
quite stable and also outperforms the
Euro-zone. Its stock market, for instance,
FTSE 100 index, has gone down a little
after doubling from the lowest level in
2009. In our analysis, we have found that
U.K. stocks show a similar volatility but
lower return comparing with U.S. stocks.
And the correlation of two markets are
relatively high. So U.K. stocks may be
replaced by U.S. stocks to a large extent
as a choice of investment.
Euro-zone
Our investment in Euro-Zone will
primarily focus on Germany and France,
two main Euro-zone economies. There is
a strong correlation between economics
of these two countries. According to the
historical economics data, Germany
substantially outperforms other countries
in Europe. As a country largely
depending on its export, recent weak
3
global demand drags Germany with its
GDP Growth confirmed at 0.3% in Q3.
But we do witness a faster increase in its
household and government spending
which supports its long-term growth.
Japan
The fundamentals of Japan’s economy is
not that optimistic recently. GDP have
contracted for second quarter in a row,
which, indeed is the rule we define the
recession. And the recent announcement
of BOJ which is far from being desirable
further disappointed market. In the long
run, the future of Japan’s economy is
quite uncertain. Due to the problems of
aging and low birth rate, Japan’s
shrinking workforce also puts shadows
on the future of this nation. So we would
sell short on NIKKEI 225 index in 5
years. However, we would bet short-term
investment on Japanese market for the
simple reason that market may react too
much to the headline numbers and we
believe that BOJ will extend its monetary
easing program shortly with more
aggressive moves.
Emerging Markets
Brazil
Although inflation rate for Brazil in Dec
reaches 10.48% and now BOVESPA is
almost half of its historical highest point
which in 2008, we still suggest to hold a
long position in the BOVESPA both for
short run sight and for long run horizon.
For the short run view, Fed raised interest
rate on Dec.16th and thus the Brazilian
Lira would be weaken consistently and
that investor might enter into Brazil stock
market as a defensive action. This
expectation might push the BOVESPA to
a higher point. As for high inflation rate
and unemployment rate, we believe that
Brazil government would implement
positive policy soon as what they did in
September 2015, which draw down its
inflation rate to 3 months lowest. For the
long run view, although many major
banks and their hedge fund choose to be
conservative on the defensive assets from
the emerging market, there are still hedge
fund managers suggest that
accompanying with Fed’s loss of
credibility and its action to raise interest
rate, what Brazil experience today is
similar to Asian Financial Crisis in 1997,
providing an ideal chance to enter a long
position at a very low cost.
China
During recent years, China’s economy
has experienced deceleration, reversing
the trend of rapid growth in the past
decades. Though there is always turmoil
and crazy things in Chinese stock market,
it still remains an emerging market with a
relatively high expected return. This is
the reason why we still recommend
Chinese stocks.
To the great challenges ahead, China is
adjusting itself and has carried out some
big strategies. During recent years, it
plans to reform the construction of its
economy in order to transform to a
modernized one through the strategies
like ”Industrialization 4.0” or “Made in
China 2025”, each of which will set off
waves of pursuit in capital market.
Moreover, it has also launched “One
Road One Belt” strategy which is a
unprecedented international cooperation
led by China ranging from Southeast
Asia to Middle East, as well as the
establishment of AIIB (Asian
Infrastructure Investment Bank). It
brings a huge demands for Chinese
investment abroad, which we believe is
4
also a good news for Chinese listed firms.
Commodities
Gold
According to latest report from Nomura,
world gold price is on the fourth stage of
a rising wedge, and they predict that the
price would complete its adjustment after
one rebounding and one falling down.
After successive falling down during last
eight weeks, gold price started going
back this week after the news that Fed
raised interest rate. Bloomberg released a
report recently showing that the majority
of analysts predict a bull market for gold
in 2016. Taking into account the low
correlation between gold and other assets,
we think it is wise to include gold into our
portfolio for both reducing risk and
gaining expected returns.
Oil
On Dec. 11th 2015, U.S Congress killed
the oil export ban which boost the
demand for U.S oil and also boost the
WTI oil price for the short run. Under this
circumstances, we recommend to hold
large weight of long position on oil in our
portfolio for the short run, However, from
the long run view, the world oil market is
experiencing a period where supply is
over the demand, oil price fluctuates
around a low level and the impact of
basic transport cost, the Fed’s action play
an insignificant role in boosting oil
export and may have little impact for
Chinese or other oil market. And
considering the high correlation between
oil and other assets, we support the idea
to reduce oil weight in our portfolio on
the long run.
Our Recommendation
Since many empirical studies have
shown that most investors cannot
outperform the market, simply investing
in stock indexes may be a more efficient
and time-saving strategy than selecting
stocks. With passive investment equity
markets and global allocation among
different countries, U.S. treasury bonds
and commodity futures, we try to achieve
the highest desirable return concerning
the risk averse level and market volatility.
Tactical
The short term allocated portfolio
weights are showed in figure below.
In short term, for example, 1 year, we
could take more aggressive strategy to
maximize our profit. Regionally, we
encourage more investment on emerging
markets. Despite of the recent economy
slow-down and stock market turmoil, we
still can see great potential in Chinese
stock market. Also, as we stated above,
we are betting on the gold price would
rise dramatically on the near future
because we see increasing volatility in
recent years and we believe it will
continue the trend. As for the short
investment on US 10-year Treasury bond,
it’s more like a way of making “easy
5
money” because Fed is expected to
gradually increase the interest rate, which
will lead to a lower bond price.
Strategic
In the long run, for example, 5 years, we
suggest the allocation weights of
different assets as the following figure.
In the long run, we recommend emerging
markets equities for its long-term growth
potential after the necessary reforms for
the challenges they face today. Also, we
cannot ignore the stable growth in
developed markets. So we long the stocks
in U.S., Germany and France at a weight
from 8.79% to 21.43%. Since U.K. stock
market, which has a relatively high
correlation with other G7 markets, shows
a similar volatility but lower risk. Its role
is replaced by U.S. stocks. We short
Japanese stocks because we are worried
about the downward possibility and
uncertainty of the future of Japan’s
economy. We think gold and oil prices
may experience an increase in the near
future since they both are in the low level.
6
Appendix
Mean-Variance Optimization
In this report, we based all results on the Mean-Variance Optimization model. In
order to estimate the expected returns of each assets in our portfolio, we collect
monthly return data for S&P 500 (U.S.), FTSE 100 (U.K.), DAX (Germany), CAC 40
(France), NIKKEI 225 (Japan), BOVESPA (Brazil), SSE (China), 10-year Treasury
bond yield, gold price and WTI oil price. Then we collect each monthly growth rate
for them from 1995 to 2015. The descriptive statistical is shown as below.
S&P FTSE DAX CAC NIKKEI BOVESPA SSE 10-yr GOLD OIL
r 0.69% 0.37% 0.90% 0.56% 0.10% 1.08% 1.19% 0.35% 0.53% 0.75%
σ 4.36% 4.09% 6.95% 6.23% 5.70% 11.77% 8.48% 0.12% 4.75% 9.20%
Based on this result, we calculate their correlations𝜌𝑖,𝑗 in order to get the portfolio
correlation through
𝜎2
(𝑝) = ∑ 𝑤𝑖
2
𝑘
𝑖=1
𝜎2
(𝑟𝑖) + ∑ 2𝑤𝑖 𝑤𝑗 𝜌𝑖𝑗 𝜎𝑖 𝜎𝑗
𝑖≠𝑗
Then we set our risk bear ratio alpha, using the excel to solve the optimization model.
Optimization model:
𝑀𝑎𝑥𝐸(𝑝) = ∑ 𝑤𝑖
𝑘
𝑖=1
𝐸(𝑟𝑖) − 1/2𝛼𝜎2
(𝑟𝑖), ∑ 𝑤𝑖
𝑘
𝑖=1
= 1

More Related Content

What's hot

Mcx Daily Report 07 Oct 2019
Mcx Daily Report 07 Oct 2019Mcx Daily Report 07 Oct 2019
Mcx Daily Report 07 Oct 2019Myra Cheng
 
Nigeria 2016 outlook a slippery path to recovery
Nigeria 2016 outlook   a slippery path to recoveryNigeria 2016 outlook   a slippery path to recovery
Nigeria 2016 outlook a slippery path to recoveryKayode Tinuoye
 
Finlight Research - Market Perspectives - Aug 2015
Finlight Research - Market Perspectives - Aug 2015Finlight Research - Market Perspectives - Aug 2015
Finlight Research - Market Perspectives - Aug 2015FinLight Research
 
Avant garde wealth mgmt - Quarterly letter - 1312
Avant garde wealth mgmt  - Quarterly letter - 1312Avant garde wealth mgmt  - Quarterly letter - 1312
Avant garde wealth mgmt - Quarterly letter - 1312Gaurav Jalan
 
The silver low your silver spoon
The silver low   your silver spoonThe silver low   your silver spoon
The silver low your silver spoonNinja Tan
 
Whats Ahead In 2012 - An Investment Perspective (Spring Update)
Whats Ahead In 2012 - An Investment Perspective (Spring Update)Whats Ahead In 2012 - An Investment Perspective (Spring Update)
Whats Ahead In 2012 - An Investment Perspective (Spring Update)scottmeek
 
Current Market Outlook June 2008
Current Market Outlook June 2008Current Market Outlook June 2008
Current Market Outlook June 2008Amar Ranu
 
Presentation on investor s hedge against inflations2
Presentation on investor s hedge against inflations2Presentation on investor s hedge against inflations2
Presentation on investor s hedge against inflations2nitish313309
 
Economic Implications: Market Forecasts
Economic Implications: Market ForecastsEconomic Implications: Market Forecasts
Economic Implications: Market ForecastsNICSA
 
November 2, 2014 with charts
November 2, 2014 with chartsNovember 2, 2014 with charts
November 2, 2014 with chartsScutify
 
June 23 I Session 2 I GBIH
June 23 I Session 2 I GBIHJune 23 I Session 2 I GBIH
June 23 I Session 2 I GBIHGBIHSupport
 
Sprung investment management commentary 4th quarter, 2013
Sprung investment management commentary   4th quarter, 2013Sprung investment management commentary   4th quarter, 2013
Sprung investment management commentary 4th quarter, 2013Robert Champion
 
February 1, 2015 with charts
February 1, 2015 with chartsFebruary 1, 2015 with charts
February 1, 2015 with chartsScutify
 
Schwab Market Outlook 2016
Schwab Market Outlook 2016Schwab Market Outlook 2016
Schwab Market Outlook 2016Marvin Clark
 

What's hot (20)

Mcx Daily Report 07 Oct 2019
Mcx Daily Report 07 Oct 2019Mcx Daily Report 07 Oct 2019
Mcx Daily Report 07 Oct 2019
 
Nigeria 2016 outlook a slippery path to recovery
Nigeria 2016 outlook   a slippery path to recoveryNigeria 2016 outlook   a slippery path to recovery
Nigeria 2016 outlook a slippery path to recovery
 
MostA_G3buy2013_Commentary
MostA_G3buy2013_CommentaryMostA_G3buy2013_Commentary
MostA_G3buy2013_Commentary
 
Finlight Research - Market Perspectives - Aug 2015
Finlight Research - Market Perspectives - Aug 2015Finlight Research - Market Perspectives - Aug 2015
Finlight Research - Market Perspectives - Aug 2015
 
76 i chronicle
76 i chronicle76 i chronicle
76 i chronicle
 
Avant garde wealth mgmt - Quarterly letter - 1312
Avant garde wealth mgmt  - Quarterly letter - 1312Avant garde wealth mgmt  - Quarterly letter - 1312
Avant garde wealth mgmt - Quarterly letter - 1312
 
The silver low your silver spoon
The silver low   your silver spoonThe silver low   your silver spoon
The silver low your silver spoon
 
Whats Ahead In 2012 - An Investment Perspective (Spring Update)
Whats Ahead In 2012 - An Investment Perspective (Spring Update)Whats Ahead In 2012 - An Investment Perspective (Spring Update)
Whats Ahead In 2012 - An Investment Perspective (Spring Update)
 
Current Market Outlook June 2008
Current Market Outlook June 2008Current Market Outlook June 2008
Current Market Outlook June 2008
 
Return On Investment - Spring 2016
Return On Investment - Spring 2016Return On Investment - Spring 2016
Return On Investment - Spring 2016
 
Presentation on investor s hedge against inflations2
Presentation on investor s hedge against inflations2Presentation on investor s hedge against inflations2
Presentation on investor s hedge against inflations2
 
Weekly Market Review - August 23, 2013
Weekly Market Review - August 23, 2013Weekly Market Review - August 23, 2013
Weekly Market Review - August 23, 2013
 
Economic Implications: Market Forecasts
Economic Implications: Market ForecastsEconomic Implications: Market Forecasts
Economic Implications: Market Forecasts
 
November 2, 2014 with charts
November 2, 2014 with chartsNovember 2, 2014 with charts
November 2, 2014 with charts
 
June 23 I Session 2 I GBIH
June 23 I Session 2 I GBIHJune 23 I Session 2 I GBIH
June 23 I Session 2 I GBIH
 
Q2 2013 Newsletter
Q2 2013 NewsletterQ2 2013 Newsletter
Q2 2013 Newsletter
 
ET FinPro mod 2 final 2
ET FinPro mod 2 final 2ET FinPro mod 2 final 2
ET FinPro mod 2 final 2
 
Sprung investment management commentary 4th quarter, 2013
Sprung investment management commentary   4th quarter, 2013Sprung investment management commentary   4th quarter, 2013
Sprung investment management commentary 4th quarter, 2013
 
February 1, 2015 with charts
February 1, 2015 with chartsFebruary 1, 2015 with charts
February 1, 2015 with charts
 
Schwab Market Outlook 2016
Schwab Market Outlook 2016Schwab Market Outlook 2016
Schwab Market Outlook 2016
 

Similar to Global Asset Allocation Report Summary

The Rally At Six Months
The Rally At Six MonthsThe Rally At Six Months
The Rally At Six Monthspopeni
 
The Rally At Six Months
The Rally At Six MonthsThe Rally At Six Months
The Rally At Six Monthskvezino
 
The Rally At Six Months
The Rally At Six MonthsThe Rally At Six Months
The Rally At Six Monthskrueth
 
The Rally At Six Months
The Rally At Six MonthsThe Rally At Six Months
The Rally At Six Monthsconradrbeeler
 
The Rally At Six Months - SEI Commentary
The Rally At Six Months - SEI CommentaryThe Rally At Six Months - SEI Commentary
The Rally At Six Months - SEI CommentaryRlevinsohn
 
7 wells fargo 2015 mid-year outlook - turning points
7 wells fargo 2015 mid-year outlook - turning points7 wells fargo 2015 mid-year outlook - turning points
7 wells fargo 2015 mid-year outlook - turning points123jumpad
 
BlackRock: 2014 Outlook The List - What to Know, What to Do
BlackRock: 2014 Outlook The List - What to Know, What to DoBlackRock: 2014 Outlook The List - What to Know, What to Do
BlackRock: 2014 Outlook The List - What to Know, What to DoEcon Matters
 
Investors Lament
Investors LamentInvestors Lament
Investors LamentRlevinsohn
 
Investors Lament
Investors LamentInvestors Lament
Investors Lamentkvezino
 
Investors Lament
Investors LamentInvestors Lament
Investors Lamentpopeni
 
2017 Q2 Fidelity Investment Outlook
2017 Q2 Fidelity Investment Outlook 2017 Q2 Fidelity Investment Outlook
2017 Q2 Fidelity Investment Outlook CEO Magazyn Polska
 
Investment Outlook 2016
Investment Outlook 2016Investment Outlook 2016
Investment Outlook 2016Credit Suisse
 
2010 LPL Financial Outlook
2010 LPL Financial Outlook2010 LPL Financial Outlook
2010 LPL Financial Outlookguestc5af6ef
 
Dealing With Divergences - Blackrock 2015 Outlook
Dealing With Divergences - Blackrock 2015 OutlookDealing With Divergences - Blackrock 2015 Outlook
Dealing With Divergences - Blackrock 2015 OutlookJoão Pinto
 
True-Insight-Issue-3-2016
True-Insight-Issue-3-2016True-Insight-Issue-3-2016
True-Insight-Issue-3-2016Barrie Kent
 
True-Insight-Issue-3-2016
True-Insight-Issue-3-2016True-Insight-Issue-3-2016
True-Insight-Issue-3-2016Barrie Kent
 

Similar to Global Asset Allocation Report Summary (20)

The Rally At Six Months
The Rally At Six MonthsThe Rally At Six Months
The Rally At Six Months
 
The Rally At Six Months
The Rally At Six MonthsThe Rally At Six Months
The Rally At Six Months
 
The Rally At Six Months
The Rally At Six MonthsThe Rally At Six Months
The Rally At Six Months
 
The Rally At Six Months
The Rally At Six MonthsThe Rally At Six Months
The Rally At Six Months
 
The Rally At Six Months - SEI Commentary
The Rally At Six Months - SEI CommentaryThe Rally At Six Months - SEI Commentary
The Rally At Six Months - SEI Commentary
 
7 wells fargo 2015 mid-year outlook - turning points
7 wells fargo 2015 mid-year outlook - turning points7 wells fargo 2015 mid-year outlook - turning points
7 wells fargo 2015 mid-year outlook - turning points
 
2016 Outlook
2016 Outlook2016 Outlook
2016 Outlook
 
BlackRock: 2014 Outlook The List - What to Know, What to Do
BlackRock: 2014 Outlook The List - What to Know, What to DoBlackRock: 2014 Outlook The List - What to Know, What to Do
BlackRock: 2014 Outlook The List - What to Know, What to Do
 
Investors Lament
Investors LamentInvestors Lament
Investors Lament
 
Investors Lament
Investors LamentInvestors Lament
Investors Lament
 
Investors Lament
Investors LamentInvestors Lament
Investors Lament
 
2017 Q2 Fidelity Investment Outlook
2017 Q2 Fidelity Investment Outlook 2017 Q2 Fidelity Investment Outlook
2017 Q2 Fidelity Investment Outlook
 
Investment Outlook 2016
Investment Outlook 2016Investment Outlook 2016
Investment Outlook 2016
 
2010 LPL Financial Outlook
2010 LPL Financial Outlook2010 LPL Financial Outlook
2010 LPL Financial Outlook
 
File 707525
File 707525File 707525
File 707525
 
Dealing With Divergences - Blackrock 2015 Outlook
Dealing With Divergences - Blackrock 2015 OutlookDealing With Divergences - Blackrock 2015 Outlook
Dealing With Divergences - Blackrock 2015 Outlook
 
2016 ETF and investment outlook
2016 ETF and investment outlook2016 ETF and investment outlook
2016 ETF and investment outlook
 
True-Insight-Issue-3-2016
True-Insight-Issue-3-2016True-Insight-Issue-3-2016
True-Insight-Issue-3-2016
 
True-Insight-Issue-3-2016
True-Insight-Issue-3-2016True-Insight-Issue-3-2016
True-Insight-Issue-3-2016
 
Thought for the week 276
Thought for the week   276Thought for the week   276
Thought for the week 276
 

Global Asset Allocation Report Summary

  • 1. Global Asset Allocation Report Finance 614 Fall 2015 Prepared by Shan He, Erhai Liu, Ran Zhang December 19, 2015
  • 2. 2 Our Principles and Strategies In a more and more globalized, dynamic and uncertain financial market, we need to have an ideas of asset allocation to achieve an ideal return with controllable risks. To diversify our investment and manage the risks, we need to know about the performance and trends of different assets and markets. In general, stock markets of G7 countries can provide stable returns and risks. Emerging markets (like BRIC nations) are more risky with higher expected returns along with higher volatility. U.S. treasury bonds can be considered as a risk-free asset with stable although relatively low return. Also, commodities play an essential role which has to be considered. Since the more and more frequent volatile fluctuations during these years, we think commodities like gold and oil cannot be simply considered as hedge assets. With the information of each asset, we can get a recommended weight by mean- variance optimization. The weights differs in different time horizons since tactical investors may be more aggressive and strategic investors are more risk averse. A Brief View of the World G7 Countries U.S. U.S. economy has experienced slow but stable recovery and growth after the financial crisis with GDP growth rate of about 2% a year and relatively low inflation rate (less than 1% in the year of 2015). Benefited from the stable economic growth, U.S. stock market has been growing from the low level in crisis to the highest level in history. For example, S&P 500 has increased from 683 in May 2009 to more than 2000 now. Generally, U.S. stock market can always provide stable return with controllable risks which proves to be a good choice for equity investment. Though U.S. stocks may face downside adjustments in the short term due to its historical high level now, it will enjoy another round of steady growth in the future. Moreover, U.S. treasury bonds is famous for its undoubtable credits which can be considered as a risk-free asset. So it is also an important alternative for risk management and diversification. U.K. Since 2010, U.K. economy has kept growing at a rate of 0%~1%, which is quite stable and also outperforms the Euro-zone. Its stock market, for instance, FTSE 100 index, has gone down a little after doubling from the lowest level in 2009. In our analysis, we have found that U.K. stocks show a similar volatility but lower return comparing with U.S. stocks. And the correlation of two markets are relatively high. So U.K. stocks may be replaced by U.S. stocks to a large extent as a choice of investment. Euro-zone Our investment in Euro-Zone will primarily focus on Germany and France, two main Euro-zone economies. There is a strong correlation between economics of these two countries. According to the historical economics data, Germany substantially outperforms other countries in Europe. As a country largely depending on its export, recent weak
  • 3. 3 global demand drags Germany with its GDP Growth confirmed at 0.3% in Q3. But we do witness a faster increase in its household and government spending which supports its long-term growth. Japan The fundamentals of Japan’s economy is not that optimistic recently. GDP have contracted for second quarter in a row, which, indeed is the rule we define the recession. And the recent announcement of BOJ which is far from being desirable further disappointed market. In the long run, the future of Japan’s economy is quite uncertain. Due to the problems of aging and low birth rate, Japan’s shrinking workforce also puts shadows on the future of this nation. So we would sell short on NIKKEI 225 index in 5 years. However, we would bet short-term investment on Japanese market for the simple reason that market may react too much to the headline numbers and we believe that BOJ will extend its monetary easing program shortly with more aggressive moves. Emerging Markets Brazil Although inflation rate for Brazil in Dec reaches 10.48% and now BOVESPA is almost half of its historical highest point which in 2008, we still suggest to hold a long position in the BOVESPA both for short run sight and for long run horizon. For the short run view, Fed raised interest rate on Dec.16th and thus the Brazilian Lira would be weaken consistently and that investor might enter into Brazil stock market as a defensive action. This expectation might push the BOVESPA to a higher point. As for high inflation rate and unemployment rate, we believe that Brazil government would implement positive policy soon as what they did in September 2015, which draw down its inflation rate to 3 months lowest. For the long run view, although many major banks and their hedge fund choose to be conservative on the defensive assets from the emerging market, there are still hedge fund managers suggest that accompanying with Fed’s loss of credibility and its action to raise interest rate, what Brazil experience today is similar to Asian Financial Crisis in 1997, providing an ideal chance to enter a long position at a very low cost. China During recent years, China’s economy has experienced deceleration, reversing the trend of rapid growth in the past decades. Though there is always turmoil and crazy things in Chinese stock market, it still remains an emerging market with a relatively high expected return. This is the reason why we still recommend Chinese stocks. To the great challenges ahead, China is adjusting itself and has carried out some big strategies. During recent years, it plans to reform the construction of its economy in order to transform to a modernized one through the strategies like ”Industrialization 4.0” or “Made in China 2025”, each of which will set off waves of pursuit in capital market. Moreover, it has also launched “One Road One Belt” strategy which is a unprecedented international cooperation led by China ranging from Southeast Asia to Middle East, as well as the establishment of AIIB (Asian Infrastructure Investment Bank). It brings a huge demands for Chinese investment abroad, which we believe is
  • 4. 4 also a good news for Chinese listed firms. Commodities Gold According to latest report from Nomura, world gold price is on the fourth stage of a rising wedge, and they predict that the price would complete its adjustment after one rebounding and one falling down. After successive falling down during last eight weeks, gold price started going back this week after the news that Fed raised interest rate. Bloomberg released a report recently showing that the majority of analysts predict a bull market for gold in 2016. Taking into account the low correlation between gold and other assets, we think it is wise to include gold into our portfolio for both reducing risk and gaining expected returns. Oil On Dec. 11th 2015, U.S Congress killed the oil export ban which boost the demand for U.S oil and also boost the WTI oil price for the short run. Under this circumstances, we recommend to hold large weight of long position on oil in our portfolio for the short run, However, from the long run view, the world oil market is experiencing a period where supply is over the demand, oil price fluctuates around a low level and the impact of basic transport cost, the Fed’s action play an insignificant role in boosting oil export and may have little impact for Chinese or other oil market. And considering the high correlation between oil and other assets, we support the idea to reduce oil weight in our portfolio on the long run. Our Recommendation Since many empirical studies have shown that most investors cannot outperform the market, simply investing in stock indexes may be a more efficient and time-saving strategy than selecting stocks. With passive investment equity markets and global allocation among different countries, U.S. treasury bonds and commodity futures, we try to achieve the highest desirable return concerning the risk averse level and market volatility. Tactical The short term allocated portfolio weights are showed in figure below. In short term, for example, 1 year, we could take more aggressive strategy to maximize our profit. Regionally, we encourage more investment on emerging markets. Despite of the recent economy slow-down and stock market turmoil, we still can see great potential in Chinese stock market. Also, as we stated above, we are betting on the gold price would rise dramatically on the near future because we see increasing volatility in recent years and we believe it will continue the trend. As for the short investment on US 10-year Treasury bond, it’s more like a way of making “easy
  • 5. 5 money” because Fed is expected to gradually increase the interest rate, which will lead to a lower bond price. Strategic In the long run, for example, 5 years, we suggest the allocation weights of different assets as the following figure. In the long run, we recommend emerging markets equities for its long-term growth potential after the necessary reforms for the challenges they face today. Also, we cannot ignore the stable growth in developed markets. So we long the stocks in U.S., Germany and France at a weight from 8.79% to 21.43%. Since U.K. stock market, which has a relatively high correlation with other G7 markets, shows a similar volatility but lower risk. Its role is replaced by U.S. stocks. We short Japanese stocks because we are worried about the downward possibility and uncertainty of the future of Japan’s economy. We think gold and oil prices may experience an increase in the near future since they both are in the low level.
  • 6. 6 Appendix Mean-Variance Optimization In this report, we based all results on the Mean-Variance Optimization model. In order to estimate the expected returns of each assets in our portfolio, we collect monthly return data for S&P 500 (U.S.), FTSE 100 (U.K.), DAX (Germany), CAC 40 (France), NIKKEI 225 (Japan), BOVESPA (Brazil), SSE (China), 10-year Treasury bond yield, gold price and WTI oil price. Then we collect each monthly growth rate for them from 1995 to 2015. The descriptive statistical is shown as below. S&P FTSE DAX CAC NIKKEI BOVESPA SSE 10-yr GOLD OIL r 0.69% 0.37% 0.90% 0.56% 0.10% 1.08% 1.19% 0.35% 0.53% 0.75% σ 4.36% 4.09% 6.95% 6.23% 5.70% 11.77% 8.48% 0.12% 4.75% 9.20% Based on this result, we calculate their correlations𝜌𝑖,𝑗 in order to get the portfolio correlation through 𝜎2 (𝑝) = ∑ 𝑤𝑖 2 𝑘 𝑖=1 𝜎2 (𝑟𝑖) + ∑ 2𝑤𝑖 𝑤𝑗 𝜌𝑖𝑗 𝜎𝑖 𝜎𝑗 𝑖≠𝑗 Then we set our risk bear ratio alpha, using the excel to solve the optimization model. Optimization model: 𝑀𝑎𝑥𝐸(𝑝) = ∑ 𝑤𝑖 𝑘 𝑖=1 𝐸(𝑟𝑖) − 1/2𝛼𝜎2 (𝑟𝑖), ∑ 𝑤𝑖 𝑘 𝑖=1 = 1