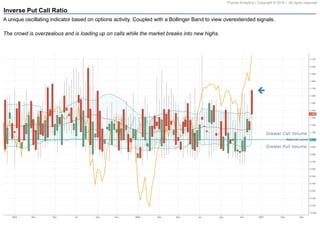
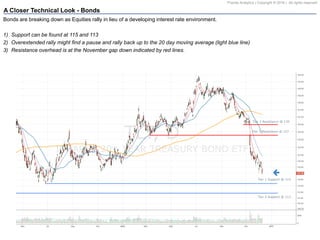
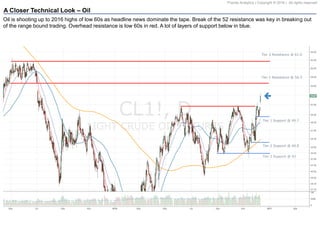
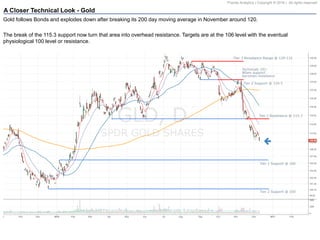
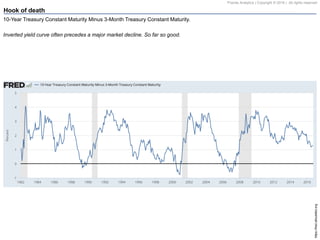
The document provides a summary of market conditions and technical analysis as of December 2016. Key points include:
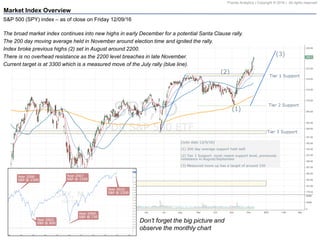
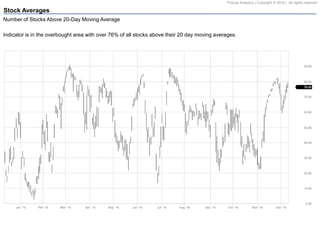
1) The S&P 500 index continues to reach new highs and break through resistance levels. No overhead resistance is seen as the 2200 level was breached in late November.
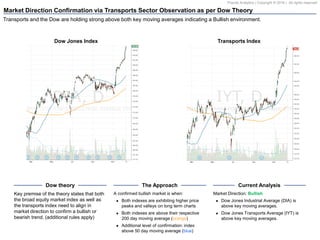
2) Both the Dow Jones Industrial Average and Dow Jones Transportation Average are above their key moving averages, confirming a bullish market trend according to Dow Theory.
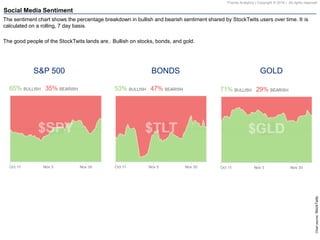
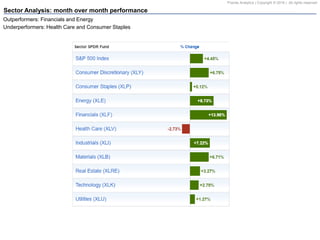
3) Sentiment on StockTwits is bullish across stocks, bonds, and gold. Most indexes are performing well with outperformers in the financial and energy sectors.