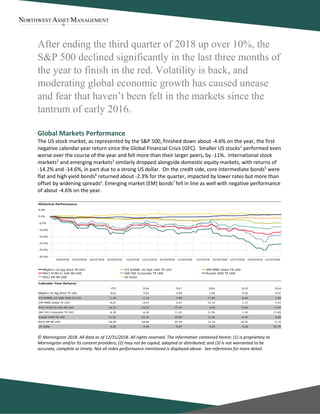
The S&P 500 finished 2018 in negative territory for the first time since 2008, down -4.6% for the year. Volatility increased significantly across global markets as economic growth moderated and trade tensions rose. The CBOE Volatility Index increased 130% in 2018 compared to 78% in 2008, indicating a more turbulent decline. Investor unease over trade and monetary policy contributed to the rise in volatility, exemplified by an 8% market fall following the Federal Reserve's signal of slightly more aggressive rate hikes than expected in 2019.
Are the good times here to stay or are we hearing the Sirens’ call? Since 2008, investors have been on an odyssey. Gradually, stock markets have managed to recover from the disastrous carnage precipitated by the financial crisis of 2007 and 2008. It has been an uneven path back to current market levels as there have been many occasions when it appeared that the fragile recovery would be stymied by bickering politicians, slowing emerging economies, deflationary pressures, regulatory zeal, civil unrest in the Middle East, over spent consumers, etc
No bubble trouble; stocks are still reasonably priced. This credit cycle has unique characteristics that continue to make high-yield bonds attractive. Interest-rate volatility poses greater risk than higher rates themselves.
It has been seven years since the last financial crisis. In that seven-year period, the total global debt has increased by even more than it did in the seven years previous (2000-2007). From the end of 2007 through to the end of the first half of last year, total global debt increased by 40%, or $US 57 TRILLION! This massive increase in debt has been a consequence of easy money in a low interest rate environment aided and abetted by programs of quantitative easing (the provision of liquidity by central banks) in order to promote economic growth and investment.
The first quarter managed to record some positive results overall, despite severe declines in some sectors.
THIRD QUARTER 2015 RETROSPECTIVE AND PROSPECTIVE We’ve Seen This Movie BeforeRobert Champion
Global markets remained in turmoil as concerns regarding the global economy persisted. While much of the international focus was centred around the slowing economy in China, there were few places that investors could hide as even cash, paying little to negative interest in some parts of the world, was a relative winner in the quarter.
As Fed tapering unfolds, we expect to see stronger growth from developed markets, while emerging markets in aggregate may experience further currency and capital market weakness. In the United States, declining labor participation continues to drive falling unemployment figures, and may harbor the beginning of a wage inflation surprise.
• We expect credit, liquidity, and prepayment risks will continue to
be rewarded by the market in the months ahead, while interestrate
risk remains unattractive due to its asymmetric risk profile.
The global economy is improving overall, with the U.S. and U.K. leading the way. We expect higher GDP growth from the U.S. to support risk assets in the third quarter. We continue to expect a rise in U.S. interest rates in 2014, though eurozone policy may help slow a near-term increase. We favor credit, prepayment, and liquidity risks, which we express in allocations to mezzanine CMBS, peripheral European sovereigns, select EM sovereigns, and interest-only (IO) CMOs.
U.S. equities continued their impressive advance, with
no significant declines during the quarter. In Europe, policy changes may function as an important tailwind for growth and market performance. Globally, M&A activity has been on the rise, giving a boost to equity prices across the market-cap spectrum. The current bull market has been significant — in terms of both length and magnitude.
Signs of inflation will raise the stakes for the Fed’s policy communications. Favorable conditions for leveraged strategies could reverse quickly. Reasonable valuations and the Fed’s policy goals continue to support risk assets.
Economies are the cumulative reflection of the myriad of transactions taking place every day. In order for a transaction to take place, there must be a buyer and a seller. Both parties to the transaction believe that they are receiving adequate compensation, no matter on which side of the trade they reside. In financial markets, buyers and sellers are expressing differing expectations for the object being sold. Markets have continued to rise for a long period of time, indicative of there being more optimism that economic conditions will continue to improve. The question is: Will these expectations continue to be validated or will those positive expectations be overwhelmed by economic and geopolitical factors that have underpinned the rising markets to date? Are we at the dawn of a new era or the dusk of an era that has run its course?
« Market Perspectives » est notre revue mensuelle des marchés. Elle présente de la façon la plus synthétique possible :
- notre analyse des principaux faits marquants et indicateurs macro susceptibles de dessiner les marchés sur le mois.
- notre vision sur les différentes classes d’actifs
Cette revue sera continument enrichie avec nos indicateurs quantitatifs.
La plupart de nos analyses sont disponibles sur www.finlightresearch.com
Our monthly publication “Market Perspectives” presents a synthetic view of all the asset classes we cover.
The report is composed of six sections covering Macro, Equities, FI & credit, FX, Commodities and Alternatives.
Each section is preceded by a summary of our views on the related asset class.
Most of our publications are available on our web site www.finlightresearch.com
Summary
Despite pockets of strength, stocks remain in consolidation mode
Elevated volatility of first half unlikely to ebb in second half
Sentiment at mid-year shows optimism and elevated expectations
Second-half pullback could provide strong foundation for continuation of cyclical rally
Domestic demand in some of the key rapid-growth markets (RGMs) has faltered recently and - whilst most rapid growth market economies continue to prosper - their growth trajectory seems more varied. Increasingly investors are reassessing risks.
We currently project RGMs to grow by 4.6% on average in 2013 and more close to 6% in subsequent years.
Our monthly publication “Market Perspectives” presents a synthetic view of all the asset classes we cover.
The report is composed of six sections covering Macro, Equities, FI & credit, FX, Commodities and Alternatives.
Each section is preceded by a summary of our views on the related asset class.
Most of our publications are available on our web site www.finlightresearch.com
If U.S. politics do not derail the recovery, pent-up demand can drive faster economic growth. Fixed-income outflows appear likely to continue, pushing rates higher.
Why Global Diversification Matters By Anthony Davidow Ap.docxgauthierleppington
Why Global Diversification Matters
By Anthony Davidow
April 02, 2018
Over the past few years, some investors have begun to question the merits of global asset
allocation. They wonder whether the risks abroad justify investing money outside the United
States—and whether there truly are diversification benefits to doing so. Some have even
challenged Modern Portfolio Theory itself, which emphasizes the long-term benefits of a
diversified portfolio.
In some ways it’s natural. It’s an unpredictable world, and investors worry about market
volatility both at home and abroad. Everything from political questions in the wake of the U.K.’s
“Brexit” vote in the summer of 2016 to the recent U.S. elections to anticipation of the Federal
Reserve raising rates have indeed contributed to market swings.
Moreover, in investing—as in sports and other areas of life—people often exhibit familiarity bias
(“home-country bias” in this case). We’re inclined to believe in and root for the things that we
know best. While this may be human nature, home-country bias limits an investor’s universe of
available opportunities. Worse, it may not be prudent given the nature of today’s global markets:
According to MSCI data, roughly half of all global companies are based outside the United
States, which corresponds to global gross domestic product (GDP) ratios.
Do you really want to limit your investment opportunities by half? How can you overcome
home-country bias?
As the saying goes…
Times like these show why the adage “don’t put all your eggs in one basket” is so vital for
investors. An investment sector that performs well one month or year might be a poor performer
the next. For example, as the chart below shows, emerging market stocks were the worst
performer in 2008—only to rebound back to the top in 2009 and also 2017. More recently,
international developed stocks were among the top performers in 2017, after placing near the
bottom in 2016.
Over the long run, there’s no discernible pattern to the rotation among the top performers, so it
doesn’t make much sense to concentrate all your investments in a particular region or asset class.
A globally diversified portfolio—one that puts its eggs in many baskets, so to speak—tends to be
better positioned to weather large year-over-year market gyrations and provide a more stable set
of returns over time.
How key asset classes compare to a diversified portfolio
Source: Morningstar Direct and the Schwab Center for Financial Research. Data is from January 1, 2008, to December 31, 2017. Asset class
performance represented by annual total returns for the following indexes: S&P 500® Index (U.S. Lg Cap), Russell 2000® Index (U.S. Sm Cap),
MSCI EAFE® net of taxes (Int’l Dev), MSCI Emerging Markets IndexSM (EM), S&P United States REIT Index and S&P Global Ex-U.S. REIT
Index (REITs), S&P GSCI® (Commodities), Bloomberg Barclays U.S. Treasury Inflation-Protection Securities (TIPS) Index, Bloo.
Jeff Pesta • LPL Financial
- Is it time to retire your strategy, manager, fund, or ETF? by Dave Moenning
- Dollar strength has uncertain implications
- The Anchored Momentum Indicator by Ron Rowland
- Converting positive feedback into new business (Steve Molesky, Kalos Capital Inc.)
Through all the market traumas of recent years, the crises in Greece, slowdown scares in China, US political gridlock, the collapse in oil prices, the wars and the migrant flows, investors prepared to weather short-term volatility have seen handsome returns on developed-economy equities since the depths of the financial crisis in 2008, with EUR and USD investors seeing only one modestly down year in 2011. There has also been good performance from high yield and investment grade corporate bonds, the laggards (since 2011) being investments connected to commodities and emerging markets.
Our analysis, set out in this Outlook, suggests that 2016 may deliver a fairly similar pattern. Temporary traumas could emanate from Federal Reserve tightening, reduced bond liquidity, renewed growth scares in China or geopolitics, but behind these is an underlying picture of ongoing expansion. The global economy is neither pushed up against capacity limits nor facing severe slack (except for commodities and energy), banking systems are healthy and debt levels seem more amber than red. Rapid growth seems unlikely, given aging populations (bar Africa and India) and sharing economy technologies that do not generate much Gross Domestic Product, but sensibly-priced assets do not need a booming economy to generate reasonable returns. At the time of writing (in late 2015), high yield and investment grade credits have spreads just above their quarter-century averages, giving them scope to weather gradual Fed tightening. Developed equities have valuations somewhat above historic norms on a price-earnings basis, but not on a price-book basis, and operational leverage (especially in the Eurozone) and consolidating oil prices should allow earnings growth to move from last year's negatives into the mid- to high-single digits. In short, we think developed equities and credits are well placed for another year of reasonable returns, with the dollar likely to be strong again as the Fed leads the monetary cycle. As for emerging markets, and the commodities on which many depend, a convincing general recovery looks some time away, but there is scope for some to move ahead of the pack, as discussed in a special article.
Of course there can always be risks that are not visible and Fed tightening has a habit of teasing these out, although usually not within its first year. But, equally, there could be upside surprises, if the USA finally moves toward solutions on taxing repatriated corporate cash and infrastructure spending or, more simply, the signals of rising confidence already visible in US and European consumer surveys translate into faster spending. We trust our readers will find the Investment Outlook 2016 to be of considerable interest for the coming year.
Still keeping your money on the sidelines because you are nervous about the market? Take a look at this article to see some of the unintended risks of inaction.
Poonawalla Fincorp and IndusInd Bank Introduce New Co-Branded Credit Cardnickysharmasucks
The unveiling of the IndusInd Bank Poonawalla Fincorp eLITE RuPay Platinum Credit Card marks a notable milestone in the Indian financial landscape, showcasing a successful partnership between two leading institutions, Poonawalla Fincorp and IndusInd Bank. This co-branded credit card not only offers users a plethora of benefits but also reflects a commitment to innovation and adaptation. With a focus on providing value-driven and customer-centric solutions, this launch represents more than just a new product—it signifies a step towards redefining the banking experience for millions. Promising convenience, rewards, and a touch of luxury in everyday financial transactions, this collaboration aims to cater to the evolving needs of customers and set new standards in the industry.
NO1 Uk Divorce problem uk all amil baba in karachi,lahore,pakistan talaq ka m...Amil Baba Dawood bangali
Contact with Dawood Bhai Just call on +92322-6382012 and we'll help you. We'll solve all your problems within 12 to 24 hours and with 101% guarantee and with astrology systematic. If you want to take any personal or professional advice then also you can call us on +92322-6382012 , ONLINE LOVE PROBLEM & Other all types of Daily Life Problem's.Then CALL or WHATSAPP us on +92322-6382012 and Get all these problems solutions here by Amil Baba DAWOOD BANGALI
#vashikaranspecialist #astrologer #palmistry #amliyaat #taweez #manpasandshadi #horoscope #spiritual #lovelife #lovespell #marriagespell#aamilbabainpakistan #amilbabainkarachi #powerfullblackmagicspell #kalajadumantarspecialist #realamilbaba #AmilbabainPakistan #astrologerincanada #astrologerindubai #lovespellsmaster #kalajaduspecialist #lovespellsthatwork #aamilbabainlahore#blackmagicformarriage #aamilbaba #kalajadu #kalailam #taweez #wazifaexpert #jadumantar #vashikaranspecialist #astrologer #palmistry #amliyaat #taweez #manpasandshadi #horoscope #spiritual #lovelife #lovespell #marriagespell#aamilbabainpakistan #amilbabainkarachi #powerfullblackmagicspell #kalajadumantarspecialist #realamilbaba #AmilbabainPakistan #astrologerincanada #astrologerindubai #lovespellsmaster #kalajaduspecialist #lovespellsthatwork #aamilbabainlahore #blackmagicforlove #blackmagicformarriage #aamilbaba #kalajadu #kalailam #taweez #wazifaexpert #jadumantar #vashikaranspecialist #astrologer #palmistry #amliyaat #taweez #manpasandshadi #horoscope #spiritual #lovelife #lovespell #marriagespell#aamilbabainpakistan #amilbabainkarachi #powerfullblackmagicspell #kalajadumantarspecialist #realamilbaba #AmilbabainPakistan #astrologerincanada #astrologerindubai #lovespellsmaster #kalajaduspecialist #lovespellsthatwork #aamilbabainlahore #Amilbabainuk #amilbabainspain #amilbabaindubai #Amilbabainnorway #amilbabainkrachi #amilbabainlahore #amilbabaingujranwalan #amilbabainislamabad
when will pi network coin be available on crypto exchange.DOT TECH
There is no set date for when Pi coins will enter the market.
However, the developers are working hard to get them released as soon as possible.
Once they are available, users will be able to exchange other cryptocurrencies for Pi coins on designated exchanges.
But for now the only way to sell your pi coins is through verified pi vendor.
Here is the telegram contact of my personal pi vendor
@Pi_vendor_247
Even tho Pi network is not listed on any exchange yet.
Buying/Selling or investing in pi network coins is highly possible through the help of vendors. You can buy from vendors[ buy directly from the pi network miners and resell it]. I will leave the telegram contact of my personal vendor.
@Pi_vendor_247
how can I sell pi coins after successfully completing KYCDOT TECH
Pi coins is not launched yet in any exchange 💱 this means it's not swappable, the current pi displaying on coin market cap is the iou version of pi. And you can learn all about that on my previous post.
RIGHT NOW THE ONLY WAY you can sell pi coins is through verified pi merchants. A pi merchant is someone who buys pi coins and resell them to exchanges and crypto whales. Looking forward to hold massive quantities of pi coins before the mainnet launch.
This is because pi network is not doing any pre-sale or ico offerings, the only way to get my coins is from buying from miners. So a merchant facilitates the transactions between the miners and these exchanges holding pi.
I and my friends has sold more than 6000 pi coins successfully with this method. I will be happy to share the contact of my personal pi merchant. The one i trade with, if you have your own merchant you can trade with them. For those who are new.
Message: @Pi_vendor_247 on telegram.
I wouldn't advise you selling all percentage of the pi coins. Leave at least a before so its a win win during open mainnet. Have a nice day pioneers ♥️
#kyc #mainnet #picoins #pi #sellpi #piwallet
#pinetwork
how to swap pi coins to foreign currency withdrawable.DOT TECH
As of my last update, Pi is still in the testing phase and is not tradable on any exchanges.
However, Pi Network has announced plans to launch its Testnet and Mainnet in the future, which may include listing Pi on exchanges.
The current method for selling pi coins involves exchanging them with a pi vendor who purchases pi coins for investment reasons.
If you want to sell your pi coins, reach out to a pi vendor and sell them to anyone looking to sell pi coins from any country around the globe.
Below is the contact information for my personal pi vendor.
Telegram: @Pi_vendor_247
If you are looking for a pi coin investor. Then look no further because I have the right one he is a pi vendor (he buy and resell to whales in China). I met him on a crypto conference and ever since I and my friends have sold more than 10k pi coins to him And he bought all and still want more. I will drop his telegram handle below just send him a message.
@Pi_vendor_247
USDA Loans in California: A Comprehensive Overview.pptxmarketing367770
USDA Loans in California: A Comprehensive Overview
If you're dreaming of owning a home in California's rural or suburban areas, a USDA loan might be the perfect solution. The U.S. Department of Agriculture (USDA) offers these loans to help low-to-moderate-income individuals and families achieve homeownership.
Key Features of USDA Loans:
Zero Down Payment: USDA loans require no down payment, making homeownership more accessible.
Competitive Interest Rates: These loans often come with lower interest rates compared to conventional loans.
Flexible Credit Requirements: USDA loans have more lenient credit score requirements, helping those with less-than-perfect credit.
Guaranteed Loan Program: The USDA guarantees a portion of the loan, reducing risk for lenders and expanding borrowing options.
Eligibility Criteria:
Location: The property must be located in a USDA-designated rural or suburban area. Many areas in California qualify.
Income Limits: Applicants must meet income guidelines, which vary by region and household size.
Primary Residence: The home must be used as the borrower's primary residence.
Application Process:
Find a USDA-Approved Lender: Not all lenders offer USDA loans, so it's essential to choose one approved by the USDA.
Pre-Qualification: Determine your eligibility and the amount you can borrow.
Property Search: Look for properties in eligible rural or suburban areas.
Loan Application: Submit your application, including financial and personal information.
Processing and Approval: The lender and USDA will review your application. If approved, you can proceed to closing.
USDA loans are an excellent option for those looking to buy a home in California's rural and suburban areas. With no down payment and flexible requirements, these loans make homeownership more attainable for many families. Explore your eligibility today and take the first step toward owning your dream home.
Latino Buying Power - May 2024 Presentation for Latino CaucusDanay Escanaverino
Unlock the potential of Latino Buying Power with this in-depth SlideShare presentation. Explore how the Latino consumer market is transforming the American economy, driven by their significant buying power, entrepreneurial contributions, and growing influence across various sectors.
**Key Sections Covered:**
1. **Economic Impact:** Understand the profound economic impact of Latino consumers on the U.S. economy. Discover how their increasing purchasing power is fueling growth in key industries and contributing to national economic prosperity.
2. **Buying Power:** Dive into detailed analyses of Latino buying power, including its growth trends, key drivers, and projections for the future. Learn how this influential group’s spending habits are shaping market dynamics and creating opportunities for businesses.
3. **Entrepreneurial Contributions:** Explore the entrepreneurial spirit within the Latino community. Examine how Latino-owned businesses are thriving and contributing to job creation, innovation, and economic diversification.
4. **Workforce Statistics:** Gain insights into the role of Latino workers in the American labor market. Review statistics on employment rates, occupational distribution, and the economic contributions of Latino professionals across various industries.
5. **Media Consumption:** Understand the media consumption habits of Latino audiences. Discover their preferences for digital platforms, television, radio, and social media. Learn how these consumption patterns are influencing advertising strategies and media content.
6. **Education:** Examine the educational achievements and challenges within the Latino community. Review statistics on enrollment, graduation rates, and fields of study. Understand the implications of education on economic mobility and workforce readiness.
7. **Home Ownership:** Explore trends in Latino home ownership. Understand the factors driving home buying decisions, the challenges faced by Latino homeowners, and the impact of home ownership on community stability and economic growth.
This SlideShare provides valuable insights for marketers, business owners, policymakers, and anyone interested in the economic influence of the Latino community. By understanding the various facets of Latino buying power, you can effectively engage with this dynamic and growing market segment.
Equip yourself with the knowledge to leverage Latino buying power, tap into their entrepreneurial spirit, and connect with their unique cultural and consumer preferences. Drive your business success by embracing the economic potential of Latino consumers.
**Keywords:** Latino buying power, economic impact, entrepreneurial contributions, workforce statistics, media consumption, education, home ownership, Latino market, Hispanic buying power, Latino purchasing power.
how can i use my minded pi coins I need some funds.DOT TECH
If you are interested in selling your pi coins, i have a verified pi merchant, who buys pi coins and resell them to exchanges looking forward to hold till mainnet launch.
Because the core team has announced that pi network will not be doing any pre-sale. The only way exchanges like huobi, bitmart and hotbit can get pi is by buying from miners.
Now a merchant stands in between these exchanges and the miners. As a link to make transactions smooth. Because right now in the enclosed mainnet you can't sell pi coins your self. You need the help of a merchant,
i will leave the telegram contact of my personal pi merchant below. 👇 I and my friends has traded more than 3000pi coins with him successfully.
@Pi_vendor_247
The European Unemployment Puzzle: implications from population agingGRAPE
We study the link between the evolving age structure of the working population and unemployment. We build a large new Keynesian OLG model with a realistic age structure, labor market frictions, sticky prices, and aggregate shocks. Once calibrated to the European economy, we quantify the extent to which demographic changes over the last three decades have contributed to the decline of the unemployment rate. Our findings yield important implications for the future evolution of unemployment given the anticipated further aging of the working population in Europe. We also quantify the implications for optimal monetary policy: lowering inflation volatility becomes less costly in terms of GDP and unemployment volatility, which hints that optimal monetary policy may be more hawkish in an aging society. Finally, our results also propose a partial reversal of the European-US unemployment puzzle due to the fact that the share of young workers is expected to remain robust in the US.
how to sell pi coins in all Africa Countries.DOT TECH
Yes. You can sell your pi network for other cryptocurrencies like Bitcoin, usdt , Ethereum and other currencies And this is done easily with the help from a pi merchant.
What is a pi merchant ?
Since pi is not launched yet in any exchange. The only way you can sell right now is through merchants.
A verified Pi merchant is someone who buys pi network coins from miners and resell them to investors looking forward to hold massive quantities of pi coins before mainnet launch in 2026.
I will leave the telegram contact of my personal pi merchant to trade with.
@Pi_vendor_247
Introduction to Indian Financial System ()Avanish Goel
The financial system of a country is an important tool for economic development of the country, as it helps in creation of wealth by linking savings with investments.
It facilitates the flow of funds form the households (savers) to business firms (investors) to aid in wealth creation and development of both the parties
how to sell pi coins in South Korea profitably.DOT TECH
Yes. You can sell your pi network coins in South Korea or any other country, by finding a verified pi merchant
What is a verified pi merchant?
Since pi network is not launched yet on any exchange, the only way you can sell pi coins is by selling to a verified pi merchant, and this is because pi network is not launched yet on any exchange and no pre-sale or ico offerings Is done on pi.
Since there is no pre-sale, the only way exchanges can get pi is by buying from miners. So a pi merchant facilitates these transactions by acting as a bridge for both transactions.
How can i find a pi vendor/merchant?
Well for those who haven't traded with a pi merchant or who don't already have one. I will leave the telegram id of my personal pi merchant who i trade pi with.
Tele gram: @Pi_vendor_247
#pi #sell #nigeria #pinetwork #picoins #sellpi #Nigerian #tradepi #pinetworkcoins #sellmypi
2. The Guns of December
In our fourth quarter missive exactly one year ago, we mentioned the likelihood of volatility picking up in
2018 and the years beyond. As 2018 has now come to a close, it comes as no surprise to most that
volatility did indeed increase amidst the clamor of trade conflicts, Federal Reserve policy, and rising
interest rates. The CBOE Market Volatility Index (VIX), which measures the volatility of the S&P 500b
,
increased an astounding 130% in 2018. As a point of reference, the VIX rose by only 78% in 2008 during
the depths of the GFC.
So while the markets may have not fallen as hard as they did ten years ago, the manner in which they
fell this year has been much more turbulent. Part of this return to volatility can be attributed to a
regression to the mean, as 2017 witnessed a nearly unprecedented lack of such. But the remainder
must be credited to investor unease over both global trade concerns and monetary policy convergencec
.
A testament to the market’s fascination with monetary policy can be seen following the December
meeting of the Federal Reserve’s Federal Open Market Committee (FOMC), which sets monetary policy
for the central bank. The market fell nearly 8% in the four days following the meeting. The culprit? The
FOMC planned slightly more aggressive monetary policy for 2019 than was widely believedd
.
And this alludes to a central theme in markets that investors should appreciate – namely, that markets
are forward-looking and thus largely moved not by the current fundamentals but by expectations of the
future fundamentals. In other words, markets tend to move well in advance of any pickup or
deterioration in economic growth.
Source: Goldman Sachs Global Investment Research, Bloomberg8.
3. We Go Together…For Now
As the famous song from Grease goes, “we go together…that’s the way it should be.” But in markets
and across asset classes, that’s not the way it historically has been or academically should be. Modern
portfolio theorye
, one of the newer theories in financial academia, argues that diversifying one’s
investments across stocks, bonds, and other assets should create a portfolio of securities with offsetting
return and risk profiles. In other words, when stocks go up, bonds should go down, and vice versa.
This phenomenon is known as inverse correlationf
, and it has become the bedrock on which modern
investment theory has been built. From the early 1980s until 2016, the levels of interest rates in the US
had been on a steady decline. But in mid-2016, following the first rate hike by the Federal Reserve since
the GFC, interest rates broke that trend and began increasing.
What happens from here, should rates continue to move higher, is unproven ground in modern financial
theory. According to theory, rising rates would lead to depressed or negative fixed income returns, on
average, regardless of concurrent equity performance. And that is a frustrating prospect for investors
who have depended on a simple stock-bond portfolio for asset growth, income and stability.
However, it’s important to note that even with rising interest rates, the coupon income attached to
fixed income securities is generally sufficient to balance out that increaseg
. This should become more
evident if rates climb higher. Why? Because fixed income price returns are derived by the rate of
change of interest rates, while the coupons are derived by the level of rates. So as bonds are issued with
higher yields, the elevated coupon income can act as a stronger buffer to further price increases.
Historical 10 Year Treasury Rates
Source: Macrotrends9.
A Brief History Of Time And Cycles
For the past several years there have been countless market watchers calling for the end of the current
bull market. Some have cited its length, some elevated valuationsh
, and others have pointed to
troubling fiscal issues such as high debt levels. There are valid concerns in all of these arguments. But
4. accurately calling the end of a bull market is notoriously difficult, and long-term investors should avoid
trying to time the markets.
However, as professional investor Howard Marks so bluntly puts it, “we may never know where we’re
going, but we’d better have a good idea where we are…and act accordingly10
.” There are many sources
and data points that we can look at to figure out where we are, but two of the most intriguing are debt
levels and the yield curvei
.
Debt levels around the world are high. Households, corporations and governments around the world
have increased their debt since the Global Financial Crisis, and debt in just about every measure is
higher today than it was in 200711
. Increasing debt spurs growth in the short term, but it takes away
from future growth as higher savings will eventually be needed to repay that debt.
Turning to yields, the yield curve
graphs the level of interest rates by
maturity. In previous outlooks
we’ve mentioned the 10-2 yield
curve, which measures the
difference in yield between a 10-
year Treasury bond and 2-year
Treasury note. This curve continued
to flatten throughout 2018, which
has historically been a precursor for
recessions (see chart). Should the
curve continue to flatten or invert, it
may be time for investors to
reevaluate their allocations. When
or if that happens, however, is
something that we’ll have to wait
and see.
Source: Oppenheimer 2019 Outlook12.
Looking Forward
The coming year will likely present investors with an environment that echoes the drama of 2018.
Markets move in cycles, so while no two years will be exactly the same, they do trend. It’s crucial that
investors accept and understand that volatility in markets is normal, and should be expected given the
ever-increasing digitization of the financial world. As always, it’s impossible to predict what’s next, but
it’s essential to maintain a long-term focus, remain diversified, and consult your financial advisor for
questions regarding your financial goals.
Ryan Walsh, CFA® is an investment advisor representative of NWAM, LLC dba Northwest Asset Management and RIA Innovations, an SEC
registered investment advisor. This publication is in no way a solicitation or offer to sell securities or investment advisory services. Statistical
information, quotes, charts, references to articles or any other quoted statement or statements regarding market or other financial information
is obtained from sources which we believe reliable, but we do not warrant or guarantee the timeliness or accuracy of this information. All
domestic and international rights are reserved. No part of this newsletter including text, graphics, et al, may be reproduced or copied in any
format, electronic, print, et al, without written consent from Ryan Walsh, CFA® and RIA Innovations. Neither Ryan Walsh CFA®, nor RIA
Innovations provide legal or tax advice. Please be advised to consult your investment advisor, attorney or tax professional before making any
investment decisions.
5. References:
Smaller US stocks1
– as represented by the Russell 2000 TR Index
International stock markets2 – as represented by the MSCI All Country World ex-USA Index
Emerging markets3
– as represented by the MSCI Emerging Markets TR Index
US Dollar Index4 – as represented by the US Dollar Currency Index (DXY)
Core intermediate bonds5 – as represented by the Bloomberg Barclays US Aggregate Bond Index
High yield bonds6 – as represented by the ICE BofAML US High Yield Index
Emerging market bonds7 – as represented by JPM Emerging Market Bond (EMB) Global Index.
VIX Chart8 – sourced from “Index Volatility,” December 2018, Goldman Sachs.
Treasury Rate Chart9 – sourced from Macrotrends, “10-Year Treasury Bond Rate Yield Chart.”
Howard Marks Quote10
– sourced from “The Most Important Thing,” Howard Marks, page 125, 2016.
Debt Levels11
– sourced from Barron’s article, “A Top Money Manager Sees Rally Nearing Its End,” December 5 2018.
Oppenheimer 2019 Outlook12 – sourced from Oppenheimer 2019 Outlook, “U.S. Lands Softly, Converges with Rest of the World.”
Glossary:
Spreadsa
– the difference in bond yields of the same maturity but differing qualities, e.g. corporate bonds vs. US government bonds.
VIXb – the VIX measures the market’s expectation of 30-day look ahead volatility in the S&P 500 based on the price of options underlying the
index; derivatives, including options, are securities whose prices are derived from other securities and markets.
Global Monetary Policy Convergencec – refers to the phenomenon of global central banks following the same or similar monetary policy
processes, such as raising rates concurrently.
Monetary Policy For 2019d – the Federal Reserve announced its plans to raise interest rates twice in 2019, while the market expected 0-1 hikes.
Additionally, the FOMC planned to continue rolling securities off its balance sheet at the current pace, a move that investors had hoped would
be slowed and/or halted.
Modern Portfolio Theorye
– developed by Harry Markowtiz and first published in the 1950’s, MPT is based on the idea that portfolios can be
constructed utilizing the different risk, return, and correlation characteristics of separate asset classes. Much of modern finance is based on
this principle.
Inverse Correlationf – the property of moving in opposite directions. In investments, it refers to the returns of two assets moving in different
directions, dependent on the strength of the relationship.
Coupons And Ratesg – fixed income returns are derived in two ways: coupons and price appreciation. Coupons are the income paid as a
percentage of the principal value, and price appreciation is the change in price due to the change in rates since the issuance of the securities.
Elevated Valuationsh
– when the financial media and commentators refer to valuations in the markets, they generally refer the forward-looking
P/E ratio, which weighs the current price against the estimated next 12 month earnings of the S&P 500.
Yield Curvei – a graphical representation of the term structure of interest rates. It displays at each issued maturity level what the matching
interest rate is, and links all points to create a fluid curve.